Dynamic Bandwidth Allocation in
CDMA-based Passive Optical
Networks
By Bona Ater
Supervisor: Dr. Hassan Naser
Submitted in partial fulfillment of the requirement for the Degree of Master of Science in Electrical
and Computer Engineering at
Lakehead University
Abstract
Fiber to the home (FTTH) technology is an attractive solution for providing high bandwidth from the Central Office (CO) to residences and small-and medium-sized businesses. The emergence of Internet Protocol-based communication within households such as VoIP, IPTV, video conferencing, and high definition multimedia shows that there is a need for high-capacity networks that can handle differentiated services. By providing an optical fiber link to a household where the optical network unit (ONU) is located, there will be a tremendous increase in information capacity with respect to Digital Subscriber Line and cable modem technologies that are currently in place.
In access networks, Passive Optical Networks (PON) are rapidly replacing copper-based technologies due to a wide range of benefits, one of which is having the capability to transmit data at a higher rate and reach further distances without signal degradation. Under the PON family of technologies, Ethernet PON (EPON) was developed and is specified in the IEEE 802.3 standard outlining the framework that can deliver voice, data, and video over a native Ethernet port to businesses and residential customers. An increasingly important subject to network operators is Quality of Service (QoS). Although the EPON specification provides mechanisms for supporting QoS, it does not specify or define an algorithm for providing QoS. Rather it is up to the CO to design and implement an appropriate algorithm to meet the specifications of services that are offered to their clients. Researchers have extensively studied bandwidth allocation in EPON where the challenge is to develop bandwidth allocation algorithms that can fairly redistribute bandwidth among ONUs based on their demand. These algorithms were developed for the uplink direction, from ONUs to CO, in a network where only a single ONU is permitted to transmit at a time.
Another well-established PON technology is Optical Code-Division Multiple Access PON (OCDMA-PON). In recent years, it has become more economical due to hardware advancements and it has gained a lot of attention due to its benefits over EPON. The most attractive benefit of OCDMA-PON is that multiple ONUs may transmit to the CO
simultaneously, depending on a number of constraints, whereas EPON is limited to a single ONU transmission at a time.
In this thesis, we develop a dynamic bandwidth allocation algorithm called Multi-Class Credit-Based Packet Scheduler (MCBPS) for OCDMA-PON in the uplink direction that supports the Internet Protocol (IP) Differentiated Services and takes advantage of the simultaneous nature of OCDMA. The IP Differentiated Services specifications stipulate the following traffic classifications: Expedited Forwarding for low latency, low packet loss, and low jitter applications; Assured Forwarding for services that require low packet loss; and Best Effort which are not guaranteed any bandwidth commitments. MCBPS incorporates the use of credit pools and the concept of a credit bank system to provide the same services as EPON by assigning ONUs specific timeslots to transmit data and also by specifying the amount of bytes from each class. MCBPS is a central office based algorithm that provides global fairness between Quality of Service (QoS) classes while also ensuring that at any given moment the desired number of simultaneous transmissions is not exceeded. We demonstrate through simulation that MCBPS algorithm is applicable in both EPON and OCDMA-PON environments.
An in-house simulation program written in the C programming language is used to evaluate the effectiveness of the proposed algorithm. The MCBPS algorithm was tested alongside a benchmark algorithm called Interleaved Polling with Adaptive Cycle Time (IPACT) algorithm to compare network throughput, average packet delay, maximum packet delay, and packet loss ratio. From the simulation results it was observed that MCBPS algorithm is able to satisfy the QoS requirements and its performance is comparable to IPACT where the simultaneous transmission is limited to one. The
simulation results also show that as the number of simultaneous transmissions within the network increases, so does the bandwidth. The MCBPS algorithm is able to re-distribute the scaling bandwidth while ensuring that a single ONU or QoS class does not
monopolize all the available bandwidth. In doing so, through simulation results, as the simultaneous transmissions increases, the average packet delay decreases and the packet loss ratio improves.
Acknowledgments
I would like to express my gratitude to my supervisor, Dr. Hassan Naser, for his
guidance and patience throughout the process of writing this thesis. His constant support and encouragement were vital to the completion of this thesis. For that I am sincerely grateful.
Table of Contents
List of Figures ... i List of Tables ... i List of Symbols ... i List of Abbreviations ... 2 Chapter 1 ... 2 1.1 Motivation of Research ... 21.2 Objective and Contribution ... 4
1.3 Thesis Outline ... 5 Chapter 2 ... 6 2.1 Access Networks ... 6 2.2 PON ... 10 2.4 EPON ... 12 2.3 TDMA-based PON... 12 2.5 WDMA-based PON ... 13 2.6 OCDMA-based PON... 14 2.7 Basics of OCDMA ... 14
2.8 Bandwidth Assignment Algorithms in PON ... 25
Chapter 3 ... 30
3.1 Multi-Class Credit-Based Packet Scheduler System Model ... 30
3.2 Transmission Cycle ... 34
3.3 The Credit Bank Structure... 37
3.5 Multi-Class Credit-Based Packet Scheduler (MCBPS) ... 41
Chapter 4 ... 42
4.1 Simulation Model ... 42
4.2 Simulation Results and Analysis ... 45
Chapter 5 ... 56
Conclusion... 56
List of Figures
FIGURE 2.1: ACCESS NETWORKS ARCHITECTURES (A) POINT-TO-POINT. (B) ACTIVE STAR.
(C) PASSIVE STAR. ILLUSTRATION COURTESY OF [6]. 9
FIGURE 2.2: DOWNLINK DIRECTION OF PON. ILLUSTRATION COURTESY OF [11]. 11
FIGURE 2.3: UPLINK DIRECTION OF PON. ILLUSTRATION COURTESY OF [11]. 12
FIGURE 2.4: WDMA-PON WHERE EACH END-POINT IS ASSIGNED A DEDICATED
WAVELENGTH FOR COMMUNICATION. ILLUSTRATION COURTESY OF [18] . 14
FIGURE 2.5: CODE-DIVISION MULTIPLE-ACCESS OPTICAL SYSTEM. 15
FIGURE 2.6: AUTO-CORRELATION OF OOC1 18
FIGURE 2.7: CROSS-CORRELATION OF OOC1 AND OOC2 18
FIGURE 2.8: INCOMING DATA STREAM AT THE RECEIVER 21
FIGURE 2.9: (BER) OF VARIOUS CODE LENGTHS WITH A HAMMING WEIGHT OF 3.
22
FIGURE 2.10: (BER) OF VARIOUS HAMMING WEIGHTS WITH CODE LENGTHS (N) OF
1000. 23
FIGURE 2.11: CODEWORD. ILLUSTRATION COURTESY OF [7]. 24
FIGURE 2.12: COPS DYNAMIC BANDWIDTH ALLOCATION SYSTEM. ILLUSTRATION
COURTESY OF [34]. 28
FIGURE 3.1: GENERIC LEAKY BUCKET 30
FIGURE 3.2: THE LEAKY BUCKET STRUCTURE FOR UPLINK TRAFFIC. 32
FIGURE 3.3: MULTI-CLASS CREDIT-BASED PACKET SCHEDULING (MCBPS) SYSTEM IN THE
OLT 34
FIGURE 3.4: ILLUSTRATIVE EXAMPLE OF A TRANSMISSION CYCLE [34] 35
FIGURE 4.1: AVERAGE PACKET DELAY 46
FIGURE 4.2: PACKET LOSS RATIO 47
FIGURE 4.3: AVERAGE ONU THROUGHPUT 48
FIGURE 4.4: MAXIMUM PACKET DELAY 50
FIGURE 4.5: COS1 AVERAGE PACKET DELAY 51
FIGURE 4.6: COS2 AVERAGE PACKET DELAY 52
FIGURE 4.7: COS3 AVERAGE PACKET DELAY 52
FIGURE 4.8: COS2 PACKET LOSS RATIO 53
FIGURE 4.9: COS3 PACKET LOSS RATIO 54
FIGURE 4.10: COS1 AVERAGE ONU THROUGHPUT 54
FIGURE 4.11: COS2 AVERAGE ONU THROUGHPUT 55
List of Tables
TABLE 2.1: DATA RATES OF VARIOUS EXISTING ACCESS NETWORK TECHNOLOGIES. TABLE COURTESY OF [7]. ... .7
TABLE 2.2: LIST OF CODEWORDS FOR DIFFERENT VALUES OF CODE LENGTH (N) AND
CODE WEIGHT (W), WHEN AUTO-CORRELATION (A) AND CROSS-CORRELATION (C)
List of Symbols Codeword Length Hamming Weight Auto-Correlation Cross-Correlation Johnson Bound Probability Bit Error Decision Threshold Duration of Codeword Chip Time
M Total ONUs in Network
N Simultaneous Transmissions Credit Pool Size
The constant bit rate Generation Rate ONU excess
Sum of ONU demands ( ) associated with set . Total number of ONUs associated with set
Maximum length of a Transmission cycle Incoming Traffic Rate
Number of ONUs in set
The gate transmission time for ONU Round-Trip Time to ONU
Capacity of the transmission link (bytes/s) The length of the grant message
The total requests in the transmission cycle The size in bytes of constant bit rate packet Start of transmission cycle
Maximum number of data bytes can transmit to OLT Guard time
Time required to process algorithm ONU demand in bytes
Credit Bank
Reserved bytes of CoS1 traffic Shape Parameter
Location Parameter
Offered load per traffic source The ONU queue size in bytes
List of Abbreviations
BER Bit Error Rate
BS Base Station
COPS Class-of-Service Oriented Packet Scheduling CoS Class-of-Service
DBA Dynamic Bandwidth Allocation DSL Digital Subscriber Line
EPON Ethernet Passive Optical Network FTTB Fibre to the Building
FTTC Fibre to the Curb FTTH Fibre to the Home FTTN Fibre to the Node
IPACT Interleaved Polling with Adaptive Cycle Time
IPACT-LS Interleaved Polling with Adaptive Cycle Time limited Service LAN Local Area Networks
LB Leaky Bucket
MAI Multiple Access Interference MAN Metropolitan Area Network
ML-OOC Multi-Length Optical Orthogonal Codes
MLVW-OOC Multi-Length Variable Weight Optical Orthogonal Codes OCDMA Optical Code Division Multiple Access
OLT Optical Line Terminal ONU Optical Network Units OOC Optical Orthogonal Codes P2MP Point-to-Multi-Point PON Passive Optical Network QoS Quality of Service
TBFQ Token Bank Fair Queuing TDMATime-Division Multiple Access
VOD Video On Demand
VW-OOC Variable-Weight Optical Orthogonal Codes WAN Wide Area Networks
Chapter 1
Introduction
1.1 Motivation of Research
In the past decade there has been tremendous growth in backbone networks whereas the technological developments of access networks have stagnated. Typically the access network is the connection between residential households and corporate Local Area Networks (LAN) to a backbone network. These types of networks are referred to as the “last mile” and are the bottlenecks that limit high speed connections to the end user. Copper-based Digital Subscriber Lines (DSL) and cable modem technologies have offered substantial bandwidth improvements in comparison to dial-up. However, with today's ever-increasing bandwidth demands, DSL and cable modem technologies are rapidly becoming obsolete. In order to meet the ever increasing demand for IP-based communications such as VoIP, IPTV, video conferencing services and high-definition multimedia, it will be necessary to provide optical links to the end user. By providing an optical link to the end user, there will be a tremendous increase in information capacity that meets both the current and future consumer needs.
Today’s communication networks have become extremely complicated since many different types of networks are interconnected, forming our global network. These networks are typically identified and classified as Local Area Networks (LAN), Access Networks, Metropolitan Area Networks (MAN), or Wide Area Networks (WAN) [1].
LAN – establishes communication between computers, servers, printers, and other electronic devices within an office, a building, or adjacent buildings. Generally, LANs are typically set up with bus, ring, star, or tree topologies with varying combinations. LANs are very small and operate within a given range of
a few meters to a few hundred meters with a bit rate of 1Gbps or 10Gbps or even faster gigabit rates.
Access Network – connects end-users, individual customers, or private
organizations to service providers through twisted pair, coaxial, or fiber to the internet. The distance covered by access networks ranges from a few kilometers to 20km [2]. Individual households are typically connected with Digital Subscriber Line (DSL) or cable modems, whereas business users employ point- to-point fiber links using gigabit-per-second speeds.
MAN – aggregates the traffic produced from access networks and transports it at higher data speeds of 2.5 GB/s or 10 GB/s spanning metropolitan areas. MANs are also connected to other MANs, generally with a fiber optic ring topology.
WAN – Covers the largest geographical area and interconnects MANs within a nation or, in some cases, multiple nations that have operational ranges thousands of kilometers. WANs also form submarine links that connect continents together through point-to-point links with an even larger capacity than MANs.
A Passive Optical Network (PON) is considered to be an attractive solution to the growing bandwidth demands in access networks [3] [4]. PON is a point-to-multi-point (P2MP) optical network that uses passive components (combiners, couplers and splitters) that overcome the bandwidth and distance limitations of the aforementioned copper-based technologies. Among the technologies suggested for PON, Code Division Multiple Access (CDMA) has gained much attention. CDMA technology was originally developed for use in the radio frequency communication systems but has recently been adapted for use in optical networks. One important application of the “Optical” CDMA (OCDMA) technique is in PON, where every ONU is assigned a unique Optical Orthogonal Code (OOC) for transmission and reception. This allows simultaneous access to the central office equipment called Optical Line Terminal (OLT) by all ONUs. The main advantages of the use of OCDMA in PON are its asynchronous nature, high network flexibility, and simplified network control. However, the main drawback of OCDMA is the interference between codewords at the receiver, referred to
as Multiple Access Interference (MAI), which limits the number of ONUs that can simultaneously transmit to the OLT. In order to guarantee a desired Quality of Service (QoS), the number of transmitting ONUs must be restricted. QoS is broadly defined as having the ability to prioritize the demands of different applications, users, or data flow, or to guarantee a certain level of performance.
Within access networks, a multitude of traffic streams must be supported such as voice, video, and data. Each traffic stream requires a certain level of QoS. For instance, voice and video communications are very sensitive to packet delay and delay variations, but they can tolerate a small amount of packet loss.
1.2 Objective and Contribution
This thesis focuses primarily on bandwidth allocation in PON access networks between the ONUs located at end user premises, and OLT stationed at the internet service provider. Developing a bandwidth allocation algorithm is a challenging task that becomes even more challenging when a particular QoS is required or must be guaranteed for all ONUs within the network. Scheduling algorithms are evaluated based on the following criteria [5]:
Fairness: The algorithm should ensure that a reasonable level of fairness is
maintained among all ONUs. One or a few ONUs should not be allowed to monopolize the available resources, and the scheduler should maintain a balance with respect to resources allocated to ONUs.
Complexity: The algorithm should be simplistic in nature and at the component
level. A simple algorithm will need fewer components and will be cost-effective on a large scale. The algorithm should be easy to implement, debug and reconfigure by network operators.
Flexibility: The algorithm should be able to accommodate ONUs with different
algorithm should be able to respond to any unpredictable traffic fluctuations produced at the ONU.
Scalability: The algorithm should work efficiently, even as the number of
ONUs supported in a network varies.
We present a dynamic bandwidth allocation algorithm in the uplink direction in an OCDMA-PON access network that satisfies the above-mentioned criteria. Our centralized algorithm deploys the use of credit pools to manage the simultaneous ONU transmissions. Each ONU is assigned a certain amount of credits which are used to govern the transmission of bytes to the OLT. When packets are generated at an ONU they are separated into queues, where they await transmission, and it is the responsibility of the MCBPS algorithm to determine how many packets from each queue have transmission priority. We assess the performance of the algorithm using an in-house developed simulation program, written in the C programming language. The effectiveness of our proposed algorithm is evaluated based on the following performance metrics: average packet delay, network throughput, maximum packet delay, and packet loss ratio.
1.3 Thesis Outline
The remainder of the thesis is organized as follows: Chapter 2 focuses on the evolution of access network technologies, background information on PONs, and other competing technologies in the optical domain. We also present a brief background of OCDMA theory and review previous developments in algorithms by other researchers in the area of bandwidth allocation. Chapter 3 outlines our system model and dynamic bandwidth allocation (DBA) algorithm called Multi-Class Credit-Based Packet Scheduler. Chapter 4 details our in-house simulation program used to evaluate our algorithm. The results of our simulations are analyzed and compared to the IPACT algorithm which is a well- established DBA algorithm. Chapter 5 concludes with a summary and possible future direction.
Chapter 2
Literature Review
2.1 Access Networks
Due to the rapid adoption of broadband services within our households and businesses, the demand for fast Internet access combined with Quality of Services (QoS) for voice, data, and video has become exceedingly important. New emerging applications such as Video on Demand (VOD), high-definition multimedia, online gaming and peer-to peer file sharing have drastically changed the Internet usage patterns over the past few decades and they will continue to change. Customers now require an always-on, fast Internet connection that conventional access networks can no longer provide due to insufficient bandwidth [6].
Access networks form the bridge between households and businesses to service providers. This link is referred to as the last mile upon which it has to support triple play services: integrated voice, data, and video services. Though backend networks operate in the gigabit range, typically optically linked, the connection between the end user and access network is through copper wire. Due to the infrastructure, the last mile is the bottleneck of the network. Currently, most last mile connections are comprised of twisted pair, coaxial cable, or DSL with its incremental improvements (Asymmetric DSL and Very High-Speed DSL) which are still unable to meet future bandwidth demands.
Technology Spectrum Capacity Shared? Capacity
HFC 7-860 MHz
(Typically 7-550 MHz) 6 MHz per Channel
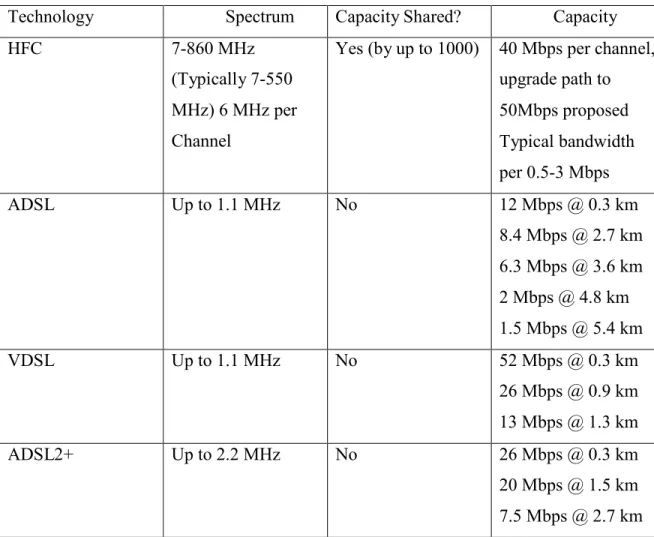
Yes (by up to 1000) 40 Mbps per channel, upgrade path to 50Mbps proposed Typical bandwidth per 0.5-3 Mbps ADSL Up to 1.1 MHz No 12 Mbps @ 0.3 km 8.4 Mbps @ 2.7 km 6.3 Mbps @ 3.6 km 2 Mbps @ 4.8 km 1.5 Mbps @ 5.4 km VDSL Up to 1.1 MHz No 52 Mbps @ 0.3 km 26 Mbps @ 0.9 km 13 Mbps @ 1.3 km ADSL2+ Up to 2.2 MHz No 26 Mbps @ 0.3 km 20 Mbps @ 1.5 km 7.5 Mbps @ 2.7 km
Table 2.1: Data Rates of various existing access network technologies. Table courtesy of [7].
Table 2.1 shows the theoretical data rates at the respective distances from the central office (CO). The further away the end user is from the central office, the lower the data rates. Therefore, fibre to the end users is the next incremental step in meeting the growing bandwidth demands. It will alleviate the bottleneck and is becoming more economically feasible [8] [9]. Optical communication is a very attractive technology because it can transmit a light signal into optical fibers for distances of about 100km, whereas copper- and metallic-based cables are restricted to transmitting electrical signals that can reach only a few kilometers without any signal amplification. However,
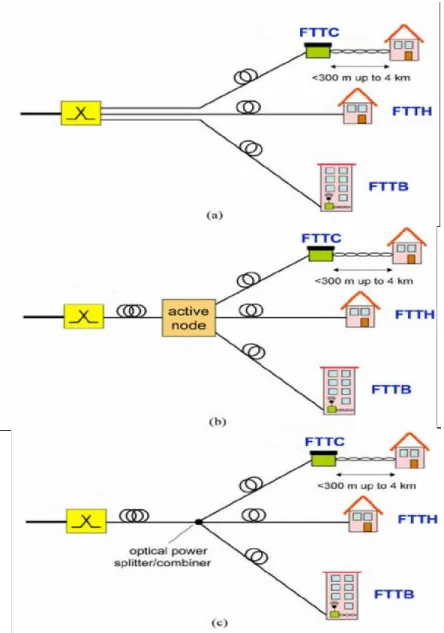
there is no global optimum topology for fiber optical networks. Each topology has its own advantages and disadvantages which may be significant or insignificant, depending on the specific application being considered [10]. The primary schemes of extending fiber to the end user in access networks are: fibre-to-the-node (FTTN), fibre-to-the- building (FTTB), fibre-to-the-home (FTTH) and fibre-to-the-curb (FTTC). Fibre-to-the- x (FTTX) is synonymous to either one of these types of configurations.
There are essentially three architectures that may be deployed in FTTX networks: point-to-point, active star, and passive star as shown in Figure 2.1 [6].
Figure 2.1: Access Networks Architectures (a) Point-to-point. (b) Active Star. (c) Passive Star. Illustration courtesy of [6].
Point-to-Point - is the type of topology where individual optical fibers are connected
from FTTx to the OLT. This would provide the end user with the largest available capacity, but many fibers would be required. Also, each additional ONU added to the network would increase the installation cost. At the OLT, as the number of ONUs increases, floor space and powering may become an issue.
Active Star – With an active star configuration, a single fiber carries all traffic to an active node, which is located closer to the customer’s premises; and from this active node, shorter individual fibers are then connected to the household or building. The active node requires powering and maintenance, and must be designed to withstand outdoor weather, depending on its geographical location. Typically, the active nodes are located inside the cabinet at the street curb from where the communication traffic runs to the home/building through copper or wireless terminals.
Passive Star – In the passive star architecture, the active node is replaced by a passive
splitter that connects directly to the end user. The splitter is a passive component that requires no power to operate, therefore avoiding the high cost of powering and maintenance in comparison to maintaining active equipment in the field. Due to its advantage of conserving power, passive star topology has become very popular within access networks.
2.2 PON
The passive optical network (PON), when deployed in access networks, is generally set up using the tree topology. With a tree topology structure, there is usually one centralized optical line terminal (OLT) and multiple optical network units (ONU). The OLT is located at the service provider and ONUs are usually placed at the customer’s premises shown in Figure 2.2. The passive splitter provides data transparency from OLT to ONUs. Transmission in the downstream direction is said to be in broadcast mode; each ONU in the network will receive data from the OLT even if the traffic is not addressed for that ONU. When the data is not intended for the ONU, it simply discards it.
ONU 1 User 1
OLT ONU 2 User 2
ONU 3 User 3
Figure 2.2: Downlink Direction of PON. Illustration courtesy of [11].
In the upstream direction from ONU to OLT (shown in Figure 2.3), the transmissions from ONUs may potentially cause simultaneous transmission to overlap and cause a data collision. Data collisions may lead to corruption of data and error correction techniques would be required to recover the data. A medium access control mechanism is used to arbitrate transmissions from ONUs to avoid collisions and re-distribute bandwidth and network resources. Multiple wavelengths can also be added to PONs without requiring major modifications to the ONU since each ONU can be tuned to a different wavelength [3] [12].
ONU 1 User 1
OLT ONU 2 User 2
ONU 3 User 3
Figure 2.3: Uplink Direction of PON. Illustration courtesy of [11].
2.4 EPON
Ethernet PON (EPON) is the most widely adopted standardized time division-based multiplexed technology in North America and universally, with over 320 million ports deployed worldwide [13]. EPON is a PON-based network that encapsulates data into Ethernet frames as specified in the IEEE 802.3ae standard with data rates of up to 10Gbit/s for Ethernet with full duplex P2P networks [2]. Essentially, EPON networks relay Ethernet-encapsulated data from LANs to an ONU subscriber port where it is then transmitted via the WAN Ethernet port to the OLT, which makes EPON a natural extension of the LAN networks. It bridges the gap between the LAN and Ethernet-based WAN topologies [14] [15] .
2.3 TDMA-based PON
In Time Division Multiple Access (TDMA)-based PON, multiple transmissions from ONUs may collide while being merged at the power splitter if transmissions are not regulated. To avoid collisions, packet synchronization is required [12]. The OLT synchronizes transmissions by assigning transmission timeslots where only a particular ONU has the permission to transmit and then the packets from all ONUs are interleaved
together to avoid collisions. The major benefit of TDMA is that all ONUs can operate on the same wavelength and the OLT requires only a single transceiver to send and receive data from all the ONUs in the network. The ONUs operate at the line rate and it is up to the OLT to manage bandwidth by varying timeslot durations, so that ONUs receive their fair share of capacity.
2.5 WDMA-based PON
Unlike TDMA-based PON, Wavelength Division Multiple Access (WDMA) – based PON effectively uses different wavelengths to overcome the upstream challenges faced in TDMA, where all the communication occurs on a single wavelength. In WDMA- based PON, shown in Figure 2.4, each ONU is assigned a specific wavelength on which to modulate data, which requires wavelength-tunable lasers and/or tunable optical filters [16]. An optical multiplexer is used to combine all the data from the ONUs onto a single fiber and it is de-multiplexed at the OLT. In addition, the ONU’s wavelength constitutes an independent communication channel that may carry different signal formats. Furthermore, no time synchronization between the channels is required [6]. However, in WDMA-PON the total number of supported ONUs is limited by the number of available wavelengths which is inadequate for large access networks [17].
Figure 2.4: WDMA-PON where each end-point is assigned a dedicated wavelength for communication. Illustration courtesy of [18] .
2.6 OCDMA-based PON
CDMA techniques have been studied extensively in the past in regard to microwave communication due its ability to allow multiple users to randomly access a shared channel at an arbitrary time. It was adapted from the radio domain and applied to the optical domain in 1985 by Saledhi and other researchers, and it has attracted considerable attention ever since [19] [20] [21]. Incremental improvements have grown the technology, making it economically feasible. In optical CDMA, it is possible to generate ultra-short light pulses in the pico-second ( ) or femto-second( ) ranges into pulse trains for encoding data and each node or user in the network is assigned a unique pattern called a codeword or the address/signature.
2.7 Basics of OCDMA
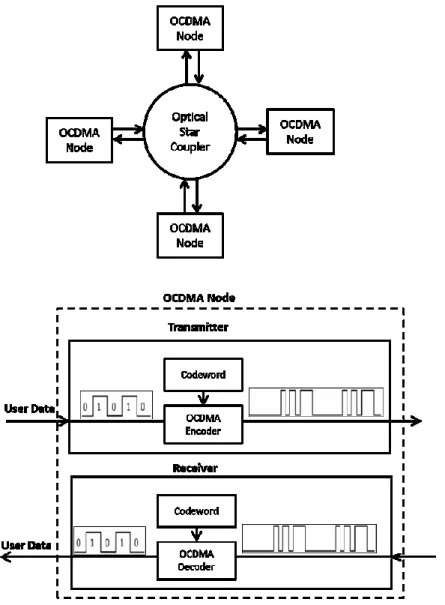
A typical optical fiber network is shown in figure 2.5 where each endpoint/node is equipped with a transmitter and reciever, and are connected via a passive NxN star
coupler. The transmitter optically encodes each bit ‘1’ of source information with a very high rate optical sequence (codeword) into ultra light pulses. The bit ‘0’ of the source information is not encoded and is said to be silent; that is, they are represented by an all- zero sequence. The encoded signal is then coupled into the input of a single-mode fiber and broadcast to all node recievers. The optical code, unique to each node, is called a codeword.
Figure 2.5: Code-Division Multiple-Access Optical System.
Optical Orthonogal Codes (OOC) have been outlined in [19] [20] [22] [23]. An OOC set is defined as a sequence of 0,1,… of length that satisfies certain auto-correlation
and cross-correlation constraints. These codewords are sparse, meaning that the code weight is very low. The code weight refers to the total number of ones in the codeword, also known as Hamming weight. Over the years, there have been developments on different types of OOCs with OCDMA networks such as multi-length OOC (ML-OOC), variable-weight OOC (VW-OOC), and multi-length variable-weight OOC (MLVW- OOC), which also have their own auto-correlation and cross-correlation constraints that must be met.
ML-OOCs allow the use of codewords of different codelengths but still have the same codeweight. The advangate with ML-OOCs is that you can assign different data rates to different nodes within the network. For instance you can assign short codewords to enterprise clients that require higher data rates than residental clients. VW-OOC are used within a network where the codelength is kept the same while the codeweight may differ. Generally, the higher the codeweight, the lower the bit error rate during the signal recovery stage. MLVW-OOC combines both ML-OOC and VW-OOC, which is the most recent development.
This thesis focuses on OOCs where all the codewords assigned in the network have the same codelength and Hamming weight. The properties are stated below [19]:
1) Each sequence can be easily distingushied from a shifted version of itself. 2) Each sequence can be easliy distinguished from (a possibly shifted version
of) every other sequence.
An OOC is denoted by a quadruple where is the sequence length, is the Hamming weight, is the upperbound auto-correlation, and is the upperbound cross-corelation.
The Auto Correlation Property is defined:
The Cross-Correlation Property is defined: ∑
The operator is employed to denote modulo - addition.
OOC is characterized to have good auto and cross correlation values.
Figure 2.6 shows the auto correlation of a codeword OOC1 of a set where binary 1 occurs at locations 0,1,7 of the codeword and hence the terminology OOC1=(0,1,7) is used (11000000100000000000000000000000). When the auto- correalation is performed by the reciever, a thumbstack shape with an amplitude of 3 occurs which provides the codeword for effective signal recovery, while the cross correlation property reduces the interference due to other users codewords and channel noise. In Figure 2.7, OOC1=(0,1,7) is cross-correlated with OOC2=(0,2,11) which is another codeword in the code set family .
A m pli tu d e A m pli tu d e Auto-Correlation of OOC1 7 n=31, w=3 OOC1=(0,1,7) 6 5 4 3 2 1 0 0 10 20 30 40 50 60 Time (chip)
Figure 2.6: Auto-Correlation of OOC1
Cross-Correlation of OCC1 and OCC2
7 n=31, w=3 6 OOC1=(0,1,7) OOC2=(0,2,11) 5 4 3 2 1 0 0 10 20 30 40 50 60 Time (chip)
The number of available codewords that can be supported within a network is very low in comparison to the codewords of the same length used in RF communications due to the OOC properties (2.1) and (2.2). To increase the codewords in a set, you need to increase the code length. This increases the duration of encoding a given source bit, thus, reducing the data rate. The number of codewords that are available in a particular
set is referred to as the cardinality and is defined by the Johnson Bound [17].
Where,
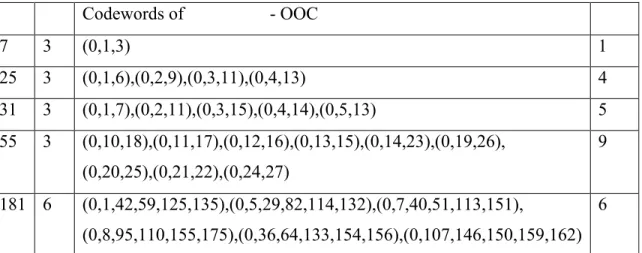
The Johnson Bound yields the theoretical maximum number of codewords that are available in a particular set. OOC can be constructed with a number of code construction algorithms which have the task of finding the codewords set by the Johnson Bound. The relationship between , and cardinality is shown in Table 2.2, with
Codewords of - OOC 7 3 (0,1,3) 1 25 3 (0,1,6),(0,2,9),(0,3,11),(0,4,13) 4 31 3 (0,1,7),(0,2,11),(0,3,15),(0,4,14),(0,5,13) 5 55 3 (0,10,18),(0,11,17),(0,12,16),(0,13,15),(0,14,23),(0,19,26), (0,20,25),(0,21,22),(0,24,27) 9 181 6 (0,1,42,59,125,135),(0,5,29,82,114,132),(0,7,40,51,113,151), (0,8,95,110,155,175),(0,36,64,133,154,156),(0,107,146,150,159,162) 6
Table 2.2: List of codewords for different values of code length (n) and code weight
(w), when auto-correlation (a) and cross-correlation (c) are set to 1. Table
courtesy of [7].
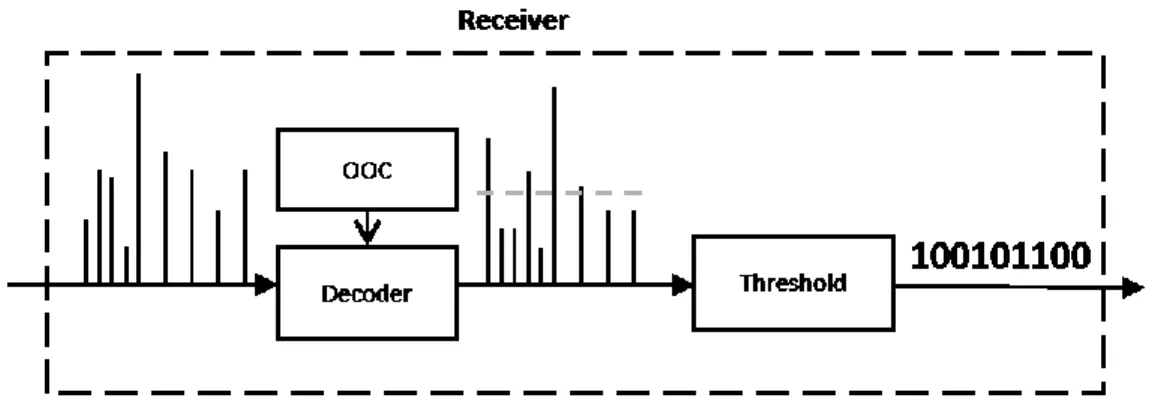
At the reciver shown in Figure 2.8, the incoming stream is correlated with the reciever’s OOC. The incoming stream seen at the decoder is the sum of optical signals of multiple nodes transimiting simulatenously which adds to the light intensity. In OCDMA systems, each bit ‘1’ from the source is encoded by the desired destination’s OOC. No light is transmitted when a bit ‘0’ is sent to the destination. When a decoder recieves a bit ‘1’, an autocorrelation is performed between the received signal and the receiver’s own OOC code. The result of autocorrelation (i.e. the auto-correlation amplitude) is then compared to a preset threshold value. If the autocorrelation amplitude is greater than the threshold, a bit ‘1’ is dectected otherwise it is considered a bit ‘0’. As an example in Figure 2.6, the thershold value would be set to 3. In this case, an amplitude greater than to 3 is interpertd as a bit ‘1’ of node information.
Figure 2.8: Incoming Data Stream at the Receiver
The Bit Error Rate (BER) performance of OCDMA degrades mainly due to Multiple Access Interference (MAI) from the other nodes. If MAI is strong enough it may cause a cross-correlation amplitude to become above the threshold value, which in turn causes a false detection of bit ‘0’ as bit ‘1’ (this is reffered to as a 0-error). But a false detection of bit ‘1’ to bit ‘0’ is not possible.When transmitting a bit ‘1’ in the presence of MAI, we will always recover it properly because the power intensity will be greater than the threshold value. The probability of bit error depends upon the threshold value, the correalation properties of the constructed code set, and the number of interfering signals. For OOC, the researchers have defined a probablity bit of error shown by the equation below [19]:
∑ ( ) ( ) ( ) : Number of users.
: Codeword length. : Hamming weight.
Threshold value.
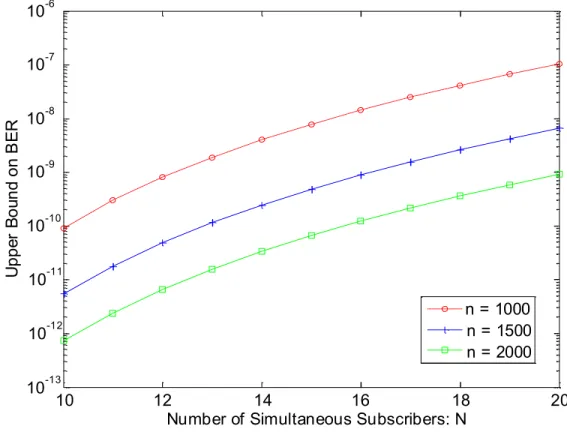
Equation (2.4) shows the effect of the codelength, hamming weight, and the threshold values on . Figure 2.9, shows that long codewords outperfom the short
U pp er B o un d o n B E R
codewords in terms of BER when the hamming weight is kept the same. The drawback of increasing the codeword is lower data rates since longer codewords require more processing time to recover the signal. When selecting an appropriate codelength, the network operator must try to balance the simultaneous transmission and desired data rates while not exceeding the BER.
-6 10 -7 10 -8 10 -9 10 -10 10 -11 10 -12 10 n = 1000 n = 1500 n = 2000 -13 10 10 12 14 16 18 20
Number of Simultaneous Subscribers: N
Figure 2.9: (BER) of various code lengths with a Hamming weight of 3.
When the codelength remains constant and the Hamming weight is increased, the BER is lower, as shown in Figure 2.10. The larger the Hamming weight the smaller the cardinality as dicdated by the Johnson bound equation (2.3). The main disadvantage of OOCs is there are a limited number of reasonable codelength and weight, therefore two dimensional OOC codes that use the wavelength and time dimensions have been proposed and their performance analysis and construction methods have been previousely investigated [24] [25] [26].
U p pe r B ou nd B E R 10 0 10 w = 3 w = 4 -2 w = 6 w = 8 -4 10 -6 10 -8 10 -10 10 -12 10 2 3 4 5 6 7 8 Threshold (Th)
Figure 2.10: (BER) of various Hamming weights with code lengths (n) of
1000.
In general, the BER of OCDMA systems are relatively high unless the network traffic load is kept to minimum and/or forward-error correction techniques used at the receiver. Therefore it is desirable in networks to only allow a portion of the many nodes at any given time to transmit. The performance of OOC-based CDMA has been theoratically studied and several experiments have demonstrated their feasibility [19]. Figure 2.11 shows an arbitrary codeword that illustrates the relationship between the codelength n, the chip time Tc, which is the time duration of a bit within a codeword, and the
codeword duration Tb. It has been estimated that with a codelength of and
with a = 600 pico-seconds ( ). The information rate of a source node is 1/ = 1.6 Gbps. Such a network would have a theortical capacity in excess of 100 gbps (100 nodes X 1.6 Gbps/node).
Where,
Figure 2.11: Codeword. Illustration courtesy of [7].
One of the major advantages to OCDMA in comparison to TDMA is that it does not require synchronization. When OCDMA is compared to WDMA, the need for wavelength-tunable transceivers or wavelength stabilization schemes are eliminated. In other words, all nodes are allowed to occupy the same wavelength. OCDMA can function to behave asynchronously, without a centralized controller, and does not suffer from packet collisions. Therefore a lower latency can be achieved. According to [7], the characteristics of OCDMA networks are:
- Subscribers may access the network at random times and it has what is referred to as a “soft capacity”.
- Can implement dynamic bandwidth allocation with different granularities. - Can support variable bit-rate traffic and bursty traffic and implement
- OCDMA networks are somewhat secure and cryptic for transmission of information.
- In comparison to WDM networks, its equipment is simple and the implementation cost is low.
- OCDMA can implement high-speed transmission, switching and add/drop of data by using all-optical processing and overcoming the effect of electronic bottleneck which exists in the electronic node in traditional networks.
For the aforementioned points highlighted, OCDMA can support multimedia including voice, data, video, IP traffic, video-on-demand, and streaming media. It overcomes the shortcomings of both TDMA and WDMA in access networks and is ideal to support FTTH for Point-to-Point communication.
2.8 Bandwidth Assignment Algorithms in PON
Downstream communication is relatively straightforward because data is broadcasted to all ONUs in PON. However in the upstream direction the problem with access control arises when multiple upstream transmitters must be arbitrated to avoid data collisions. In TDMA-based PON, this problem is resolved by issuing grants from the head-end controller to each ONU. With grants, timing information is sent in the downstream messages to all ONUs, which inform the ONUs of their transmission timeslots.
Generally, bandwidth allocation is classified under two categories: static or dynamic. A static bandwidth allocation for EPON was introduced in [27], where each ONU was assigned a fixed timeslot. This approach emphasized on giving equal access to each ONU to transmit, regardless of instantaneous bandwidth demands. This methodology provides a simple and cost-effective solution in regards to fairness, where the total ONUs may transmit within a transmission cycle. However it neglects the bursty nature of network traffic and cannot adapt to ONU demands. This results in packets being delayed for several timeslots in periods of high burstiness even in the presence of under- loaded ONUs. With Dynamic Bandwidth Allocation (DBA), a variable size timeslot is allocated dynamically to each ONU making them responsive to instantaneous
bandwidth demands. Therefore, DBA algorithms can adapt to the bursty nature of network traffic and achieve high bandwidth utilization in comparison to static algorithms.
DBA algorithms are classified according to the scheduling approach: centralized or disturbed. The centralized approach is where the processing of the algorithm takes place at the OLT. The distributed approach involves participation of both the OLT and ONUs. The major advancement in algorithms has been the development of centralized algorithms based on surveys [28] [29].
When it comes to algorithm processing, there are two modes: offline and online. The offline mode corresponds to the centralized algorithms because the OLT performs the computation immediately after having received the bandwidth request (report) messages from all the active ONUs in the network. Therefore there is a slight delay before issuing the grants. The online mode is an on-the-fly method that processes the report the moment it is received at the OLT. Online algorithms are better suited for distributed scheduling because each ONU makes scheduling decisions independently after having received the network status from the OLT. In many instances, the online distributed DBA performed better than offline scheduling, but with less control of the channel [30]. In [29], Interleaved Polling with Adaptive Cycle Time (IPACT) is introduced which utilizes a polling mechanism that polls all the ONUs in a round-robin fashion collecting bandwidth requests (a.k.a queue reports) and later issuing grants. The granted timeslot is bounded and varies depending on the ONU’s buffer occupancy status and the available bandwidth. IPACT uses an interleaved polling scheme where the next ONU in the circulation is polled before the transmission from the previous one has arrived. In doing so, it helps minimize upstream under-utilization by eliminating idle times from receiving queue reports. Another major benefit is that IPACT does not need to synchronize the ONUs to a common reference clock as is required by traditional TDMA schemes.
To support differentiated services, the authors of IPACT added strict priority queuing where each ONU maintains a separate queue for each QoS that was supported. After all
queue reports are received, the OLT issues colorless grants to ONUs. A colorless grant only specifies the quantity of bytes that an ONU is awarded but does not specify how many bytes from each queue should be transmitted. The ONU uses a strict priority to determine the order in which the queues are processed, where the queue with the highest priority is allowed to transmit over lower priority queues. This method fails to distribute upstream bandwidth fairly among all users. In particular, if two identical ONUs within a network make identical requests, these ONUs can receive very different qualities of services when one ONU is lightly loaded and the other ONU is fully loaded. This scheme also leads to a light-load penalty, where the queuing delay for some traffic classes increases when the network load decreases which specific to strict-priority is queuing. In order to solve the light- load penalty phenomenon, a rate-based optimization scheme has been proposed. However this scheme has only been able to eliminate the penalty for the second priority queue, not for the other subsequent queues [31].
In [32], the authors proposed a light-load penalty-free scheme with non-strict priority queuing where only the packets reported by the ONU are given priority for transmission. They also presented a new algorithm to re-distribute unused bandwidth from lightly-loaded ONUs to heavy-loaded ONUs, which achieves higher link utilization. The unused bandwidth is then re-issued to other ONUs proportionally. However, [33] highlights that the new algorithm does not resolve the QoS unfairness seen when identical traffic streams are sent to ONUs where some are highly-loaded and the others are lightly-loaded.
Another DBA was proposed in [34], called Class-of-Service Oriented Packet Scheduling (COPS), which makes use of a credit-pooling technique combined with a weighted- share policy to manage upstream bandwidth. The COPS algorithm separates packets into different classes of service and prevents users from monopolizing the bandwidth. COPS resolves the unfairness issues presented in IPACT and has made subsequent improvements in the techniques of its predecessors. The bandwidth allocation scheme allows for effective global optimization of network resources. The OLT executes the COPS algorithm during every transmission cycle in order to generate grants within a specific Class of Service (CoS) for each ONU. The basic idea is to maintain two groups
of leaky bucket credit pools on the OLT side as shown in Figure 2.12. One group consists of credit pools, corresponding to CoSs supported in the network. Each credit pool is used to enforce a long time average rate of certain CoS traffic transmitted from all ONUs to the OLT. The second group is composed of credit pools, corresponding to ONUs in the network. This pool is used to control the use of the upstream channel by an ONU. When processing bandwidth requests, the OLT begins with the highest priority CoS of all ONUs to the lowest priority CoS, based on a priority index. As long as the OLT issues any grant, the granted bytes are subtracted from the corresponding credit pools. The COPS algorithm has been deemed to be superior in terms of network utilization and maximum packet delay to IPACT, as well as in the derivative improvements of IPACT algorithm.
Figure 2.12: COPS dynamic bandwidth allocation system. Illustration courtesy of [34].
In, [35], the researchers propose an algorithm that guarantees QoS by separating services into voice, video and data and placing them into their respective queues. Several buffers in an ONU are reserved to avoid lightly load penalties. The algorithm
selects an appropriate scheduling scheme that is depended on whether the ONUs are lightly loaded or heavily loaded. It also adaptively adjusts the order of ONUs queues to minimize delay. In doing so, it is able to guarantee QoS for higher-priority services sensitive to delay. The burstiness of traffic creates situations where some ONUs are under-loaded while other ONUs are over-loaded. The overloaded ONUs require additional bandwidth whereas under loaded have unused bandwidth. However, it is a prediction based algorithm and it is not always possible to make an accurate prediction. The unused bandwidth cannot be fully utilized by using prediction based algorithms. In order to reduce delay, enhance fairness and increase utilization, a centralized scheduling scheme is proposed in [36] called Universal DBA (UDBA). Each ONU is equipped with three separate queues, each queue serving a particular Differentiated Services (DiffServ). The highest priority queue is mapped to Expiated Forwarding (EF), medium priority is Assured Forwarding (AF) and low priority is Best Effort (BE). The maximum transfer size for each queue is assigned. The queues are then divided into under loaded queues and overloaded queues by the OLT. Requests that are greater than the maximum transfer size are considered overload while requests that are less than are considered under loaded. The excess bandwidth is then collected from under loaded queues and the assigned to the over loaded queues based on serving the highest priority first. The UDBA resulted in an overall improvement in EF, AF, BE average delays.
Chapter 3
System Model
3.1 Multi-Class Credit-Based Packet Scheduler System Model
The concept of Token Bank Fair Queuing (TBFQ) was originally deployed in wireless environments where the users are mobile and are subject to change [37] [38]. The TBFQ structure integrates the use of Leaky Bucket (LB) with priority handling to provide quality of service (QoS) to next generation packet-switched wireless networks. Our proposed dynamic bandwidth allocation system called: Multi-Class Credit-Based Packet Scheduler system incorporates certain components of TBFQ and tailors it to our access network.
The LB mechanism essentially polices the flow of network traffic to conform to a particular traffic profile. There are many variants of the LB scheme [23-25] but fundamentally all of them share the idea of regulating the rate and the information flow into the network. A Leaky Bucket has a controller, a buffer, and a token bucket (also called credit pool) as shown in Figure 3.1.
When packets arrive they are placed into the buffer. For packets to leave the buffer and be admitted into the network there must be a corresponding number of credits (in bytes) available in the credit pool. The controller ensures that only the allotted packets are allowed to flow into the network. If a packet arrives and the credit pool does not have enough credits, the packet is non-conforming and must wait in the buffer queue (or be discarded if the buffer is full or not available). Credits are generated periodically with a specified rate (in bytes/s). The credit pool depth is typically fixed in size. The credit rate and the credit pool depth are the two parameters that determine the admission rate into the network.
In the proposed dynamic bandwidth allocation system, each optical network unit (ONU) is assigned with a leaky bucket system characterized by the following parameters: , , , and , where is the credit regeneration rate (in bytes/s), is the credit pool (in bytes), is a counter (in bytes), the data buffer size (in bytes),
is the total number of ONUs in the network. In the uplink direction, credit regeneration rates, counters, credit pools and the credit bank are managed at the optical line terminal (OLT) while the data buffer, , is located at the ONU m as shown in Figure 3.2. The credit bank (CB) collects all the unused bandwidth in bytes from ONU credit pools, if any, and redistributes them to the other ONUs that may require additional bandwidth.
Figure 3.2: The Leaky Bucket structure for uplink traffic.
Each ONU m is assigned with a counter, , that keeps track of the credits borrowed from or given to the credit bank. During periods when the ONU’s incoming data rate is less than the credit regeneration rate , the credit pool, , will have enough credits to service the ONU’s incoming traffic and the surplus of credits will be placed into the credit bank, and is increased by the surplus amount.
During periods when the ONU’s incoming traffic exceeds the regeneration rate , the credit pool, , will be emptied faster and will request additional credits. If the ONU receives additional credits from the credit bank, is decreased by the awarded amount.
The priority index determines which ONU is to borrow from the credit bank at any given time. This index is computed as the ratio of the counter and the regeneration rate , ( ). The algorithm selects the ONU that has contributed the most credit to the bank (compared to other ONUs) while it also takes into account the regeneration rate ( ). By dividing the counter by the regeneration rate , we allow ONUs with differing regeneration rates to compete for additional bandwidth in proportion to the time required.
A heuristic dynamic bandwidth allocation algorithm called Multi-Class Credit-Based Packet Scheduler (MCBPS) that is capable of supporting differentiated services was developed. In this thesis, each ONU will be able to support various classes of service (CoS) ranging from voice, video streaming, and data traffic. These differing traffic types can be mapped to standard classes defined in Differentiated Services IP (Internet Protocol) [31]. These standard classes are: Expedited Forwarding for CoS1 which is appropriate for services that are delay-sensitive real-time traffic such as voice. Assured Forwarding for CoS2 will be reserved for services which are not as delay-sensitive, but require bandwidth guarantees such as video streaming. Finally, Best Effort for CoS3 does not require any commitments from the network and no strong requirements regarding QoS such data transfers.
The ONU will receive the arriving packets from the electronic devices in the household or building, and place them into their respective queues based on the CoS that is required. The packets will be placed into the queue using the First-in-First-Out (FIFO) mechanism. In FIFO, packets are placed into the queue in the order that they arrive, and they are processed in the same order that they were queued. If the queue is full, the arriving packets will be dropped.
The main components of the MCBPS system implemented at the OLT are shown in Figure 3.3. In addition to credit pool componenets (Rm, Pm, Em) for each ONU m, the
supported in the network. Each CoS credit pool is used to establish a long-term average rate while also allowing for short-term traffic bursts that are above the allocated bandwidth. Each CoS k credit pool has two parameters: the credit pool (bytes) and the generation rate (bytes/s) as shown in Figure 3.3.
Figure 3.3: Multi-Class Credit-Based Packet Scheduling (MCBPS) System in the OLT
3.2 Transmission Cycle
Each ONU listens for its timeslot assignment in the downlink in order to access the appropriate uplink time slots to transmit to the OLT. If more time slots are required due to traffic bursts, the ONU conveys the request. The OLT then determines whether to grant more timeslots based on available bandwidth and the priority index. Similarly, when reserved data slots are no longer needed, the information is also conveyed to the OLT.
In order to determine how much bandwidth can be allocated, we first focus on a typical transmission cycle shown in Figure 3.4. Essentially in every transmission cycle, the OLT assigns a specific timeslot (transmission window) to each ONU so that the ONU can transmit its data uplink. The OLT conveys to the ONU precisely how many bytes of
data and when the ONU must start its transmission by sending a Grant message to the ONU. In response, the ONU transmits packets stored in its buffer during its allotted timeslot. The ONU must also send a request message, , to the OLT during its transmission slot which conveys the ONU’s bandwidth request for the upcoming transmission cycle.
The transmission cycle can be of variable length but bound to an upper limit, denoted by . is the time required to process the scheduling algorithm which executes at the beginning of every transmission cycle. After the scheduling algorithm completes, the OLT sends a Grant message to each ONU in a sequence as shown in Figure 3.4. A guard time ( ) is placed between the transmission times of two consecutive ONUs to avoid optical related processing issues [14].
Figure 3.4: Illustrative Example of a Transmission Cycle [34]
The interleaved polling scheme from the IPACT algorithm is used to space out the grant messages in the MCBPS algorithm [29]. The Interleaved Polling scheme allows the OLT to send a Grant message to the next ONU before the transmission from the previous ONU has completed, as shown in Figure 3.4.
{
where is the time when the Grant of ONU is transmitted; is the round-trip time to ONU ; is the capacity of the transmission link (bytes/s); is the request message size in bytes; is the length of the grant message in bytes and
is the transmission (data portion) for ONU and is the guard time. The grant message to ONU is transmitted at such a point in time that the first bit from that ONU will arrive at the OLT with the guard time after the last bit from ONU . The top line of (3.1) describes how the grant time is determined. While the bottom line expresses the situation where grant message to ONU cannot be transmitted.
The length of transmission cycle , shown in equation (3.2), can be derived from Figure 17.
∑ ⌊ ⌋ [ ]
The first two terms in the right side of (3.2) are the scheduling time and round trip time to the first ONU, which both are the overheads associated with the current algorithm. We can state the maximum number of data bytes that can be transmitted to OLT during every transmission cycle in equation (3.3)
[ ] (3.3)
where ∑ is the total number of requested bytes in a given cycle.
The function of the proposed MCBPS algorithm implemented at the OLT is to distribute bytes among the ONUs in every transmission cycle.
3.3 The Credit Bank Structure
The credit bank collects all the unused bandwidth in bytes from ONUs, if any, and redistributes them to the other ONUs that may require additional bandwidth. At the beginning of every cycle, the credit bank is reset to zero. is the sum of the bytes from the queues within ONU that needs to transmit to the OLT. The OLT scans through all the request messages to identify lightly-loaded ONUs (i.e. the ONUs with ). A lightly-loaded ONU does not require any additional bandwidth, so its unused bandwidth is given to the credit bank ( ) and then the ONU’s counter, , is increased by its contribution and its credit pool is adjusted as shown in equations (3.4), (3.5) and (3.6)
If all ONUs are heavily-loaded (i.e. the ONUs with ), the credit bank will not receive any contributions. Therefore, the credit bank can only redistribute bandwidth to ONUs when there is a combination of lightly-loaded ONUs making deposits and heavily-loaded ONUs requesting additional credits.
The priority for borrowing from the credit bank when bandwidth is available is based on the priority index ( ). The heavily-loaded ONU with the highest priority index will be serviced first and assigned bandwidth based on the relationship shown below.
{ (3.7)
(3.9) (3.10)
Where is the additional bytes awarded to ONU by the credit bank; the sum of the bytes from the queues within the ONU m; is the size of the credit pool in bytes. The top line of (3.7) allows the selected ONU m to temporarily use extra bandwidth if available, while the bottom line assigns the extra bytes to the ONU. Equations (3.8), (3.9) and (3.10) update the counter , the credit bank and the credit pool . Subsequently, the next ONU with the highest priority index is selected and serviced in the same manner. This process continues until all heavily-load ONUs have been serviced or the credit bank has no more credits.
3.4 Simultaneous ONU Transmissions
The main challenge of earlier dynamic bandwidth allocation algorithms was with providing differentiated services while avoiding packet collisions. Packet collisions occur when more than one ONU occupies the transmission medium simultaneously which results in the corruption of data during the overlap period. With OCDMA, this limitation is overcome and quality of service is provided while allowing simultaneous channel access by a number of ONUs. The access network under study supports a population of M ONUs connected to one OLT, but at most ONUs can simultaneously transmit ( ). The parameter denotes the limit of allowable simultaneous transmissions imposed by equation (2.4). Essentially the population of ONUs will be divided into sets of ONUs, each set is denoted by in this thesis, where n = 1, 2, …, N. A set is associated with two parameters: the sum of demands ( ) from ONUs in that set and the total number of ONUs in that set.
At the beginning of the transmission cycle, is initialized to zero before any ONU has been assigned to the set. The ONU with the largest demand ( ) is selected and assigned to a set with the least value of . After ONU has been assigned to a set , is incremented by . The next ONU with the largest is then selected and processed in the same manner until all the ONUs are assigned to a set as illustrated in the following example.
Consider an access network where and with the following ONUs demands:
, , ,
, .
The method applied is described as follows. 1. Initialize
2. Select ONU with the largest demand and place into the set with the least set demand (in case the total demands of the sets are equal, place the ONU in any set).
3. Select ONU with the largest demand among the remaining ONUs and place it into the set with the least set demand.
4. Repeat step 3 for the remaining unassigned ONUs:
6. Repeat step 3 for the last unassigned ONU.
By selecting the ONU with the largest demand, we establish the sequence of ONU transmissions. The transmission cycle, , and the maximum number of data bytes that can be transmitted to the OLT, , will differ for each set . Equations (3.2) and (3.3) are updated to support simultaneous transmissions as shown in below.
∑ ⌊ ⌋ [ ]
[ ]
There will be multiple and values when . From the example, two and values would be computed. Both values would have the same start times but, typically, different durations due to the demands. Therefore, the largest value of is selected to ensure that the other simultaneous transmissions are not truncated. Each is bound to its set ( ) which states the maximum number of bytes that can be transmitted to the OLT during the transmission cycle among ONUs associated with the set.
3.5 Multi-Class Credit-Based Packet Scheduler (MCBPS)
The MCBPS is used to distribute bandwidth among all ONUs based on the mechanisms discussed so far. The scheduler specifies how many packets will be transmitted and from which CoS as described as follows:
Step 1:
Once the OLT receives the request messages from the ONUs, the ONUs are sub-divided into a total of sets based on simultaneous ONU transmissions discussed in section 3.4. The credit pools and are initialized with their pre-defined values. is adjusted based on the credit bank structure discussed in section 3.4. It specifies the maximum number of bytes an ONU may transmit per cycle.
Step 2:
The OLT always processes grants for CoS1 first. It takes the first Request message from the ONU with the largest and examines it. The OLT will grant the request for CoS if there are enough credits in both credit pools and . Whenever the OLT issues a grant it subtracts the granted bytes from both credit pools. When the credit pool becomes depleted no more bytes can be granted to that ONU. Consequently, if the CoS credit pool, , is depleted no more bytes from CoS can be assigned to ONUs. In the situation that all the grants for CoS have been assigned to ONUs and the credit pool has still unused credits, the remainder of is awarded to for redistribution. After all the grants for CoS1 are processed, the OLT moves to CoS2, and so on, until all the CoSs have been processed.
Chapter 4
Simulation
4.1 Simulation Model
Access networks should be able to support a multitude of services and in our simulation we support three primary types - voice, video and data traffic. These types are mapped to differentiated services with Expedited Forwarding (EF), Assured Forwarding (AF), and Best Effort (BE) services. Within each ONU, CoS1 is mapped to EF which is simulated as a constant stream of packets at the rate of Rcbr = 8000 packets/s with a
packet length of 70 bytes, therefore one packet is generated every 125 µs. These particular parameters have been used to emulate T1 connections in access networks [39]. Throughout the simulation, CoS1 is kept constant for the duration of the simulation. CoS2 is mapped to AF while CoS3 is mapped to BE.
CoS2 and CoS3 traffic streams are self-similar and are modeled using a Pareto distribution. Studies have shown that network traffic is self-similar and long range dependent. Therefore, bursty data streams that are multiplexed together tend to produce bursty aggregate streams. The Pareto distribution is the simplest heavy-tailed distribution with the probability density function
Where is a shape parameter and the location parameter. The Pareto distribution is characterized by having a finite mean and infinite variance when [40]. We apply the method described in [5], which simulates an ON/OFF traffic source with Pareto distributed ON/OFF periods. During the OFF period, no packets are generated
and the traffic source is said to be silent. During the ON period, packets are generated back-to-back. The length of these packets is determined using the tri-model length distribution given in [41], where the packet lengths in bytes are assumed to be random and drawn from the set {64, 594, and 1518} with a frequency of distribution of 62%, 10% and 28%, in that order respectively. The mean ON time is set to 50 ms and the mean OFF time is varied so that the desired offered load for the given traffic source is achieved. The offered load for a given traffic source is denoted by ,
[ ] [ ] [ ]
Where [ ] and [ ] are the mean ON time and mean OFF time respectively. In the simulation sixteen ONUs (M = 16) are supported with N, the number of simultaneous transmissions varying between 1 and 4.The ONUs are placed randomly at distances between 0.5 km and 20 km away from the OLT. The transmission link capacity, , the guard time g = 5 us, the maximum length of transmission cycle and the time required to process the algorithm . The aforementioned simulation parameters have been deemed reasonable for access networks and have been used by other researchers [5] [40] [42].
CoS1 has the highest priority and so it is guaranteed a portion of bandwidth for credit pool that is defined as:
⌈ ⌉ ( )
Where ⌈ ⌉ is the number of CoS1 packets generated by an ONU during a transmission cycle, is the length in bytes of constant bit rate packet which set to 70 bytes, is the inter-frame gap (IFG) used to introduce processing delays between two adjacent frames which is set to at least 12 bytes, is the preamble, the necessary header information for processing an Ethernet frame, which is set to 8 bytes.
![Figure 2.2: Downlink Direction of PON. Illustration courtesy of [11].](https://thumb-us.123doks.com/thumbv2/123dok_us/9717943.2853395/23.918.176.769.109.532/figure-downlink-direction-pon-illustration-courtesy.webp)
![Figure 2.3: Uplink Direction of PON. Illustration courtesy of [11].](https://thumb-us.123doks.com/thumbv2/123dok_us/9717943.2853395/24.918.175.774.110.466/figure-uplink-direction-pon-illustration-courtesy.webp)