Italian external and multicentric validation of the MD
Anderson Cancer Center nomogram and prognostic index for
chronic lymphocytic leukaemia patients: analysis of 1502 cases
Massimo Gentile,1Francesca R. Mauro,2 Davide Rossi,3Iolanda Vincelli,4 Giovanni Tripepi,5Anna G. Recchia,6 Laura De Stefano,6Melissa Campanelli,2 Diana Giannarelli,7Sabrina Bossio,6 Lucio Morabito,8Ernesto Vigna,1 Gianluca Gaidano,3Robin Foa2and Fortunato Morabito1,6
1UOC Ematologia di Cosenza, Cosenza, 2Haematology, Department of Cellular
Biotechnologies and Haematology, Sapienza Uni-versity, Rome,3Division of Haematology, Department of Translational Medicine, Amedeo Avogadro University of Eastern Piedmont, Nov-ara,4UOC di Ematologia di Reggio Calabria, Calabria,5Scientific Direction, Biostatistical Unit, Regina Elena Cancer Institute, Rome, 6Biotecnology Research Unit di Aprigliano, Azienda Ospedaliera Provinciale di Cosenza, Cosenza,7Consiglio Nazionale delle Ricerche, Istituto di Biomedicina ed Immunologia Moleco-lare, Reggio Calabria, and8Humanitas Cancer Centre, Bone Marrow Transplantation Unit, Istituto Clinico Humanitas, Rozzano, Italy Received 6 May 2014; accepted for publication 10 June 2014
Correspondence: Massimo Gentile and Fortunato Morabito, UOC Ematologia, Azienda Ospedaliera di Cosenza, viale della Repubblica snc, 87100 Cosenza, Italy. E-mail: [email protected]; [email protected]
Summary
We performed an external and multicentric validation of the nomogram and prognostic index (PI) proposed by the MD Anderson Cancer Center to prognostically stratify chronic lymphocytic leukaemia (CLL) patients in 1502 CLL cases. All six parameters involved in the nomogram and PI (age, sex, absolute lymphocyte count, number of lymph node groups, Rai stage
and b2-microglobulin) were independently associated with survival. The
nomogram was accurate in predicting survival (c-index = 082). According
to the PI, 387% of patients were at low-risk, 583% at intermediate-risk
and 3% at high-risk. The estimated median survival times were: not
reached for low-risk, 134 years for intermediate-risk and 34 years for
high-risk. The estimated median and 5-year survival by PI were similar to those originally reported. The PI remained a predictor of survival when
analysis was limited to 847 Rai stage 0 (P< 00001) and 151 clinical
mono-clonal B-cell lymphocytosis (cMBL) cases (P =0033). Finally, the PI
allowed prediction of time to therapy in all patients (P < 00001), in Rai 0
(P< 00001) and in cMBL cases (P = 0044). Our results confirm the
abil-ity of the PI to predict prognosis, even in early stage disease cases. The study also extended the utility of the PI to cMBL cases.
Keywords: chronic lymphocytic leukaemia, prognosis, nomogram, prognos-tic index.
Chronic lymphocytic leukaemia (CLL) is a disease character-ized by a variable course; some patients live for decades without ever requiring treatment and die for unrelated causes, while others require immediate therapy and die within 1–2 years of diagnosis (Rozman & Montserrat, 1995). The clinical staging systems proposed by Rai and Binet, which consider the extent of lymphadenopathy, organomeg-aly and cytopenias, are useful for assessing prognosis (Rai
et al, 1975; Binetet al, 1981). However, these staging systems
have some limitations. In fact, for each stage there is still heterogeneity, limiting usefulness in predicting survival. This inability of staging systems has led to substantial efforts to identify new prognostic tools. Several prognostic markers based on genetic (fluorescent in situ hybridization, FISH) (Dohner et al, 2000), phenotypic (CD38, ZAP70 and CD49d) (Damle et al, 1999; Crespo et al, 2003; Rassenti
et al, 2004; Gentile et al, 2005; Morabito et al, 2009; Bulian
et al, 2014) and molecular characteristics (IGHV mutation
First published online 11 July 2014 doi: 10.1111/bjh.13032
ª2014 John Wiley & Sons Ltd British Journal of Haematology, 2014,167,224–232
status) of neoplastic B cells have emerged over the past dec-ade (Damleet al, 1999; Hamblinet al, 1999). Although these prognostic factors have allowed to the better stratification of CLL patients and have increased our understanding of dis-ease biology, they are not widely available to many patients because they are technically complex and costly to perform. Thus, there remains a need for developing a simple prognos-tic stratification method widely available to CLL patients. To address this question, the MD Anderson Cancer Center (MDACC) CLL group analysed the clinical outcomes of 1674 previously untreated CLL patients, who presented for evalua-tion from 1981 to 2004 at their centre, to determine whether routinely available clinical and laboratory features could improve the ability of clinical staging systems in predicting prognosis (Wierda et al, 2007). Through this analysis they identified six factors [age, absolute lymphocyte count (ALC), sex, b2-microglobulin (b2-M), Rai stage, and number of lymph node regions] that were independently associated with overall survival (OS). Based on these six factors, they devel-oped a prognostic index to predict OS more accurately than the clinical staging system. However, this study had some limitations. First of all, it was a single centre study. Second, the population used to develop the index comprised patients presenting at an academic referral centre. In fact, the patients included in the study reported by Wierda et al (2007) were younger (median age, 58 years) than patients who typically present to community practice (median age, older than 65 years), and often had advanced stage disease (only 28% were in the Rai 0 stage). Finally, OS was measured from the time of presentation to a referral centre rather than at diagno-sis, introducing the possibility of bias (Wierda et al, 2007). Shanafeltet al(2009) performed an external validation of this prognostic index using the Mayo Clinic CLL database, which confirmed its ability to predict survival. Nevertheless, the analysis by Shanafelt et al (2009) also showed some limita-tions: (i) like the MDACC study above, this study was also monocentric, (ii) only four out of six parameters used for the prognostic index were independently associated with OS in this series, (iii) the median follow-up was relatively short for CLL patients (34 years), and (iv) only 151 out of 440 cases (343%) were local/unreferred patients, although the referral practice did not seem to significantly impact on OS in this study (Shanafelt et al, 2009). For widespread application this prognostic index requires external validation in an indepen-dent series of newly diagnosed CLL patients evaluated and monitored at multiple institutions from the time of diagnosis. With this aim, Bulianet al (2011) performed a multicentric validation of both nomogram and prognostic index. Neverthe-less, this analysis also showed some disagreements with the MDACC study (Wierdaet al, 2007): (i) ALC and Rai stage did not show any independent association with OS, and (ii) the nomogram did not seem to be accurate in predicting progno-sis, as shown in MDACC series (Bulianet al, 2011).
In our analysis, we used the CLL databases of four Italian centres to evaluate the validity and reproducibility of the
nomogram and the prognostic index proposed by the MDACC group in an independent cohort of newly diagnosed and un-referred CLL patients. Sub-analyses were also per-formed in the setting of Rai low-risk and clinical monoclonal B-cell lymphocytosis (cMBL) cases, included in this cohort. Finally, we also evaluated the ability of this prognostic index to predict treatment-free survival (TFS).
Materials and methods Patients
The CLL databases of four Italian centres (Haematology Unit of Cosenza; Haematology Unit, La Sapienza University, Rome; Division of Haematology, Amedeo Avogadro University of Eastern Piedmont, Novara; Haematology Unit of Reggio Cala-bria), which included all patients diagnosed with CLL since 1983, were utilized for research purposes. The databases con-tained clinical information of patients such as age, sex, date of diagnosis, Rai and Binet stage, laboratory parameters, treat-ment history, date of last follow-up or death, which have been selected from clinical records at the time of inclusion and maintained on an ongoing basis. The four databases identified 2991 new cases of CLL diagnosed between 1983 and 2013. All 2991 patients had information regarding age, sex, ALC at baseline, Rai stage and number of lymph node sites involved, but only 1502 had an evaluation ofb2-M (normal range, 06– 20 mg/l) performed at diagnosis. Given that there was a simi-lar distribution of the remaining five parameters (age, sex, ALC at baseline, Rai stage and number of lymph node sites involved) between cases with or withoutb2-M evaluation, the data of these 1502 patients were representative of all 2991 cases and were utilized for this analysis. One hundred and fifty-one of the 1502 cases satisfied the criteria established in 2008 by the National Cancer Institute-Working Group guidelines (Hallek et al, 2008) for the definition of cMBL (<50 9109B lymphocytes/l in the peripheral blood and no apparent lymph node, spleen or liver enlargement).
Nomogram and prognostic index scores
Taking into account all six parameters (age, sex, ALC at base-line, Rai stage, number of lymph node sites involved andb2-M at baseline), we have calculated both nomogram and prognos-tic index scores using the methods proposed by Wierdaet al
(2007). The nomogram score was calculated using the formula: 125+[1259age]+[4329b-2M]+[8629(ALC, 9 109/l/100)] +[7349I(sex=male)]+[11009I(Rai =III
or IV)]+[10849I(nodes =3)] where I() is the indicator function, equal to one if the condition in the parenthesis is met and zero if not (Wierdaet al, 2007). The prognostic index score was calculated giving points to age (one point<50 years, two points 50–65 years, three points >65 years), b2-M (one point for 1–2 9upper limit of normal [ULN], two points
>509109/l), one point each for male sex, Rai stage III or IV, nodes=3. Patients were grouped in low risk (score 0–3), intermediate risk (score 4–7) and high risk (score≥8) (Wierda
et al, 2007).
Statistical analysis
SPSS for Windows, version 13.0, 2004 software (SPSS, New
York, NY, USA) andSTATA, version 9 (STATA, College Station,
TX, USA), were used for all analyses. For categorical variables, statistical comparisons were performed using two-way tables for the Fisher’s exact test and multi-way tables for the Pear-son’s Chi-square test. OS and TFS analyses were performed using the Kaplan-Meier method. For OS, the time interval was measured from the day of CLL diagnosis until death from all causes or last follow-up and, for TFS, it was from the day of CLL diagnosis until therapy start or last follow-up. Statistical
significance of associations between individual variables and survival was calculated using the log-rank test. Prognostic impact for the outcome variable was investigated by univariate and multiple Cox regression analysis. Data are expressed as hazard ratio (HR) and 95% confidence interval (CI). A value ofP<005 was considered significant. The predictive accuracy of prognostic models was quantified by calculating the concor-dance index (the Harrell C-statistic), which is a probability of concordance between predicted and observed survival. A c-index of 05 indicates that outcomes are completely random, whereas a c-index of one indicates that the model is a perfect
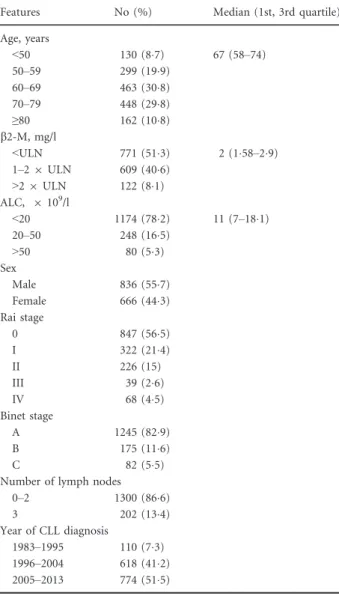
Table I. Clinical features of the patients (N=1502).
Features No (%) Median (1st, 3rd quartile)
Age, years <50 130 (87) 67 (58–74) 50–59 299 (199) 60–69 463 (308) 70–79 448 (298) ≥80 162 (108) b2-M, mg/l <ULN 771 (513) 2 (158–29) 1–29ULN 609 (406) >29ULN 122 (81) ALC, 9109/l <20 1174 (782) 11 (7–181) 20–50 248 (165) >50 80 (53) Sex Male 836 (557) Female 666 (443) Rai stage 0 847 (565) I 322 (214) II 226 (15) III 39 (26) IV 68 (45) Binet stage A 1245 (829) B 175 (116) C 82 (55)
Number of lymph nodes
0–2 1300 (866) 3 202 (134) Year of CLL diagnosis 1983–1995 110 (73) 1996–2004 618 (412) 2005–2013 774 (515)
b2-M,b2-microglobulin; ULN, upper limit of normal; ALC, absolute lymphocyte count; CLL, chronic lymphocytic leukaemia.
Proportion surviving Proportion surviving Years Years (A) (B)
Fig 1. Overall survival according to Binet stage (A) and to modified Rai stage (B) in the entire population of 1502 chronic lymphocytic leukaemia patients. OS, overall survival; HR, Hazard ratio; 95% CI, 95% confidence interval.
predictor (Harrell et al, 1996). We used the area under the receiver operating characteristic (ROC) curve (AUC) to mea-sure model discrimination. The AUC can range from 05 (which indicates a test with no information) to 10 (which indicates a perfect test).
Results
Patient characteristics
A total of 1502 newly diagnosed and previously untreated CLL patients were included in this analysis. The majority of patients had Binet stage A (829%), 847 cases had Rai stage 0 and 151 cases met the diagnostic criteria of cMBL (Hallek
et al, 2008). The median age was 67 years, with 406% of cases aged >70 years. Baseline patient features are listed in
Table I. After a median follow-up of 57 years (range, 3 months to 301 years), 277 patients had died and 479 had been treated: 337 (704%) received chemotherapy and 142 (296%) underwent chemo-immunotherapy. The Kap-lan-Meier estimate OS according to Binet and Rai stage is shown in Fig 1A, B.
Univariate and multivariate analyses
We evaluated the relationship between the six parameters of the prognostic index (age, sex, ALC at baseline, Rai stage, number of lymph node sites involved andb2-M at baseline) and OS. All were associated with OS at univariate analysis (Table II). Cox multivariate analysis again showed that all six parameters had an independent prognostic impact on OS (Table II). Among these, the number of lymph node groups involved conferred the greatest amount of risk in the multi-factor model (HR=218).
Validation of nomogram score
The median nomogram score, calculated according to the Wierda formula (Wierda et al, 2007), was 87 (range 274– 1818). This value was similar to that reported by Bulian
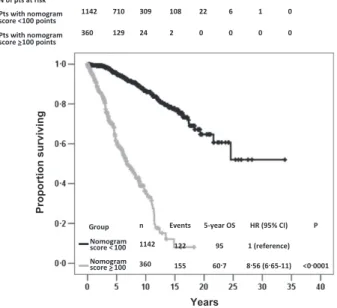
et al (2011), although it was slightly higher than those reported by Wierda et al (2007) and Shanafelt et al (2009). The total point score, as a continuous variable, (i.e., measur-ing the risk of each point score increase), was associated with OS (HR, 106; 95% CI: 105–106; P<00001). The Harrell C statistic was calculated to evaluate the discriminatory capacity of the nomogram in terms of OS. The c-index was 082 (P<001). We then investigated a cut-off value that best differentiated patients with a better or worse prognosis in terms of OS. ROC analysis was performed and a threshold of 100 was identified; this value roughly corresponds to the 75th percentile, patients with values below 100 have not yet reached median OS and 15-year OS is 77%, while patients with a value more than 100 showed a median OS of 67 years and a 15-years OS of 8%; this difference was
Table II. Univariate and multivariate analysis.
Features
Univariate analysis Multivariate analysis
HR (95% CI) P HR (95% CI) P
Age, years* 1094 (108–1109) <00001 1085 (1071–11) <00001
b2-M, mg/l† 1371 (1321–1422) <00001 1217 (1161–1275) <00001
ALC,9109/l‡ 1011 (1009–1014) <00001 1006 (1003–101) <00001
Sex: male vs. female 1439 (1128–1835) 0003 155 (1205–1992) 0001
Rai stage: III–IV vs. 0–II 469 (3447–638) <00001 1789 (125–2561) 0001
Number of lymph nodes: 3 vs.<3 3609 (2762–4715) <00001 218 (1636–2903) <00001 HR, hazard ratio; 95% CI, 95% confidence interval; ALC, absolute lymphocyte count;b2M,b2-microglobulin.
*Continuous variable; HR indicates the risk of each 1-year increase in age.
†Continuous variable; HR indicates the risk of each 1-mg/l increase inb2-M.
‡Continuous variable; HR indicates the risk of each 19109/l increase in the ALC.
Proportion surviving
Years
Fig 2. Overall survival according to the threshold of 100 points for the nomogram score in the entire population of 1502 chronic lym-phocytic leukaemia patients. OS, overall survival; HR, Hazard ratio; 95% CI, 95% confidence interval.
obviously highly significant (P <00001). The risk of death for patients with a score≥100 with respect to patients with a score<100 was statistically higher (HR, 856; 95% CI: 665– 11;P<00001) (Fig 2).
Validation of prognostic index score
According to the prognostic index score, 582 patients (388%) were classified as low-risk (score of 0–3), 875 (582%) as intermediate-risk (score of 4–7) and 45 (3%) as high-risk (score of≥8). Stratification of patients according to the prognostic risk score showed significant differences in terms of OS of the low- and intermediate-risk cases on one side, and high-risk patients on the other. Thus, low-risk patients had a 5-year OS probability of 98% (HR=1), inter-mediate-risk of 82% (HR=92, 95% CI 59–143,
P<00001) and high-risk of 42% (HR=413, 95% CI 238– 716,P <00001) (Fig 3A). The 5-year OSs observed in the current series were very similar to those previously reported by other groups (Wierda et al, 2007; Shanafelt et al, 2009; Bulian et al, 2011) (Table III). Moreover, also in the sub-groups of patients devised according to the period of CLL diagnosis (first group, patients diagnosed between 1983 and 1995; second group, between 1996 and 2004; third group, between 2005 and 2013) the prognostic index score allowed us to stratify cases in terms of OS. In the subgroup of cases diagnosed between 1983 and 1995, low-risk patients had a 5-year OS probability of 100% (HR=1), intermediate-risk of 797% (HR =66, 95% CI 23–189, P <00001) and high-risk of 40% (HR=209, 95% CI 51–852,P <00001) (Figure S1A). The subgroup of cases diagnosed between 1996 and 2004, low-risk patients had a 5-year OS probability of 983% (HR=1), intermediate-risk of 869% (HR=93, 95% CI 52–166,P<00001) and high-risk of 533% (HR=579, 95% CI 267–1258,P<00001) (Figure S1B). Finally, in the subgroup of cases diagnosed between 1996 and 2013, low-risk patients had a 5-year OS probability of 979% (HR=1), intermediate-risk of 762% (HR=115, 95% CI 47–285,
P<00001) and high-risk of 384% (HR=505, 95% CI 18– 142, P<00001) (Figure S1C). The same held true for the subgroups of patients devised for the type of therapy received (chemotherapy and chemo-immunotherapy) (data not shown). When the modified Rai (1987) and Binet stage was tested in a Cox multivariate model together with prognostic index score, only prognostic index score (HR=49, 95% CI 37–65, P <00001) maintained an independent prognostic impact on OS, while the two staging systems did not (modi-fied Rai stage: HR=11, 95% CI 09–15, P =04; Binet stage: HR=12, 95% CI 09–16, P =02). Furthermore, prognostic index score allowed prediction of TFS. The 5-year TFS probability according to the prognostic risk group was 892% (HR=1) for low-risk, 639% (HR=3; 95% CI 24– 37, P<00001) for intermediate-risk and 10% (HR =255, 95% CI 176–37,P <00001) for high-risk (Fig 3B). To fur-ther evaluate the discriminatory value of the index in terms
of OS and TFS, we calculated the Harrell C statistic. The C-statistic was 071 (P <001) for predicting survival, and was 070 (P<001) for predicting TFS.
Rai 0 and cMBL cases. Given that the challenge of clinical practice pertains primarily to early stage patients and as 565% of cases (847 patients) in our study were at Rai 0 stage, we evaluated the prognostic power of the index score in this subgroup in terms of both OS and PFS. Four hundred and thirteen cases (487%) were at low-risk, 434 (513%) at intermediate-risk and there were no high-risk patients. After a median follow-up of 62 years (range, 3 months– 275 years), 128 cases (151%) had died and 158 (186%)
Proportion surviving
Years
Proportion not treated
Years (A)
(B)
Fig 3. Overall survival according to prognostic index score (A) in the entire population of 1502 chronic lymphocytic leukaemia patients. Treatment-free survival according to the prognostic index score in the entire population of 1502 CLL patients (B).
had been treated. Low-risk (5-year OS probability 98%, HR=1) showed a significantly longer OS than intermediate-risk patients (5-year OS probability 85%, HR=89, 95% CI 51–156, P<00001) (Fig 4A). The 5-year OSs observed in our series were similar to those previously reported by the Mayo Clinic group (Shanafelt et al, 2009) (Table IV). More-over, intermediate-risk patients showed a significantly shorter TFS (5-year TFS probability 90%, HR=1) than those with low-risk (5-year TFS probability 79%, HR=275, 95% CI 17–33, P<00001) (Fig 4B). In the subset of Rai 0 cases, the c-statistic for the prognostic index score was 071 (P <001) for predicting survival and 071 (P <001) for predicting TFS. Moreover, also in the subgroups of Rai 0 cases sub-divided according to the period of CLL diagnosis (first group, Rai 0 cases diagnosed between 1983 and 1995; second group, between 1996 and 2004; third group, between 2005 and 2013), the prognostic index score allowed the strat-ification of cases in terms of OS. In the subgroup of cases diagnosed between 1983 and 1995, low-risk patients had a 5-year OS probability of 100% (HR=1) and intermediate-risk of 88% (HR=67, 95% CI 15–301,P <0014); in the subgroup of cases diagnosed between 1996 and 2004, low-risk patients had a 5-year OS probability of 988% (HR=1) and intermediate-risk of 896% (HR=104, 95% CI 47–23,
P <00001); finally, in the subgroup of cases diagnosed between 1996 and 2013, low-risk patients had a 5-year OS probability of 971% (HR=1) and intermediate-risk of 79% (HR=78, 95% CI 31–199,P<00001).
Thus, we evaluated the prognostic power of the index score in the subgroup of Rai intermediate- (Rai I–II) and Rai high-risk (Rai III–IV) cases. In these 655 cases, the index score allowed the stratification of cases with different OS: low-risk patients had a 5-year OS probability of 983% (HR=1), inter-mediate-risk of 785% (HR=82, 95% CI 4–169,P<00001)
and high-risk of 443% (HR=322, 95% CI 147–705,
P<00001). Moreover, also in the subgroups of Rai interme-diate-risk and Rai high-risk cases sub-divided according to the period of CLL diagnosis (first group, Rai intermediate- and Rai high-risk cases diagnosed between 1983 and 1995; second group, between 1996 and 2004; third group, between 2005 and 2013), the prognostic index score allowed the stratification of cases in terms of OS (data not shown).
One hundred and fifty-one patients fulfilled the diagnostic criteria for cMBL Hallek et al, 2008) and were classified according to the progression risk score; 84 cases (556%) were in the low-risk group, 67 (444%) were intermediate-risk and there were no patients in the high-intermediate-risk group. After a median follow-up of 59 years months (range, 3 months– 203 years), seven cases (46%) had died and 14 cases (93%) required therapy. Intermediate-risk cMBL patients showed both a significantly shorter OS (P<0033) and TFS (P<0044) than low-risk patients (Fig 4C, D, Table IV). In the cMBL subgroup, the c-statistic for the prognostic index score was 070 (P <001) for predicting survival and 070 (P<001) for predicting TFS.
Finally, the index score maintained its prognostic power when we evaluated the entire series of CLL cases, excluding the cMBL cases (i.e., only true CLL cases). In these 1351 cases, low-risk patients had a 5-year OS probability of 983% (HR=1), intermediate-risk of 81% (HR=87, 95% CI 56– 136, P<00001) and high-risk of 443% (HR=376, 95% CI 215–657,P<00001).
Discussion
This study aimed to evaluate the validity and reproducibility of the nomogram and prognostic index proposed by the MDACC CLL group (Wierdaet al, 2007) in an independent
Table III. Survival by prognostic index score for all patients.
Score N(%) Median TFS (years) Median OS (years) 5-year OS (SE) 10-year OS (SE) HR of death (95% CI)
Italian series (present study)
1–3 (low-risk) 582 (388) Not reached Not reached 098 (0006) 095 (0012) 1 (reference)
4–7 (intermediate-risk) 875 (582) 94 139 082 (0015) 065 (0023) 92 (59–143)
>8 (high-risk) 45 (3) 01 34 042 (008) 010 (0064) 413 (238–716)
MDACC series (Wierdaet al, 2007)
1–3 (low-risk) 194 (12) NR Not reached 097 (001) 08 (005) 1 (reference)
4–7 (intermediate-risk) 1236 (764) NR 103 08 (001) 052 (003) 389 (24–63)
>8 (high-risk) 187 (116) NR 54 055 (004) 026 (006) 1048 (63–175)
Mayo clinic series (Shanafeltet al, 2009)
1–3 (low-risk) 142 (323) Not reached Not reached 095 NR 1 (reference)
4–7 (intermediate-risk) 284 (645) 5 101 085 NR 486 (17–136)
>8 (high-risk) 14 (32) 07 72 061 NR 1112 (32–381)
Italian/Swiss-Italian Centres (Bulianet al, 2011)
1–3 (low-risk) 189 (18) 115 Not reached 097 NR 1 (reference)
4–7 (intermediate-risk) 788 (76) 58 Not reached 089 NR 41 (22–85)
>8 (high-risk) 60 (6) 01 66 053 NR 181 (82–401)
TFS, treatment-free survival; OS, overall survival; HR, hazards ratio; SE, standard error; 95% CI, 95% confidence interval; MDACC, MD Ander-son Cancer Center; NR, not reported.
cohort of newly diagnosed and non-referred CLL patients evaluated and monitored at multiple Italian institutions. Fur-thermore, we evaluated whether this prognostic index is also effective in predicting TFS. A similar evaluation was per-formed both in Rai stage 0 and cMBL patients.
Our results, obtained in an independent cohort of 1502 CLL patients, confirm the accuracy of the nomogram score in predicting the prognosis of CLL patients (concordance index 082). Moreover, we were able to individuate a thresh-old of 100 points for the nomogram score, which allows the segregation of patients with different clinical courses. Our study confirms the prognostic power of the prognostic index proposed by the MDACC CLL group (Wierda et al, 2007). The median and 5-year OS rates by prognostic index
category in our cohort are similar to those observed in the MDACC, Mayo clinic and Italian/Swiss-Italian cohorts (Wie-rdaet al, 2007; Shanafeltet al, 2009; Bulianet al, 2011), sug-gesting that the survival estimates provided by the index are reproducible. Moreover, a multivariate model, including the prognostic index together with modified Rai and Binet stage, shows that this new prognostic tool is a better predictor of survival than the historical clinical staging systems. Our analysis confirms the utility of the prognostic index in pre-dicting TFS, as previously shown by the Mayo clinic and Italian/Swiss Italian CLL groups (Shanafeltet al, 2009; Bulian
et al, 2011). Furthermore, our results show that this prognostic index also retains predictive power for both OS and TFS when applied exclusively to the 847 Rai stage 0
Proportion surviving
Years
Proportion not treated
Years N of pts at risk Low Intermediate N of pts at risk Low Intermediate risk 84 54 17 7 1 0 risk 67 29 6 2 0 0 risk 84 57 20 8 1 0 risk 67 33 8 2 0 0 (95% Low (reference) Int
Group n Events 5-year OS HR CI) P risk 84 1 98 1
risk 67 6 92 10 (1·2 High
83·5) 0·033 risk 0
Group n Events 5-year TFS (95%
Low HR CI) P (reference) Int risk 84 5 94 1 risk 67 9 87 3·1 (1·1 9·3) 0·044 High risk 0 Proportion surviving Years Years
Proportion not treated
(A) (C)
(D) (B)
Fig 4. Overall survival (A) and Treatment-free survival (B) according to the prognostic index score in the 847 Rai 0 stage patients. OS (C) and PFS (D) according to the prognostic index score in the 151 clinical monoclonal B-cell lymphocytosis patients.
patients. These data are also in line with those reported by Shanafeltet al(2009). Finally, we extended the usefulness of this prognostic index in the subgroups of cMBL cases (151 patients). In this category of patients the prognostic index allowed to predict both OS and TFS.
Although we confirm that the proposed prognostic score remains a significant tool for predicting clinical course in CLL patients, some issues must be considered. First of all, only half of the cases recorded in our databases were evaluable for this analysis, becauseb2-M level was not routinely determined at baseline in patients with CLL diagnosed between 1983 and 1995. However, the 1502 patients analysed in this study are representative of all 2992 cases, as they show a similar distri-bution of the other five parameters used for prognostic index evaluation. Second, the period of study spans 30 years, during which considerable advances in the CLL therapeutic approach have been made. Even so, we have shown that the prognostic index also maintained its predictive power regardless of the period in which CLL was first diagnosed. Moreover, the addi-tion of immunotherapy to convenaddi-tional chemotherapy did not seem to impact on the predictive power of the prognostic index. Third, the primary endpoint of our analysis was OS rather than CLL-related survival. In accordance with other CLL groups (Wierdaet al, 2007; Shanafeltet al, 2009; Bulian
et al, 2011) our analysis took OS into account as it represents a more clinically relevant and useful outcome. Similarly, prog-nostic indices have been developed in other haematological malignancies that take OS rather than disease-related survival into account [i.e., the follicular lymphoma international prog-nostic index (FLIPI) in follicular lymphoma and the Interna-tional Staging System (ISS) in multiple myeloma] (Solal-Celignyet al, 2004; Greippet al, 2005).
Despite the limiting factors indicated above, our study has several important strengths, such as the large sample size and the community-based setting, which support these results. A limit of our study may that the laboratory assays used to determine b-2M levels could differ across various laborato-ries. Moreover, in our analysis all six parameters of the prog-nostic index proposed by Wierdaet al(2007) were found to be independently associated with OS. We then extended the utility of this prognostic tool both in terms of OS and PFS to the subgroup of cMBL cases, for whom prognostic tools are most needed. Finally, given that Italian patients with absolute lymphocytosis are commonly referred to primary haematology centres and only newly diagnosed and untreated cases were used in this analysis, our study allowed a long-term and observational follow-up that is representative of the natural course of CLL. Nevertheless, in the era of new bio-logical prognostic markers, a prognostic index based only on basic clinical and laboratory parameters could be question-able. However, it must be taken into account that the deter-mination of many of these biological markers is costly, not widely available and, in some cases (e.g, ZAP70), difficult to standardize between laboratories (Chiorazzi, 2012). Thus, our external validation, despite differences in terms of patient
Table IV. Surviva l b y pro gnostic index score for Rai 0 and cMBL cases. Rai 0 cases cMBL cases Score No (%) Med ian TFS (years) 5-year OS (SE) HR of death (9 5% CI ) Score No (%) 5-ye ar TFS (S E) 5-year OS (SE) HR of death (95% CI) Italian series (present stud y) 1 – 3 (low-risk ) 413 (48 8) No t reached* 0 98 (0 008 ) 1 (reference) 1 – 3 (low-risk ) 8 4 (55 6) 0 94 (0 03) 0 98 (0 014) 1 (refe rence) 4 – 7 (int-risk) 434 (51 2) No t reached* 0 85 (0 02) 8 9( 5 1 – 15 6) 4 – 7 (int-risk) 6 7 (44 4) 0 87 (0 051 ) 0 92 (0 041) 10 (1 2 – 83 5) > 8 (high-risk) 0 –– – > 8 (high-risk) 0 –– – Mayo clinic serie s (S hanafelt et al , 200 9) 1 – 3 (low-risk ) 106 (40 3) No t reached 0 96 (0 9 – 1) 1 (reference) 1 – 3 (low-risk ) –– – – 4 – 7 (int-risk) 155 (58 9) 7 90 89 (0 83 – 0 96) 4 82 (1 11 – 20 97) 4 – 7 (int-risk) –– – – > 8 (high-risk) 2 (0 8) No t evalua ble Not evaluable Not ev aluable > 8 (high-risk) –– – – cMBL , clinical monoclonal B-cell lymph ocytosis; TFS , treatment -free sur vival; OS, overall sur vival; HR, hazar ds ratio; 95% CI , 95% confi dence int erval; MD ACC, MD Anderson Cancer Cente r; int , intermediate. *5-year TFS (SE): low-r isk versus int-ris k, 0 90 (0 017 ) vs 0 79 (0 023 ).
selection and characteristics, confirms that the prognostic index proposed by the MDACC CLL group (Wierda et al, 2007) represents a predictive tool that is easily applicable and allows prediction of the clinical course of all CLL patients. In the future, the integration of biological markers will further enhance the prognostic accuracy of this index.
Author contributions
MG, FRM, DR, IV, GG, RF and FM designed the study and wrote the paper; MG, FRM, DR, IV, DG, AGR, MC, SB, LDS, EV, LM, GT and FM collected and analysed the data; MG, DG, GT and FM performed statistical analysis.
Conflicts of interest
The authors indicated no potential conflicts of interest.
Supporting Information
Additional Supporting Information may be found in the online version of this article:
Fig S1.Overall survival according to the prognostic index in patients with chronic lymphocytic leukaemia diagnosed between 1983 and 1995 (A), in those diagnosed between 1996 and 2004 (B) and in those diagnosed between 2005 and 2013 (C).
References
Binet, J.L., Auquier, A., Dighiero, G., Chastang, C., Piguet, H., Goasguen, J., Vaugier, G., Potron, G., Colona, P., Oberling, F., Thomas, M., Tchernia, G., Jacquillat, C., Boivin, P., Lesty, C., Duault, M.T., Monconduit, M., Belabbes, S. & Gremy, F. (1981) A new prognostic classification of chronic lymphocytic leukemia derived from a multivari-ate survival analysis.Cancer,48, 198–206. Bulian, P., Tarnani, M., Rossi, D., Forconi, F., Del
Poeta, G., Bertoni, F., Zucca, E., Montillo, M., Pozzato, G., Deaglio, S., D’Arena, G., Efre-mov, D., Marasca, R., Lauria, F., Gattei, V., Gaidano, G. & Laurenti, L. (2011) Multicentre validation of a prognostic index for overall sur-vival in chronic lymphocytic leukaemia. Hema-tological Oncolology,29, 91–99.
Bulian, P., Shanafelt, T.D., Fegan, C., Zucchetto, A., Cro, L., N€uckel, H., Baldini, L., Kurtova, A.V., Ferrajoli, A., Burger, J.A., Gaidano, G., Del Poeta, G., Pepper, C., Rossi, D. & Gattei, V. (2014) CD49d is the strongest flow cytometry-based predictor of overall survival in chronic lymphocytic leukemia.Journal of Clinical Oncol-ogy,32, 897–904.
Chiorazzi, N. (2012) Implications of new prognos-tic markers in chronic lymphocyprognos-tic leukemia.
Hematology American Society of Hematology Edu-cation Program,2012, 76–87.
Crespo, M., Bosch, F., Villamor, N., Bellosillo, B., Colomer, D., Rozman, M., Marce, S., L opez-Guillermo, A., Campo, E. & Montserrat, E. (2003) ZAP-70 expression as a surrogate for immunoglobulin-variable-region mutations in chronic lymphocytic leukemia.The New England Journal of Medicine,348, 1764–1775.
Damle, R.N., Wasil, T., Fais, F., Ghiotto, F., Valet-to, A., Allen, S.L., Buchbinder, A., Budman, D., Dittmar, K., Kolitz, J., Lichtman, S.M., Schul-man, P., Vinciguerra, V.P., Rai, K.R., Ferrarini, M. & Chiorazzi, N. (1999) Ig V gene mutation status and CD38 expression as novel prognostic indicators in chronic lymphocytic leukemia.
Blood,94, 1840–1847.
Dohner, H., Stilgenbauer, S., Benner, A., Leupolt, E., Krober, A., Bullinger, L., Dohner, K., Bentz, M. & Lichter, P. (2000) Genomic aberrations and sur-vival in chronic lymphocytic leukemia.The New England Journal of Medicine,343, 1910–1916. Gentile, M., Mauro, F.R., Calabrese, E., De Propris,
M.S., Giammartini, E., Mancini, F., Milani, M.L., Guarini, A. & Foa, R. (2005) The prognostic value of CD38 expression in chronic lymphocytic leukaemia patients studied prospectively at diag-nosis: a single institute experience.British Journal of Haematology,130, 549–557.
Greipp, P.R., San Miguel, J., Durie, B.G., Crowley, J.J., Barlogie, B., Blade, J., Boccadoro, M., Child, J.A., Avet-Loiseau, H., Kyle, R.A., Lahuerta, J.J., Ludwig, H., Morgan, G., Powles, R., Shimizu, K., Shustik, C., Sonneveld, P., Tosi, P., Tures-son, I. & Westin, J. (2005) International staging system for multiple myeloma.Journal of Clinical Oncology,23, 3412–3420.
Hallek, M., Cheson, B.D., Catovsky, D., Caligaris-Cappio, F., Dighiero, G., D€ohner, H., Hillmen, P., Keating, M.J., Montserrat, E., Rai, K.R. & Kipps, T.J. (2008) Guidelines for the diagnosis and treatment of chronic lymphocytic leukemia: a report from the International Workshop on Chronic Lymphocytic Leukemia updating the National Cancer Institute-Working Group 1996 guidelines.Blood,111, 5446–5456.
Hamblin, T.J., Davis, Z., Gardiner, A., Oscier, D.G. & Stevenson, F.K. (1999) Unmutated Ig V (H) genes are associated with a more aggressive form of chronic lymphocytic leukemia. Blood, 94, 1848–1854.
Harrell, F.E. Jr, Lee, K.L. & Mark, D.B. (1996) Multivariable prognostic models: issues in devel-oping models, evaluating assumptions and ade-quacy, and measuring and reducing errors.
Statistics in Medicine,15, 361–387.
Morabito, F., Cutrona, G., Gentile, M., Matis, S., Todoerti, K., Colombo, M., Sonaglio, C., Fabris, S., Reverberi, D., Megna, M., Spriano, M., Lucia, E., Rossi, E., Callea, V., Mazzone, C., Festini, G., Zupo, S., Molica, S., Neri, A. & Ferrarini, M. (2009) Defi-nition of progression risk based on combinations
of cellular and molecular markers in patients with Binet stage A chronic lymphocytic leukaemia. Brit-ish Journal of Haematology,146, 44–53.
Rai, K. (1987) A Critical Analysis of Staging in CLL. Alan R. Liss, New York.
Rai, K.R., Sawitsky, A., Cronkite, E.P., Chanana, A.D., Levy, R.N. & Pasternack, B.S. (1975) Clin-ical staging of chronic lymphocytic leukemia.
Blood,46, 219–234.
Rassenti, L.Z., Huynh, L., Toy, T.L., Chen, L., Keat-ing, M.J., Gribben, J.G., Neuberg, D.S., Flinn, I.W., Rai, K.R., Byrd, J.C., Kay, N.E., Greaves, A., Weiss, A. & Kipps, T.J. (2004) ZAP-70 compared with immunoglobulin heavy-chain gene mutation status as a predictor of disease progression in chronic lymphocytic leukemia.The New England Journal of Medicine,351, 893–901.
Rozman, C. & Montserrat, E. (1995) Chronic lym-phocytic leukemia.The New England Journal of Medicine,333, 1052–1057.
Shanafelt, T.D., Jenkins, G., Call, T.G., Zent, C.S., Slager, S., Bowen, D.A., Schwager, S., Hanson, C.A., Jelinek, D.F. & Kay, N.E. (2009) Validation of a new prognostic index for patients with chronic lymphocytic leukemia.Cancer,115, 363–372. Solal-Celigny, P., Roy, P., Colombat, P., White, J.,
Armitage, J.O., Arranz-Saez, R., Au, W.Y., Bellei, M., Brice, P., Caballero, D., Coiffier, B., Conde-Garcia, E., Doyen, C., Federico, M., Fisher, R.I., Garcia-Conde, J.F., Guglielmi, C., Hagenbeek, A., Ha€ıoun, C., LeBlanc, M., Lister, A.T., Lopez-Guillermo, A., McLaughlin, P., Milpied, N., Morel, P., Mounier, N., Proctor, S.J., Rohatiner, A., Smith, P., Soubeyran, P., Tilly, H., Vitolo, U., Zinzani, P.L., Zucca, E. & Montserrat, E. (2004) Follicular lymphoma international prog-nostic index.Blood,104, 1258–1265.
Wierda, W.G., O’Brien, S., Wang, X., Faderl, S., Ferrajoli, A., Do, K.A., Cortes, J., Thomas, D., Garcia-Manero, G., Koller, C., Beran, M., Giles, F., Ravandi, F., Lerner, S., Kantarjian, H. & Keating, M. (2007) Prognostic nomogram and index for overall survival in previously untreated patients with chronic lymphocytic leukemia.