How Ownership Structure Affects Capital Structure and
Firm Performance? Recent Evidence from East Asia
Nigel Driffield, Aston Business School
Vidya Mahambare Cardiff Business School
Sarmistha Pal Brunel University
*07 September 2005
Abstract:
Despite the seminal work of Claessens et al. (2002), role of ownership structure on capital structure and firm performance in East Asian corporattions remains much unexplored. Within the framework of Bajaj et al. (1998), the present paper empirically examines the effects of a controlling manager and degree of monitoring (a measure of moral hazard) on capital structure and firm performance among a sample of Korean and Indonesian firms. In doing so, we not only allow for simultaneity between capital structure and firm performance (a la Berger and di Patti, 2003), but also the non-linearity in these relationships. Our empirical results in essence depend on whether a firm is run by a family and also whether there is a manager who is also a controlling owner. There is evidence that family ownership could mitigate the problem of moral hazard though it could exacerbate the problem of over-lending in our samples. Also the effects of ownership structure on firm performance cannot be delineated from its effects on leverage. As such, the results presented here confirm and extend the essential findings of Claessens et al. (2002) and Bajaj et al. (1998).JEL: G32, L25
Keywords: Asian Crisis, Corporate Governance, Capital structure, Firm performance, Expropriation of minority shareholders, 3SLS estimates, Simultaneity bias, Non-linearity.
*
Corresponding author: Department of Economics and Finance, Brunel University, Uxbridge UB8 3PH, UK. Tel. 01895 266645; Fax. 01895-269770. The research is funded by the ESRC grant number RES-000-22-0200. Sarmistha Pal is much grateful to Professor Stijn Claessens for providing the ownership data. We are solely responsible for any errors.
How Ownership Structure Affects Capital Structure and
Firm Performance? Recent evidence from East Asia
1. INTRODUCTION
The Asian Crisis of the late 1990s has highlighted the problems of corporate governance among South East Asian corporations. While recent literature confirms aspects of concentrated ownership, dominance of controlling shareholders, separation of voting and cash flow rights and limited protection of minority rights in many of these countries badly affected by the Crisis (Claessens et al., 2000; 2002), a clear understanding of the effects of ownership structure on capital structure and firm performance remains much unexplored. While Claessens et al. (2000) examine the pattern of ownership in seven East Asian countries, Claessens et al. (2002) investigate the effect of large shareholding on firm valuation. Lemmon and Lins (2003) further link ownership structure to stock returns in these countries. None of these recent studies however consider the effect of ownership structure on capital structure and firm performance and the possible interaction between capital structure and firm performance. As this paper will demonstrate, this is an important issue in the worst affected countries. In an attempt to fill in this gap of the literature, the paper examines how ownership structure may affect capital structure and performance of firms in South East Asian countries. In doing so, we not only allow for the possible non-linearity in these relationships, but also correct for the simultaneity bias, if any, between capital structure and firm performance, often ignored in the literature. Our results confirm and extend the essential findings of Claessens et al. (2002) as well as Bajaj et al. (1998), identifying different effects across different ownership structures, and highlighting the differences between Indonesia and Korea and thus make a case for studying these countries separately rather than attempting to impose uniformpooling them together.
Previous theoretical and applied literature has highlighted the complex nature of the relationships between ownership structure, capital structure and firm performance. Existing literature highlights the agency problems between managers
and shareholders. In an attempt to ensure the continued viability of the firm, the latter may result in a generally lower leverage ratio below the optimum level. Jensen and Meckling (1976) however argue that introduction of managerial share ownership may align the interests of managers and shareholders and thus reduce these agency problems..1 Extending this idea, Brailsford et al. (2002) suggest that the relationship between managerial share ownership and leverage may in fact be non-linear. Stulz (1988) formalised a concave relationship between managerial ownership and firm valuation too; with increase in managerial ownership and control, the negative effect on firm value associated with entrenchment (see discussion below) starts to exceed the incentive benefits of managerial ownership Empirically Shleifer and Vishny, (1986) suggest that concentration of ownership may improve firm performance while Morck et al., (1988) argue that it may even deteriorate firm performance.
Much of the existing literature is however based on the functioning of the US firms that traditionally tend to assume a wide dispersion in ownership structure than one finds in SE Asian countries.2 A series of recent studies by Claessens et al. (2000, 2002) however highlight the distinctive pattern of ownership structure in East Asia. East Asian corporations are often dominated by large family owners and are often characterised by concentration of ownership as well as the presence of a CEO, Board Chairman or Vice Chairman who is also a controlling shareholder of the company (labelled as Cronyman hereafter). Ownership is also characterised by the separation of voting rights from cash flow rights where control rights (or voting rights) of the largest owners were often generally greater than the corresponding cash flow rights prior to the crisis. It is clear that higher voting rights may give rise to serious agency problems, and are often associated with pyramid ownership structures, and crossholding. Such situations are associated with an over-reliance on debt, due to large shareholders being unwilling to dilute their ownership. This scenario is refereed to as non-dilution of entrenchment by Claessens et al. (2002). Further, the separation of voting rights from cash flow rights increases the likelihood of misallocation of resources, which in turn is likely to adversely affect the performance of the firm, and in turn its value.
1
Demsetz (1983), Demsetz and Lehn (1985) went further to claim that the level of optimal managerial ownership is firm-specific and endogenous to expected performance.
2
Recent evidence however tends to highlight a substantial degree of ownership concentration including family ownership in large firms around the world (e.g., see, Morck (2005); Burkart et al. (2003). Such arguments are supported by large scale studies such as La Porta et al. (1999) as well.
The distinction between owners and managers may however be blurred in the case of family firms, as it is common for family members to be employed as managers. In such cases, standard analysis of the conflict of interests between owners and managers in the presence of dispersed ownership may not apply, though dominance of family members may still give rise to conflict of interests with minority shareholders. In addition, family ownership may give rise to greater leverage than in the case of disperse ownership, because raising debt does not dilute the position of the controlling shareholder (non-dilution of entrenchment effects). Anderson et al. (JFE, 2003) further argue that family ownership reduces the cost of debt financing. The divergence of interests between family shareholders (owner) and debt holders (banks) is potentially less severe than between diversified shareholders and debt holders. This is because families represent a special class of large shareholders that potentially have unique incentive structures and motives to manage a firm. Families are different from other shareholders in at least two respects including family's interest in the long-term survival and also its concern for the firm reputation. In addition, banks often develop personal and well-informed relationships with family executives, suggesting that the family's presence allows these relationships to build over a number of years.
Family ownership is however found to be closely associated with presence of Cronyman, higher control than cash flow rights and also concentrated ownership. It is the possible to envisage how the dominance of certain individuals, or families will lead to the problems of excessive borrowing and over-investment that typically characterised the Asian crisis of the late 1990s. However, the precise link between the prevalent ownership structure and over borrowing/firm performance remains unexplored in the existing literature. In this paper, we attempt to unravel the complex interactions between ownership structure, capital structure and firm performance in two of the worst affected countries, namely, Indonesia and Korea.
This paper is then distinctive in a number of ways. The theoretical basis of the link between ownership structure, capital structure and firm performance is primarily derived from Bajaj, Chan and Dasgupta, (1998), that allows for both moral hazard and adverse selection problems in firm financing. This framework hypothesizes that
ownership and the degree of monitoring3, both determined exogenously, will impact on capital structure and firm performance. In the light of our specific sample characteristics, we however empirically extend Bajaj et al. (1998) in a number of ways. Firstly, we highlight the case of family firms where often the controlling manager is the member of the same family. We argue that this kind of ownership structure would mitigate the moral hazard problem4, at least to some extent, because the family members would gain from better firm performance (though it may exacerbate the problem of over lending). Secondly, we allow for the simultaneity between capital structure and firm performance, often ignored in the literature, but recently highlighted by Berger and di Patti (2003). Ignoring this important simultaneity could however bias the effects of ownership on capital structure and firm performance (see section 5). Indeed there is evidence that effects of ownership cannot be separated from its effect on leverage. Finally, as Stulz (1988) and Brailsford et al. (2002) suggest that there could be important non-linearities in the effects of ownership on capital structure and firm performance, which is not accounted for by Bajaj et al. (1998). In view of initial non-parametric analyses of our samples, we however allow for nonlinearities in the relationships between ownership concentration, capital structure and firm performance. This is a crucial aspect of our analysis, especially when one considers the potential importance of majority shareholdings, and the potential threshold effects of different levels of concentration (51% for example) on capital structure and firm performance. The importance of these issues is demonstrated in terms of both parametric and non-parametric analyses.
The analysis here is based on two of the countries most deeply affected by the crisis, Indonesia and Korea. These countries provide an interesting contrast, given their distinctive corporate histories and different levels of capital market development (for further discussion on this see Chelley-Steeley, 2004). These differences suggest potentially differing impacts of different ownership and governance structures on capital structure and firm performance.
The paper is developed as follows. Section 2 presents the data and its characteristic features, highlighting the nonparametric relationships between
3
While ownership concentration is of course important, and directly available, we also consider more subtle indicators of ownership structure, including family ownership and separation of voting rights from cash flow rights. This is discussed in more detail in sections 2 and 3.
4
Our analysis explicitly controls for one possible source of moral hazard as proxied by whether voting rights exceed cash flow rights.
ownership structure, capital structure and firm performance in our samples. Section 3 builds up the analytical framework while section 4 translates the analytics into empirics. Section 5 presents and analyses the results and the final section concludes.
2. DATA AND PRELIMINARY OBSERVATIONS
We examine the effect of ownership structure on capital structure and corporate leverage among listed non-financial companies in Indonesia and Korea. Data used for this analysis come from two sources. Firm-level accounting data extracted from Worldscope 2002 is matched with 1996 ownership data for these firms described in Claessens et al. (2002). La Porta et al (1999) demonstrate that ownership structures in these firms are very stable over time5; thus without much loss of generality we assume that ownership pattern remained more or less stable among sample firms over the period 1994-1998.
2.1. Ownership Structure
The differences in ownership structures among firms in these countries are illustrated in Table 1A and Table 1B.
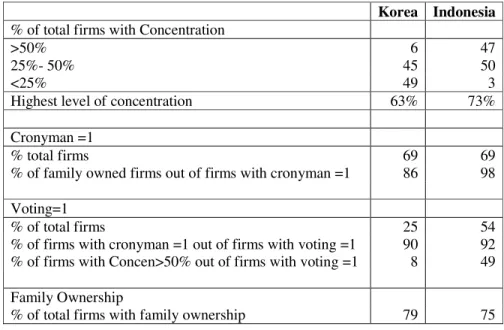
As is well-documented, family ownership is the predominant form of ownership in both sample countries. 75% of Indonesian firms, and 79% of Korean firms in our samples are family owned, with the remainder being state owned, (Indonesia: 8%; Korea: 5%) or more dispersed patterns of ownership.
Secondly, management is rarely separated from ownership control. In nearly 70% of firms in both countries the Chief Executive Officer (CEO), Board Chairman or Vice-chairman was also a controlling owner. This is labelled as Cronyman in our analysis. Perhaps not surprisingly, both countries exhibit a close association between family ownership and presence of a Cronyman. 90% of family owned firms in
5
Indonesia are characterised by the presence of such an individual, while the corresponding proportion for Korea is about 77%. In contrast, presence of Cronyman is rather low among the non-family owned firms in both countries, particularly so in Indonesia.
The separation of voting rights from cash flow rights is another important feature of East Asian corporations. In particular, voting rights are higher in more than half of the Indonesian firms (the corresponding proportion is about 25% among Korean firms). More interestingly, there is a close association between presence of Cronyman and higher voting rights in both countries: more than 90% of Cronyman firms in both countries exhibit voting rights in excess of cash flow rights.
The distribution of concentration of ownership among top five shareholders clearly varies in the two countries. The average level of concentration is higher in Indonesia, with the top five shareholders holding more than 50% of shares in 47% of Indonesian firms but only 6% of Korean firms. Equally, in just under half the Korean firms, the top five shareholders account for less than 25% of holdings, while in only 3% of Indonesian firms do the top five shareholders account for less than 25% of the equity. There is however no significant difference in the level of concentration among family firms and widely-held firms in our samples though the average is again significantly lower in Korea (27% as against 47% in Indonesia).
This initial analysis clearly reveals the complex nature of the ownership structure in the selected countries, especially in view of the observed close association between family ownership, presence of Cronyman, concentration, and also higher voting than cash flow rights. The question that is commonly ignored in this literature, is therefore how the observed ownership structure affects capital structure and firm performance, after allowing for the simultaneity. This is discussed in more detail in sections 3 and 4.
2.2. Capital Structure
The key indicator of capital structure in our analysis is leverage, or debt-equity ratio, defined as total debt divided by book value of common equity. It is possible in this context for debt-equity ratios to be negative, as in some cases firms exhibit negative values of equity. In order to avoid this we employ the absolute value of the
debt-equity ratio in our analysis.
In order to illustrate the changes in leverage through the period of the crisis, Table 2A shows the share of low debt-equity firms (firms relying more on equity financing) in Korea and Indonesia, for the period in the run up to the crisis (1994-1996) and the crisis period (1997-98). We also include a “base” year (1993), for comparison. For comparison, we also consider the corresponding proportion of low leverage firms in Singapore, a country that remained least affected by the crisis. In comparison to 22% Korean and 59% Indonesian firms, as high as 84% of firms in Singapore relied more on equity financing during 1994-96 (Table 2).6 Demirguc-kunt and Maksimovic (1995) suggest that the over-reliance on debt in the worst affected countries, especially Korea, can be partially explained by the relatively low levels of stock market development in the country.
2.3. Ownership and capital structure
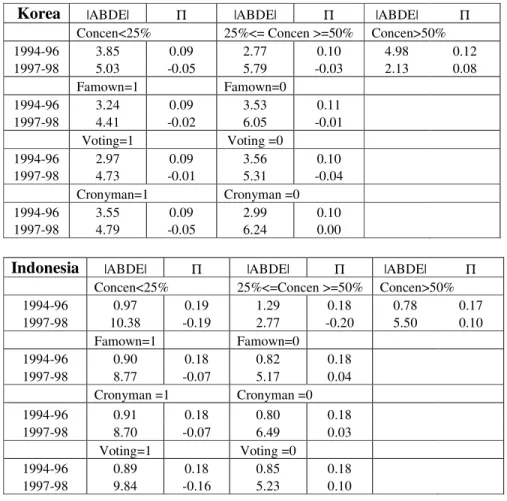
Table 3 summarises the average leverage values for different types of ownership structure in the two countries. Leverage rates in Indonesia were lower than Korea at the start of the period, across all categories. However, the data also show clearly that increases in leverage through the crisis were far more marked for Indonesia, with Korean firms increasing leverage rates but at a less dramatic rate. The highest level of ownership concentration (>50%) in Korea exhibited the highest levels of leverage in the pre-crisis period, but in Indonesia this was in the firms in the medium range of concentration. The presence of a Cronyman is also associated with higher levels of leverage in both countries while higher voting rights seem to give rise to higher leverage in Indonesia, but not for Korea.
In order to examine this further, we present some nonparametric Kernel scatter plots (see Figures 1, 2) to illustrate the non-linearity in the relationship between levels of ownership concentration and capital structure in both countries. The non-linearity appears particularly significant for Indonesian firms. This nonparametric analysis is indicative of a u-shaped relationship between concentration and leverage for Indonesian firms, for both sub-periods 94-96 and 97-98. In other words, lower levels
6
These figures contrast with Singapore, one of the least affected countries, which relies far more heavily on equity finance.
of concentration are associated with lower levels of leverage as existing shareholders are less concerned about the dilution of their dominance. At a higher level of concentration, leverage increases (the trend is more obvious if we exclude the outlier firm with concentration level of 73%) because of the fear of dilution of dominance of large controlling shareholders. The u-shaped relationship is however not so pronounced for Korea. However, firms with ownership concentration in excess of 45%, exhibit higher levels of leverage, though in general non-linearity is much less obvious during the crisis period where firms with high concentration exhibit a marginal fall in leverage.
2.3. Ownership and firm performance
Our indicator of performance is the pre-tax profit margin. Table 3 shows the average levels of profit margin associated with different types of ownership structure for the pre-crisis (1994-96) and the crisis (1997-98) periods. The data show a general deterioration of firm performance over the period. There is a weak positive relation between average profit margins and concentration for Korea in the pre-crisis period, though the reverse is apparent for Indonesia. These non-parametric analyses suggest only a weak relationship between profit margins and the other indicators of ownership structure for Indonesian firms, and a marginally stronger one for Korea.
Again the nonparametric kernel scatter plots are informative (see the middle panels in Figures 1, 2). While there is no obvious non-linearity in this respect for Indonesia (more or less uniform performance with higher levels of concentration), one can observe some degree of non-linearity in the relationship for Korean firms, particularly for the crisis period. More specifically, firm performance is lower among firms with concentration levels between 30% and 50% though higher beyond these points and the trend is rather similar across the two time periods.
3. ANALYTICAL ARGUMENTS
This section outlines the analytical framework used to rationalise the possible effects of ownership structure on capital structure and firm performance in a world
characterised both by adverse selection and moral hazard problems of firm financing. An understanding of the conflict of interests between managers and owners, i.e., agency problems, remains central to the analysis of the relationship between ownership structure, capital structure and firm performance. This analysis dates back to the classic work of Jensen and Meckling, (1976) and Leland and Pyle (1977). More recently, Bajaj, Chan and Dasgupta (1998) extend Leland and Pyle (1977) and develop a signalling model to show how both adverse selection and moral hazard may interact to determine firms’ financing decisions and performance measures in terms of ownership structure. This theoretical work is particularly relevant for our empirical analysis as it allows us to derive both capital structure and firm performance in terms of ownership structure (assumed to be exogenous). Ownership structure is captured in terms of managerial share ownership that addresses the traditional agency conflict between manager and the shareholder (a la Jensen and Meckling, 1976). Thus without any loss of generality, we proceed to make use of Bajaj et al. (1998).
3.1. Modelling Framework
Bajaj et al. (1998) consider the investment and financing behaviour of an entrepreneur/manager who owns the rights to a production technology, but needs to raise investment capital by selling some combination of equity and debt. Financial returns to the manger are fully captured by the share ownership of the firm (his/her initial wealth is assumed to be zero). The technology is characterised by the production function f(k)(µ+ε) where k denotes investment and ε is a random variable with a mean of zero and a known distribution. The parameter µ is a measure of the productivity (or profitability) of the firm’s technology, which is only known to the manager (who is risk-averse); the market (assumed to be risk-neutral) cannot however directly observe this.
The analysis covers a single period from point 0 (when production and financing decisions are made) to the point 1 (when output is realised). At point 0, the manager announces a public offering for (1-α) fraction of equity claims. Upon learning α the market values the equity of the firm as S(α) = S(µ’(α)), using an inference schedule µ’(α). Eventually the firm obtains (1-α) S(α) for the equity. Thus the financing constraint is given by: k= (1-α) S(α) + D. After paying the debt-holders,
managers are left with some residual cash flow given by RCF = f(k)(µ+ε)– F, where F is the risk-free face value of debt given by (1+r) D.
It is assumed that manager’s compensation is determined not only by the fraction of the equity they retain, but also by their ability to divert cash flows for perquisite consumption; the latter captures how moral hazard too can affect the relationships of our interest. In particular, in the absence of a perfect monitoring technology, the manager diverts a fraction γ of the residual cash flow for perquisite consumption; thus a higher value of γ could reflect a lower value of monitoring.
The simple cross-sectional implications of the model are pertinent for our analysis. Denoting indices of capital structure and firm performance by Y1 and Y2
respectively, one can write the following:
) , ( ) , ( 2 1 i i i i i i g f
Y
Y
γ α γ α = = (1)Thus each endogenous variable Yki , k = 1,2, for the i-th firm, i = 1,…,nj in the j-th
country depends on indices of ownership (αi) as well as degree of outside monitoring
(γi).
3.2. Central Hypotheses
It follows that ownership7 is positively correlated with (a) various measures of the debt-equity ratio and (b) also with indices of firm performance.8 With the degree of moral hazard (γ) unchanged, various measures of debt-equity ratios increases with managerial ownership. This is because as the firm sells less equity (higher α being retained by the manager), it relies more on debt financing (via the financing constraint
7
Here ownership is defined as managerial shareholding. 8
Zhang (1998) too argues that a controlling large shareholder is more averse to risky projects (due to under-diversification, which is also the opportunity cost of concentrated ownership) than shareholders whose portfolios are fully diversified. The latter may result in under-investment by rejecting projects preferred by the minority shareholders. This under-investment problem can however be mitigated by issuing debt since the ‘risk-shifting’ effect of debt offsets the investment incentive of the under-diversified owner. Thus a firm’s leverage increases with concentrated ownership, and this relation becomes stronger the more risk-averse the controlling shareholder is.
equation). Because in the signalling equilibrium managers of higher productivity firms retain more shares, they have to use higher leverage, especially if these firms invest more relative to the lower productivity firms.
For a given value of γ, higher managerial ownership (α) is associated with higher net present value as well as higher firm valuation. This operates through a trade-off between the risk-aversion effect and productivity effect. The risk-aversion effect refers to the incentive of a risk averse manager to reduce his / her holding as the financial risk of the firm increases, The productivity effect however suggests that as the productivity of the firm increases, so does the incentive to concentrated ownership. It has been argued that for all types of firms (low and high productivity firms taken together), higher managerial ownership is associated with higher net present value of investment because of higher productivity effect. In other words, higher investment leads to higher market value net of perquisite consumption when managerial ownership increases in this model.
The monitoring parameter γ is also important here. This will impact on leverage and firm valuation differently. With profitability µ unchanged, leverage is an increasing function of the degree of moral hazard γ (in both absolute and relative terms). An increase in γ lowers the value of equity because it is associated with a larger diversion of RCF. Also an increase in γ lowers the scale of investment, though the reduction in investment is lower than the reduction in equity valuation. Thus debt has to increase in both absolute and relative terms to balance the budget (no pre-commitment though).9 If however outside monitoring is less effective, managers have an incentive to under-lever the firm to avoid bankruptcy risk (e.g., see Mehran, 1992). Thus, the value of the firm will be a decreasing function of the degree of moral hazard. This is because investment level moves away from the optimal level and as managers collect more perquisites (higher γ), which are not valued by the market, firm valuation falls.
9
This result is also consistent with the agency view of Jensen (1986) that in the presence of free cash flow, pre-commitment to higher debt is value increasing.
4. From Analytics to Empirics
In view of the distinctive characteristics of our samples, we shall in this section attempt to translate the analytical arguments into an empirical exercise.
Our discussion in sections 1 and 2 summarises the significant characteristics of the ownership structure in East Asia. Firstly, while there are variations in ownership structures across firms, following La Porta et al. (1999) and Bajaj et al. (1998), we consider these to be stable over time. We however need to allow for the fact that we have a sample of panel nature where we observe firms over a period of five years 1994-98. This in turn means that our ownership variables do not vary over time (as is indicated by Bajaj et al., 1998), though most other firm-level variables tend to vary over time and across firms. Secondly, we do not directly observe the managerial shareholding in our data, but reckon that the binary information on the presence of a Cronyman is the closest proxy for the presence of a controlling manager in our data. We also note that presence of a Cronyman is predominant in family owned firms. Thus our analysis focuses on the family firms with Cronyman and compares the behaviour of these firms with others. Thirdly, it is difficult to find an appropriate measure of the degree of monitoring. Various proxies have been used in the existing literature, e.g., percentage of outside directors (Mehran, 1992), shareholder voting rights (Lippert and Moore) or control potential (e.g., measured by institutional ownership, as in Mehran, 1995). Given the limited ownership information at our disposal, we could possibly use two indices to instrument the degree of monitoring in our model; first, if control rights are greater than the cash flow rights and also if the largest share holder is a family (family ownership). When a large shareholder keeps significant control rights with relatively small cash flow rights, s/he has little stake in firm value and can get away despite taking reckless policies undermining the interests of the company and giving rise to a kind of moral hazard problem. Similar problem may arise with a family ownership, especially if it is associated with higher voting rights. Thus in these cases market forces such as the product market (Hart 1983) or the corporate control market (Stulz 1988) may fail to discipline the controlling shareholder towards firm value maximisation. In addition, Zhang (1998) suggested that higher concentration of ownership in the hands of a few holders may lead to slower response to changing market conditions due to a lack of professional monitoring mechanism. Secondly, a higher level of ownership concentration may be
an indication of an environment where it is costly to conduct control-related activities. Thus the level of ownership concentration could also indirectly account for the lack of monitoring of the activities of minority of controlling shareholders.
4.1. Empirical Relationships
4.1.1. Ownership and Capital Structure
Leverage among sample firms may increase or decrease with the level of ownership concentration as has been reflected in a kind of u-shaped relationship in this respect (e.g., see the non-parametric Kernel scatter plots in Figures 1, 2 and discussion in section 2). The u-shaped relationship is particularly pronounced for the Indonesian firms such that at lower level of concentration, shareholders may make use more of outside equity (resulting in a lower leverage) since they would not be concerned about the dilution of their dominance. The relationship however seems to change as we move to higher level of concentration when leverage level increases with further increases in levels of concentration possibly because of the non-dilution of the entrenchment effect. Similar effect is also noted among Korean firms though it remains less pronounced.
Thus the relationship between ownership structure and capital structure (DE) for firm i in year t can be expressed as follows:
) 2 ( %) 50 ( ) ( 2 3 4 1 1 1 0 i i i it it
it Concen Concen Voting u
DE =
α
+α
+α
> +α
+α
X
+We experimented with different combinations of ownership variables and also with different cut-off points for the ownership concentration variables (to capture non-linearity; see further discussion in section 4). Equation 2 turns out to be the most parsimonious specification for determining leverage in terms of ownership structure. Here X1it refer to other possible control variables (see discussion later in this section)
and the residual error term is u1it. Voting is a binary variable taking a value 1 if voting
4.1.2. Ownership and Firm Performance
The link between ownership structure and firm performance has been the subject of an on-going debate going back to Berle and Means (1932), who suggested that firms with a wide dispersal of shares tend to under-perform. In general, a positive relation between ownership concentration and firm efficiency is predicted and many studies have confirmed this (Shleifer & Vishny, 1986; Short, 1994; Gedajlovic & Shapiro, 1998; Thomsen & Pederson, 2000; Gorton & Schmidt, 1996; Kang and Shivadasani, 1995) Some studies have however contradicted this general finding (see, for example, Demsetz and Lehn, 1985 and Morck et al. 1988). Much of the variation in this literature appears attributable to the difficulties in obtaining a uniform measure of firm performance. However, it is also clear that much of this literature fails to control for variations in ownership structure and also the potential endogeneity problems.
Firm performance (Π) in our analysis is measured by the pre tax profit margin.10 In constructing a standard model of firm performance based on the industrial economics literature, one would include numerous variables relating to market structure, such as industry concentration, in order to allow for inter-firm variation in profits generated through inter-industry variation. However, such data that can be matched in with these data are not available, so it is necessary to remove the industry level variation from the data. We therefore calculate the firm level deviation of firm profit (pre and post tax) from the corresponding within-sample industry mean11 and specify two possible profit functions as follows:
) 3 ( %) 50 ( ) ( 2 2 4 3 2 1 0 i i i it it
it= + Concen + Concen> + Voting+ X +u
Π β β β β β
As with equation 2, equation 3 is also the most parsimonious profit functions that we had identified after testing of alternatives against one another. Here X2it captures all
other possible factors and u2it are the residual error term.
4.1.3. Other Explanatory Variables
In addition to indicators of ownership pattern, leverage and firm performance, a
10
The analysis was also carried out using post-tax profit margin and obtained similar results. 11
In section 5 we present the estimates using profit margin in deviation form. We however find that estimates using profit margin with industry dummies are very similar to those using profit margin as deviation from industry mean.
number of other control variables are included in both leverage and profit margin equations.
Firm size: Firm size is measured by the log of total sales. Firm size may be positively (Friend and Lang, 1988; Marsh, 1982) or negatively (Rajan and Zingales, 1995) related to leverage. Large firms may exercise economies of scale, have better knowledge of markets and are able to employ better managers. Large size may enable greater specialisation. It may also measure a firm's market power or the level of concentration in the industry. On the other hand, however, relatively large firms can be less efficient than smaller ones, because of the loss of control by top managers over strategic and operational activities (Himmelberg et. al 1999, Williamson 1967). Also as Jensen (1986) notes professional managers of a firm (who are not the owners) derive personal benefits from expanding beyond the optimal size of the firm by their desire to have, among others, power and status. The latter may increase leverage and lower firm efficiency.
Tobin’s Q value: This is a proxy for growth opportunities. The trade-off theory predicts that firms with more opportunities carry less leverage. The traditional version of the pecking order theory predicts the opposite result. Debt typically grows when retained earnings are less than investment requirement and vice-versa. Hence, for a given level of profitability, leverage is likely to be higher for firms with more growth/investment opportunities.
Age of the firm: Firm performance may depend on the accumulated knowledge about the market, experience and firm’s reputation. Hence, one would expect a positive relationship between age and profit margin. Old firms however, may be less open to new technology as well as more rigid in terms of style and effectiveness of managerial governance. This may result in a negative relation between the age and performance of the firm. As for capital structure, old firms, particularly in East Asian countries, are likely to have developed close links with their lenders and hence may be able to acquire debt more easily and at a cheaper rate, resulting in a positive relationship between the age and leverage of the firm.
Diversification: A firm is classified as diversified if it operates in more than three market segments, each accounting for more than 10% of the total revenue of the firm. Diversified firms may enjoy higher profits as a result of combining activities
such as production, distribution, marketing and research. The transaction cost theory (Williamson 1975) and imperfect external capital markets provide a rationale for firms to diversify. A different strand of this literature, however, argues that diversification has a negative effect on firm performance since diversified firm is prone to cross-subsidise investments poor growth opportunities (Berger and Ofek 1995) and the distortions in investment decisions can occur in the presence of managerial power struggle among the firm's various diversified divisions (Rajan, Servaes, and Zingales 2000). Empirically diversified firms do not appear to perform better and the causation tends to run from low performance resulting in a diversification of a firm. Inconclusive empirical evidence on this issue also suggests that managers may have objectives other than maximising profits, such as the growth of revenue, that lead firms to become diversified. As for capital structure, Lewellen (1971) argues that diversified firms enjoy greater debt capacity. Also if diversified firms have more stable cash flows, this is likely to have a positive impact on the supply of debt.
There are also some identifying variables in leverage and profit equations, given respectively by equations (2) and (3)s. This becomes particularly evident as we introduce simultaneity between leverage and profit equations (4) and (5). This is discussed in the following subsection.
4.2. Simultaneity between Capital Structure and Firm Performance
Based on the theoretical literature in section 3, agency problems are important in determining not only ownership structures but also capital structures. The Alternative capital structures will mitigate against different agency problems within signalling models on which our analysis is based. High leverage may reduce the agency costs of outside equity, and increase firm value by encouraging managers to act more in the interests of shareholders. Most existing literature in this area seeks to investigate the relation between profits (internal finance) and the choice between debt and equity (external finance). This however tends to be within a single equation approach, thus ignoring the potential simultaneity in the determination of profits and leverage. This is perhaps surprising when one considers the large literature that is concerned with
determining the optimal capital structure at the firm level, see for example Rajan and Zingales (1995), or Roberts (2002) and the literature discussed therein.
Berger and di Patti (2003) offer two hypotheses for the reverse causation from performance to capital structure. First, more efficient firms choose lower equity ratios than others, all else equal, because higher efficiency reduces the expected costs of bankruptcy and financial distress. The second hypothesis focuses on the income effect of the economic rents generated by efficiency (as an indicator of performance) on the choice of leverage. Thus more efficient firms choose higher equity capital ratios, all else equal, to protect the rents or franchise value associated with high efficiency from the possibility of liquidation. Prior evidence supports the notion that firms hold additional equity capital to protect franchise value (e.g., Keeley, 1990).
If firm performance affects the choice of capital structure and vice versa, then the failure to take this into account may result in serious simultaneity bias, with important implications for pattern of firm financing and performance. In the light of the two-way relationship between capital structure and firm efficiency, one needs to allow for the simultaneity between capital structure and firm performance. Thus equations (2) and (3) are modified as follows:
it it it it i i i it u PFT PFT X Voting Concen Concen DE 1 2 6 5 1 4 3 2 1 0 ( ) ( 50%) + + + + + > + + =
α
α
α
α
α
α
α
(4) it it it i i iit Concen Concen Voting X DE u
PFT =β0 +β1( ) +β2( >50%) +β3 +β4 2 +β5 + 2
(5)
As argued above, firms with higher profit margins may substitute outside equity capital for debt. On the other hand it may also be true that more efficient firms try to protect the value of their high income by holding more equity capital. The estimated coefficient of profit in the leverage equation would capture the net value of these two possible and opposite effects.
As indicated above, one may also expect some non-linearity in the effects of firm efficiency on capital structure so that firms at a higher level of efficiency may behave differently from those at a lower level. Since we are not sure about the nature of this non-linearity, we experimented with a few alternatives, namely, (a) inclusion of an additional square term of efficiency measure; (b) replacing efficiency measure by its log (natural) and (c) inclusion of an additional inverse term of the efficiency measure. In the end, inclusion of a square term of profit margin worked best in comparison to other alternatives as is highlighted in equation 4.
The agency cost hypothesis would predict that an increase in leverage raises efficiency. Some may however argue that there is a possible non-linearity in the effects of leverage on profit margin as a measure of firm efficiency as well. In particular, when leverage is sufficiently high, further increases may result in lower efficiency because the benefits in terms of reduced agency costs of outside equity are overcome by greater agency costs of debt. Our initial analysis in terms of parametric scatter plots (Figure 1, 2) in section 2 does not however suggest any non-linearity; hence in the final analysis we refrain from introducing any non-linearity in the effects of capital structure on profit margin. This is an important difference between the leverage and profit equations, after allowing for simultaneity.
4.3. Econometric Considerations
Given that ownership information is available only for the year 1996, we could construct a cross-section data-set for the period 1996-1998. This would mean that there will be a single observation for each firm such that leverage and firm performance relate to the average values of these variables for the period while all other variables correspond to the initial year 1996. There are at least two disadvantages with this kind of data-set. First, the single cross-section data cannot capture the aspect of time variation for a particular firm, if any. For one thing, the relationship between capital structure and firm performance is more pertinent for a given firm over time rather than among the cross-section of the firms. Secondly, 1996-98 period could be quite destabilising for the corporate sector in these countries when the crisis was in full fledge. Thus by focusing on the crisis period only, we may lose sight of some significant behavioural patterns among these Asian corporations.
Thus, we make use of the annual panel data-set for the period 1994-98, which we believe would capture the behavioural transition of these corporations better from pre-crisis years into the pre-crisis.
An important issue here relates to the potential endogeneity of ownership highlighted by Demsetz (1983). Empirical evidence does not however corroborate this. For example, Demsetz and Lehn (1985) used two stage least square (treating ownership as potentially endogenous) to find that ownership fails to explain variations in firm performance, which is further confirmed by Hermalin and Weisbach (1988) and Cho (1998). On the other hand, Morck et al. (1988) and other studies ignored the issue of endogeneity of ownership structure and produce evidence of a statistically significant effect of ownership structure on performance. Thus without much loss of generality, we treat ownership structure to be exogenously given. In any case, given that our ownership information is available only for 1996, following Bajaj et al. (1998) and La Porta et al. (1999), we assume ownership structure to be rather stable over time in our sample. This allows us to focus directly on the issues of our interest, i.e., to reinvestigate the relationship between capital structure and firm performance in terms of ownership structure, among others, allowing for the simultaneity and non-linearity between capital structure and firm performance.
Although, we have theoretically rationalised the simultaneity between leverage and performance, it is still important to test the hypothesis explicitly. Strictly, this involves testing for endogeneity in the variables, using a standard Hausman test. In all sub samples, and all models discussed above exogeneity of leverage in performance (equation 5), and performance in leverage (equation 4) is rejected. This therefore means that the standard “within” panel data determination of capital structure and firm performance that is reported elsewhere in the literature is invalid. While it is trivial to correct for the potential endogeneity with instrumental variables estimation, a preferred strategy is to jointly estimate equations (4) and (5), allowing for simultaneity between capital structure and firm efficiency. While the use of panel data to estimate systems of simultaneous equations is well understood, this generally involves converting the data to differences and estimate the system by either three stage least squares (3SLS) or generalised methods of moments (GMM) using lagged values as instruments to generate orthogonality conditions on differenced data. This is a straightforward simultaneous equations estimator following Holtz-Eakin et al (1988)
or Cornwell et al (1992), which allows for individual effects both within individual equations and in the covariance matrix between the equations, based on the more general approach of Arrellano and Bond (1988, 1991) or the more recent Blundell and Bond (1998) GMM systems estimator. It still relies on employing lags as instruments; so with short panels of unbalanced data such estimation reduces the number of observations dramatically. However, the essential problem here is that the data contain time-invariant variables. As such, one cannot adopt one of these approaches, as differencing the data becomes infeasible. We therefore adopt the 3SLS “within” estimation with error components suggested by Baltagi and Li (1992), based on Baltagi (1981). In practice this involves estimating equations (4) and (5), for example, separately using a standard “within estimator”12, and then calculating the covariance matrix between the equations using the errors. The data are then transformed by dividing through by the square root of the covariance, and finally equations (4) and (5) are estimated by 3SLS employing the transformed data. As the use of 3sls over 2sls implies further restrictions in the model, these restrictions can be tested again using a standard Hausman F test, and in all cases these restrictions are not rejected.
A final consideration is the issue of stability of coefficients across firms, which again is often ignored in this literature. As is outlined above, a high proportion of firms in SE Asia are family owned, with high concentrations of voting rights. There is however a significant group of firms that do not conform to this pattern. Given the issues that this paper seeks to address, the relationship between ownership, leverage and performance, one must consider whether any model designed to test for this would be expected to generate consistent results across these sub-samples. Accordingly, we test for this in each of the models that we present below. The hypothesis of uniform coefficients across groups is strongly rejected in every case using a standard F test, while the individual parameters point to the sources of this instability. A chow test for stability of coefficients across groups of firms within each country is presented in the tables below.
12
For both equations for both countries, random the random effects estimator rejects the restriction of fixed effects.
5. EMPIRICAL RESULTS
In this section we present and analyse the 3SLS estimates of the most parsimonious leverage and profit margin equations (4) and (5), allowing for simultaneity and non-linearity.
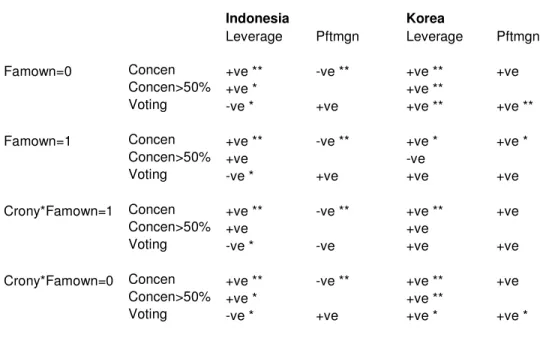
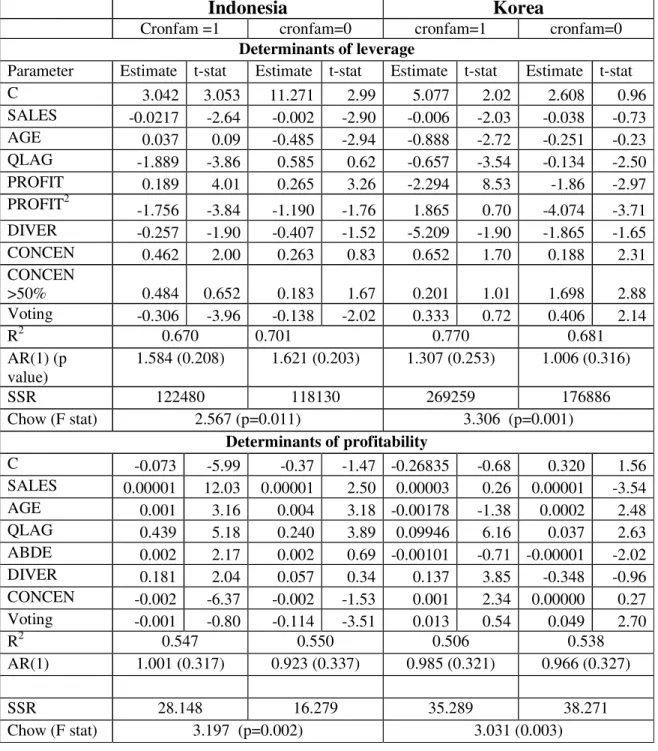
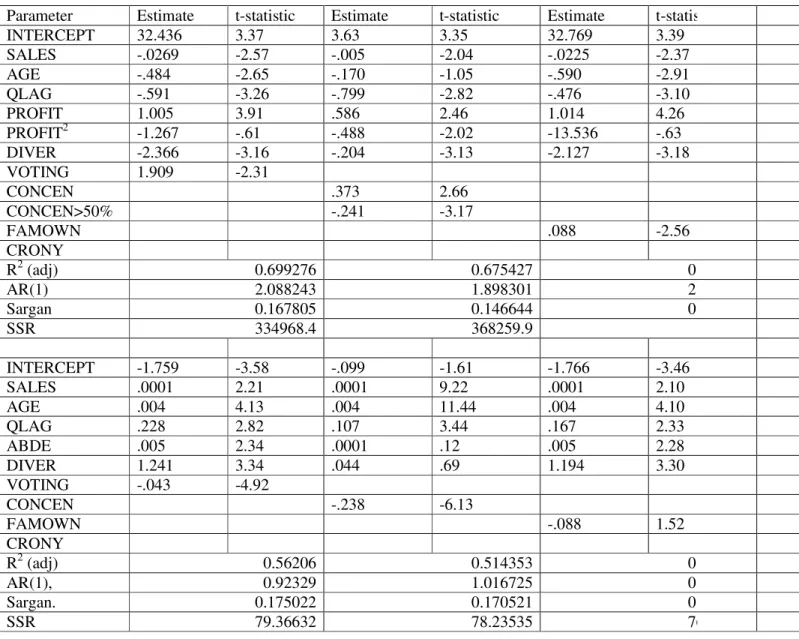
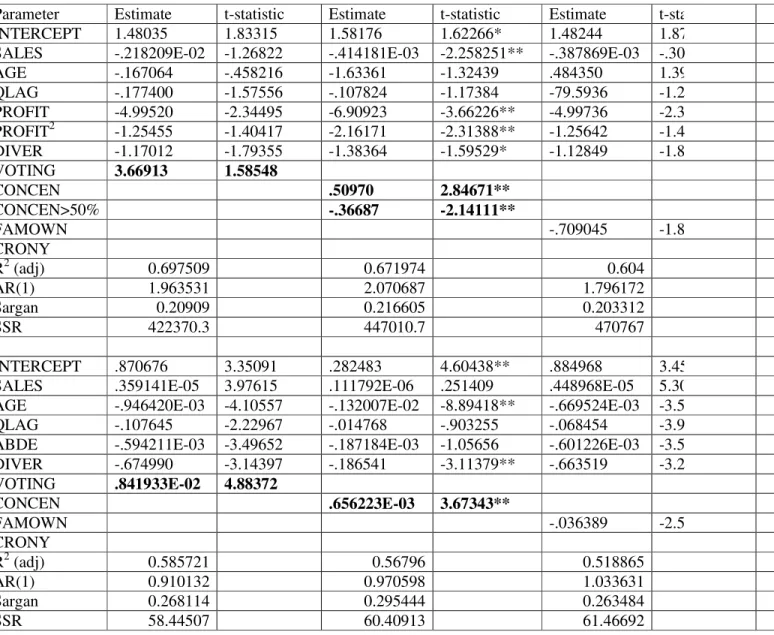
In order to address the problem of close association, we first started with the individual effects of the available ownership variables, namely, ownership concentration (Concen), Cronyman (Crony), family ownership (Famown) and higher voting rights (Voting). These results are summarised in Appendix Table A1 for the two sample countries. We then controlled for interaction between Famown and Crony as well as that between Famown and Concen. The pooling of different types of firms (family and others) may still bias the effects of ownership if the family firms are run differently from others. This is further justified by the significant instability of the coefficients for family and other types of firms. We therefore conclude that the best way to resolve this problem is to consider the effects of concentration of ownership for various sub-samples of firms characterised by differential ownership pattern. In particular, we distinguish between: (a) firms with/without family ownership; (b) firms with/without family ownership along with the presence of a Cronyman. Whether a firm is family owned or not and whether the firm has a Cronyman are quite important in our analysis. This is because the incentive effects are likely to be much stronger if the manager-shareholder is part of the family (CRONFAM=1), which is the dominant group in our sample. In contrast, a particular subgroup of CRONFAM=0, i.e., those with FAMOWN=0 and CRONYMAN=1, comes closest to the common manager-shareholder in standard models including Bajaj et al. (1998). Thus a comparison of the effects of concentration and higher voting rights on leverage and firm performance in these two groups of firms, namely, CRONFAM=1, 0, would allow us to capture the differential effects of managerial shareholding in these family-owned and other firms. We believe that this is a better way of disentangling the effects of ownership structure on firm financing and performance in our samples.
Having tested for various alternative combinations of ownership variables (after controlling for all other factors as well) for the full sample and also for the relevant sub-samples (Famown=0, 1; Cronfam13=0, 1), we find that 3SLS estimates
13
Note that this category is created by taking account of the interaction between family ownership (Famown=0, 1) and presence of a Cronyman (Cronyman=0,1) and is labelled as Cronfam=1,0. Clearly.
are robust as well as stable for various sub-samples while those for the full sample are not. We thus chose to focus on the 3SLS Estimates for two categories, namely, family firms with presence of a Cronyman (Cronfam=1) and also non-family firms with/without a Cronyman (Cronfam=0). We also compare these estimates with family (Famown=1) and non-family owned (Famown=0) firms and found that effects of ownership concentration and higher voting rights are rather similar for family firms and family firms with Cronyman (Cronfam=1). Likewise, we obtained similar effects of ownership among non-family firms (Famown=0) and also non-family firms with/without Cronyman (Cronfam=0). For each subsample of firms, we examine the effects of ownership concentration and degree of monitoring (i.e., effect of the binary variable voting) on leverage and firm performance indicator. These estimates are summarised in Table 5A while Table 5B highlights the central results of our interest corresponding to the variables indicating ownership concentration and degree of monitoring. We also compare these 3SLS estimates with the corresponding single equation estimates (see Table 6) and examine the relative efficiency of 3sls estimates vis-à-vis the single-equation fixed-effects estimates.
5.1. Effects of ownership structure
The dominant category in our samples is family firms with a Cronyman (famown=1 and crony=1), accounting for some 67% of Indonesian and 60% of Korean firms. Higher ownership concentration is associated with higher leverage among this group of firms, confirming the general theoretical predictions of Bajaj et al for any firms with a manager-shareholder. The effect of ownership concentration on profitability however seem to differ from the theoretical prediction of Bajaj et al, depending on the sub-sample considered for a given country and also between countries of our choice. Concentration exerts a positive effect of profitability (though insignificant) for Korea (conforms to the theoretical prediction), while the result is negative and significant for Indonesia. This suggests that the productivity and risk aversion effects outweigh each other for the Korean sample, while the risk aversion effect dominates the productivity
Cronfam=1 when Famown=1 and Cronyman=1. But Cronfam=0 includes three subgroup of firms: (a) Famown=0 and Cronyman=0;(b) Famown=1 and Cronyman=0 and (c) Famown=0 and Cronyman=1. It could however be noted that most firms in this subgroup fall in the sub-category (a) in both sample countries. Thus Cronfam=0 constitutes our reference category of non-family owned firms.
effect in Indonesia. This result may be due to the generally higher levels of concentration in Indonesia compared with Korea.
Bajaj et al. (1998) predicts that the degree of moral hazard for the manager shareholder is positively related to leverage while inversely related to firm performance. Since higher voting (relative to cash flow) rights are taken to be a measure of moral hazard, we expect the voting variable to have a positive effect on leverage and negative effect on profit margin. Any observed relationship is again however the result of two underlying effects: incentive effects (managers gain from better performance) and entrenchment effects (managers seek to prevent dilution of their control, and therefore seek to maintain high levels of leverage irrespective of performance. The results presented here suggest that voting has little impact on performance (as well as leverage) in Korea, such that the incentive and entrenchment effects outweigh each other. Voting concentration in Indonesia has a negative effect however on leverage (incentive effects being greater) and but no effect on profit margins, again suggesting that the two effects outweigh each other. In other words, degree of moral hazard (as proxied by higher voting rights) has limited impact on leverage or performance among family firms, suggesting that family ownership may mitigate some of the moral hazard problems generated by higher voting than cash flow rights. This may reflect the fact that in many cases managers are themselves the members of the owner’s family and may therefore not suffer from the traditional conflict of interests (and directly gain from better firm performance). This is an extension of central result of Bajaj et al. (1998).
Turning now to the analysis of the rest of the firms (Cronfam=0), we find that this group consists of 3 sub-groups:
(a) Family owned, but does not have a Cronyman : there are only 7 Indonesian firms and 20 Korean firms in this category;
(b) Not family owned, but has a Cronyman: there are only 1 Indonesian firms and 15 Korean firms in this category.
c) Neither family owned nor has a Cronyman: there are 22 Indonesian firms and 20 Korean firms.
The majority of firms in this category are thus neither family-owned nor has a controlling manager. We also note that estimates for this category (Cronfam=0) closely resembles estimates for non-family owned firms. As expected, the effect of concentration on leverage is positive and significant in both countries. There is also
some evidence of entrenchment effects in that concen>50% has a positive effect on leverage in Korea (but not in Indonesia). More interestingly, for these firms higher voting rights have significant effects on both leverage and profit margin in both countries, though again the estimate are of opposite sign in the two countries of our choice: both coefficients are positive in Korea while both are negative in Indonesia. In particular, the effect of voting on profit margin in Indonesia is compatible with the prediction of Bajaj et al., but that for Korea is not. The latter may reflect the lower average level of ownership concentration in Korea, such that higher voting rights in Korea appear to be associated with greater incentive effects (relative to entrenchment effects). As a result, higher voting than cash flow rights may improve firm performance in the Korean subsample.
Thus there is evidence that, unlike Claessens et al. (2002), our results vary between the two sample countries (with different institutional/legal framework) and perhaps question the basis of pooling of firms in different countries. Estimates presented here also demonstrate that the effect of ownership concentration on leverage is similar between family and non-family firms such that higher levels of concentration are associated with higher leverage. However, these two groups of firms appear to behave differently with respect to higher voting rights. While higher voting rights are unrelated to performance in family owned firms in both countries, these seem to matter significantly (albeit of different signs for the two countries) for the non-family owned firms. We argue that this difference reflects the fact that family ownership on its own can mitigate some of the problems of moral hazard that non-family owned firms cannot.
5.2. Simultaneity between capital structure and firm performance
There is also evidence of simultaneity between leverage and firm performance in our model. Irrespective of the choice sub-group, higher profit margin raises relative debt levels in Indonesia, but reduces them in Korea. There is also some evidence of non-linearity observed14 in this relationship for both countries. These results suggest that
14
There is also some difference in the nature of nonlinearity. The result is saying that leverage declines at a more than linear rate in Korea as profit increases. This is different from Indonesia, where a turning point can be identified, i.e., the two profit terms have opposite signs.
the substitution effect (against equity capital) is greater for more efficient firms in Indonesia, the income effect is relatively greater for Korean firms (see discussion in section 3).15 There is also some evidence of reverse causality though it’s somewhat weaker in that it does not hold for all the subgroups considered. Higher absolute levels of debt are associated with higher profit margins in family-owned Indonesian firms with a Cronyman, and lower profit margins among Korean firms with Cronfam=0. This may be a result of the greater average levels of leverage in Korea (see Table 3), such that further increases in debt may result in lower efficiency. This occurs because the benefits of reduced agency costs of outside equity are outweighed by greater agency costs of debt.
6. CONCLUDING COMMENTS
While many recent studies have highlighted the role of corporate governance on the recent Asian crisis (e.g., Claessens et al., 2000, 2002), effects of corporate governance (as reflected in the ownership structure) of these Asian corporations on capital structure and firm performance remains much unexplored. The present paper departs from this literature and attempts to disentangle the complex relationship between ownership structure, capital structure and firm performance in a world characterised by adverse selection and moral hazard. In doing so it also takes account of the possible simultaneity and non-linearity between capital structure and firm performance, much overlooked in the existing studies.
Results obtained from 1994-98 panel data drawn from a sample of Indonesian and Korean firms are supportive of a significant simultaneity between capital structure and firm performance. After allowing for this simultaneity, higher ownership concentration is associated with higher leverage irrespective of whether a firm is family owned or not. But the effects of higher control rights on leverage and profit margin depend on whether a firm is family owned or not. While higher voting rights 15
While profit margin affects capital structure in a non-linear way, there is however no evidence of non-linearity in the effect of capital structure on profit margin in our samples. Hence, we do not include the non-linear term in the profit function.
turn out to be insignificant among family firms, these significantly affect leverage and profit margin among non-family owned firms. We thus argue that family ownership could somewhat mitigate the moral hazard problem though it could still exacerbate the problem of over-lending.
The subsequent recovery of many East Asian Corporations in the Millennium has revived the search for appropriate institutional reforms in order to regain its pre-crisis dynamism and strength. If there is one lesson to be learnt from the last Crisis, it is that these corporations have become over-reliant on debt, this in part being a function of the prevailing ownership structures. One must therefore question whether firms in these countries will be able to maintain their robust patterns of recovery unless they reduce their leverage by going directly to capital markets rather than to banks. Of course East Asian countries will gain little by physically dismantling large family owned businesses. What is needed at this stage is the strengthening of bank-based corporate governance and other legal and judicial reforms that will improve the transparency and accountability of these enterprises and better protection of minority shareholders.
TABLES Table 1A. Ownership Structure
Korea Indonesia % of total firms with Concentration
>50% 6 47
25%- 50% 45 50
<25% 49 3
Highest level of concentration 63% 73%
Cronyman =1
% total firms 69 69
% of family owned firms out of firms with cronyman =1 86 98
Voting=1
% of total firms 25 54
% of firms with cronyman =1 out of firms with voting =1 90 92 % of firms with Concen>50% out of firms with voting =1 8 49 Family Ownership
% of total firms with family ownership 79 75
Table 1B. Correlation between ownership variables
Korea
CRONY VOTING FAMOWN CONCEN
CRONY 1.00000 VOTING 0.44826 1.00000 FAMOWN 0.93134 0.44379 1.00000 CONCEN 0.71136 0.42993 0.71968 1.0000 Indonesia CRONY 1.00000 VOTING 0.93719 1.00000 FAMOWN 0.50002 0.48555 1.0000 CONCEN 0.47657 0.47679 0.94905 1.00000
These correlation coefficients illustrate the problem that one encounters in attempting to include all of these variables in an equation together. These are the correlation coefficients for the transformed data, allowing the covariance between the equations, based on the full sample estimates. They are higher than for the raw data, but the signs remain consistent.
Table 2A. Proportion of low-leverage firms
Period Indonesia Korea Singapore
1993 0.68 0.17 0.87
1994-96 0.59 0.22 0.84
1997-98 0.28 0.21 0.76
Note: A low-leverage firm is defined as a firm with |DE|<1
Table 2B. Capital Structure
Korea Period % of the
total Firms Proportion of firms with negative equity Average Leverage (all firms Average Leverage (negative equity firms) Low Debt 1993 0.18 0.04 0.60 0.60 1994-96 0.22 0 0.45 0.71 1997-98 0.22 0.01 0.53 0.57 1994-98 0.22 0.54 0.64 High Debt 1993 0.82 0.02 4.9 29.3 1994-96 0.78 0.01 4.18 27.5 1997-98 0.78 0.13 7.37 11.8 1994-98 0.78 0.08 5.61 13.1 Indonesia Low Debt 1993 0.45 - 0.37 - 1994-96 0.52 - 0.46 - 1997-98 0.29 - 0.46 - 1994-98 0.47 - 0.46 - High Debt 1993 0.55 - 1.28 - 1994-96 0.48 - 1.52 - 1997-98 0.71 0.14 6.1 8.22 1994-98 0.53 0.11 3.34 8.22
Table 3. Effects of ownership structure on leverage and firm performance
Korea |ABDE| Π |ABDE| Π |ABDE| Π
Concen<25% 25%<= Concen >=50% Concen>50%
1994-96 3.85 0.09 2.77 0.10 4.98 0.12 1997-98 5.03 -0.05 5.79 -0.03 2.13 0.08 Famown=1 Famown=0 1994-96 3.24 0.09 3.53 0.11 1997-98 4.41 -0.02 6.05 -0.01 Voting=1 Voting =0 1994-96 2.97 0.09 3.56 0.10 1997-98 4.73 -0.01 5.31 -0.04 Cronyman=1 Cronyman =0 1994-96 3.55 0.09 2.99 0.10 1997-98 4.79 -0.05 6.24 0.00
Indonesia |ABDE| Π |ABDE| Π |ABDE| Π
Concen<25% 25%<=Concen >=50% Concen>50%
1994-96 0.97 0.19 1.29 0.18 0.78 0.17 1997-98 10.38 -0.19 2.77 -0.20 5.50 0.10 Famown=1 Famown=0 1994-96 0.90 0.18 0.82 0.18 1997-98 8.77 -0.07 5.17 0.04 Cronyman =1 Cronyman =0 1994-96 0.91 0.18 0.80 0.18 1997-98 8.70 -0.07 6.49 0.03 Voting=1 Voting =0 1994-96 0.89 0.18 0.85 0.18 1997-98 9.84 -0.16 5.23 0.10
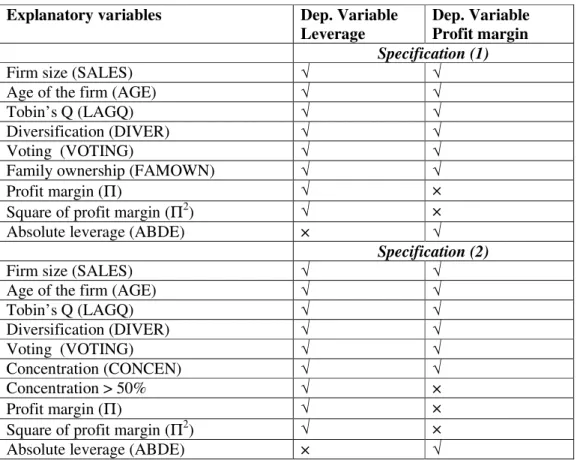
Table 4. Model specification
Explanatory variables Dep. Variable
Leverage
Dep. Variable Profit margin
Specification (1)
Firm size (SALES) √ √
Age of the firm (AGE) √ √
Tobin’s Q (LAGQ) √ √
Diversification (DIVER) √ √
Voting (VOTING) √ √
Family ownership (FAMOWN) √ √
Profit margin (Π) √ ×
Square of profit margin (Π2) √ ×
Absolute leverage (ABDE) × √
Specification (2)
Firm size (SALES) √ √
Age of the firm (AGE) √ √
Tobin’s Q (LAGQ) √ √ Diversification (DIVER) √ √ Voting (VOTING) √ √ Concentration (CONCEN) √ √ Concentration > 50% √ × Profit margin (Π) √ ×
Square of profit margin (Π2) √ ×