UCLA
UCLA Electronic Theses and Dissertations
Title
Cloud-based Analysis and Integration of Proteomics and Metabolomics Datasets
Permalink
https://escholarship.org/uc/item/38z2r59gAuthor
Choi, HowardPublication Date
2019 Peer reviewed|Thesis/dissertationeScholarship.org Powered by the California Digital Library
UNIVERSITY OF CALIFORNIA Los Angeles
Cloud-based Analysis and Integration of Proteomics and Metabolomics Datasets
A dissertation submitted in partial satisfaction of the requirements for the degree Doctor of Philosophy
in Bioinformatics
by
Jeong Ho (Howard) Choi
© Copyright by Jeong Ho (Howard) Choi
ii
ABSTRACT OF THE DISSERTATION
Cloud-based Analysis and Integration of Proteomics and Metabolomics Datasets by
Jeong Ho (Howard) Choi Doctor of Philosophy in Bioinformatics University of California, Los Angeles, 2019
Professor Peipei Ping, Chair
Our capabilities to define cardiovascular health and disease using highly multivariate “omics” datasets have substantially increased in recent years. Advances in acquisition technologies as well as bioinformatics methods have paved the way for ultimately resolving every biomolecule comprising various human “omes”. Understanding how different “omes” change and interact with one another temporally will ultimately unveil multi-omic molecular signatures that inform pathologic mechanisms, indicate disease phenotypes, and identify new therapeutic targets. Herein we describe a thesis project that creates novel, contemporary data science methods and workflows to extract temporal molecular signatures of disease from multi-omics analyses, and develops integrated omics knowledgebases for the cardiovascular community at-large.
Chapter 1 provides an overview of cardiac physiology and pathophysiology involved in cardiac remodeling and heart failure (HF). A description of the systematic characterization of cardiac proteomes and metabolomes is included, including methodologies for multi-omics phenotyping. Finally, an overview of bioinformatics methods for driver molecule discovery is provided, discussing strategies for characterizing temporal patterns and conducting functional enrichment.
iii
Chapter 2 describes computational approaches to discern the oxidative posttranslational modification (O-PTM) proteome, an important factor in cardiac remodeling. We developed a novel platform involving a customized, quantitative biotin switch pipeline and advanced analytic workflow to profile O-PTMs in an isoproterenol (ISO)-induced cardiac remodeling mouse model. We identified 1,655 proteins containing 3,324 oxidized sites, and unveiled temporal progression of O-PTM in disease. Chapter 3 discusses computational approaches for identifying temporal metabolomics fingerprints in HF treatment. Pathologic remodeling from a healthy to diseased heart involves a series of alterations over time. Mechanical circulatory support devices (MCSD) are a promising strategy for unloading the heart and reversing this process. We sought to identify molecular drivers of pathologic remodeling and reverse remodeling in the plasma metabolome; however, machine learning (ML)-empowered technological platforms required for these analyses are lacking. Thus, we established a Multiple Reaction Monitoring (MRM)-based MS quantitative platform and ML-based computational workflow to discern metabolomics fingerprints. We quantified 610 plasma metabolites and identified those exhibiting high correlation to cardiac phenotype, demonstrating a novel platform for biomarker discovery. Finally, Chapter 4 integrates all aforementioned innovations into one unified, cloud-based computational knowledgebase, MetProt, equipped to analyze, annotate, and integrate metabolomics and proteomics information. This pipeline fully characterizes the plasma metabolome in HF, unveils the interplay of proteomes and metabolomes, and derives new knowledge in cardiovascular medicine. Innovations include engineered features for addressing large-scale clinical datasets as well as algorithms to connect various types of molecules (e.g., proteins and metabolites). Chapter 4 is subdivided into 3 projects: Project 1 describes a computational pipeline to characterize the plasma metabolome using datasets from the ISO mouse model of HF and human HF; Project 2 develops bioinformatics strategies to integrate proteome and metabolome datasets from six genetically distinct mouse strains; and Project 3 establishes the cloud-based MetProt to disseminate the above computational pipelines for the
iv
cardiovascular community at-large. Taken together, these innovations offer new approaches and workflows for integrated omics investigations that enable novel discovery and ultimately advance precision cardiovascular science and medicine.
v
The dissertation of Jeong Ho (Howard) Choi is approved Alex Bui Mario C. Deng
Wei Wang
Peipei Ping, Committee Chair
University of California, Los Angeles 2019
vi To my family.
vii
TABLE OF CONTENTS
Abstract of the Dissertation ……… ii
Table of Contents ……… vii
List of Figures ……….. viii
List of Tables ……… ix
Recurring Notations and Abbreviations ………... x
Acknowledgements ………. xi
Biographical Sketch ………. xii
CHAPTER 1: INTRODUCTION AND OVERVIEW. 1.I. The Landscape of the Human Heart and Disease ……….. 2
1.II. Systematic Characterization of the Cardiac Proteome and Metabolome ……….. 5
1.III. Overview of Bioinformatic Methods for Driver Molecule Identification and Integration .. 6
1.IV. Overview and Rationale ……… 12
CHAPTER 2: COMPUTATIONAL APPROACHES TO DISSECT THE CYSTEINE O-PTM PROTEOME DURING CARDIAC HYPERTROPHY. 2.I. Abstract ……….. 15
2.II. Introduction ……… 15
2.III.Methods and Materials ……….... 17
2.IV.Results ………..………. 26
2.V. Discussion ………. 56
2.VI.Conclusions ………... 58
CHAPTER 3: COMPUTATIONAL APPROACHES TO IDENTIFY METABOLOME FINGERPRINTS OF PATHOLOGICAL STAGES FOLLOWING HEART FAILURE TREATMENT. 3.I. Abstract ……….. 60
3.II. Introduction ……… 61
3.III. Methods and Materials ………... 64
3.IV.Results ………..………. 68
3.V. Discussion ………. 83
CHAPTER 4: CLOUD-BASED COMPUTATIONAL KNOWLEDGEBASE TO ANALYZE, ANNOTATE, AND INTEGRATE METABOLOMICS AND PROTEOMICS DATASETS 4.I. Abstract ……….. 93 4.II. Introduction ……… 94 4.III.Results ………..………. 99 4.IV.Discussion ………. 108 4.V. Conclusions ………... 115 REFERENCES ..………... 116
viii
LIST OF FIGURES
FIGURE 1.1 Hierachical Structure of Hypothesis Tests ……… 8 FIGURE 2.1 Quantitative cysteine O-PTM proteomics workflow ………. 25 FIGURE 2.2 Impact of ISO-induced cardiac hypertrophy on the reversible cysteine
O-PTM profile ……… 37 FIGURE 2.3 Temporal profiling of reversible cysteine O-PTM proteomes using
cubic spline-based clustering. ………. 43 FIGURE 2.4 Temporal profiling combining reversible cysteine O-PTM and total
cysteine proteomes using cubic spline-based co-clustering ……….. 45 FIGURE 2.5 Phenotypic alteration and corresponding cysteine site fingerprints
during ISO-induced cardiac hypertrophy ……….. 50 FIGURE 2.6 Signature pathways and proteins that contribute to cardiac hypertrophy …….. 52 FIGURE 3.1 Schematic Overview of Experimental Protocol for Global Plasma
Metabolomics Profiling in ISO-stimulated Mice, Healthy Humans,
and HF Patients. ……….. 69 FIGURE 3.2 Metabolomics Dynamics in Mouse Plasma During ISO-induced
Cardiac Remodeling.. ……….. 71 FIGURE 3.3 Phenotypic Alteration and Corresponding Metabolic Fingerprints
During ISO-induced Cardiac Remodeling in Mice .……….…………. 74 FIGURE 3.4 Healthy Human Subjects Plasma Metabolomics Stability and
Their Distinction from HF Patients ………..………... 77 FIGURE 3.5 Metabolomics Dynamics in Plasma from HF Patients Before and
After MCSD Implantation.………. 78 FIGURE 3.6 Temporal Changes of Clinical Manifestation and Corresponding
Metabolomic Dynamics in HF Patients Following MCSD Implantation.………… 81 FIGURE 4.1 MetProt Integrated workflws .………...…..…………..……… 100 FIGURE 4.2 Intersections where metabolome meets proteome .………..…………... 103 FIGURE 4.3 MetProt Distributed System Archiecture ……..…..…………..………..…………. 106 FIGURE 4.4 MetProt User Interface ……..…..…………..………..………107
ix
LIST OF TABLES
TABLE 2.1 Summary information of raw file contents and statistics for all
experimental groups ………... 23&24 TABLE 2.2 List of cysteine sites with alterations in modification abundance
during cardiac hypertrophy ………. 28-32 TABLE 2.3 Enriched biological pathways of proteins bearing cysteine sites
with significantly increased/decreased modification abundance ………….…. 33-35 TABLE 2.4 List of cysteine sites significantly correlated with the hypertrophy
phenotype ………... 46-48 TABLE 2.5 Enriched biological pathways of proteins associated with cysteine
sites significantly correlated with the hypertrophy phenotype ……… 51 TABLE 3.1 Biological Calsses of 610 Targeted Metabolites in Mouse and
Human Plasma ………... .63 TABLE 3.2 Demographics of the Human Cohorts ………. 65-66
x
RECURRING NOTATIONS AND ABBREVIATIONS
ATP Adenosine triphosphate HF Heart Failure
ISO Isoproterenol
k Protein turnover rate constant kp Precursor turnover rate constant LC Liquid chromatography
LMM Linear Mixed Model
MCSD Mechanical Circulatory Support Device ML Machine Learning
MRM Multiple-Reaction-Monitoring MS Mass spectrometry
MS/MS Tandem mass spectrometry
O-PTM Oxidative stress-sensitive Post-translational modifications PTM Post-translational modifications
xi
ACKNOWLEDGEMENTS
I am particularly indebted to my mentor, Dr. Peipei Ping, for not only giving me the opportunity to conduct my research in her laboratory, but also providing me with the necessary resources. From her guidance, support, and patience, I have grown tremendously both intellectually and as an individual. I would also like to give my sincere appreciations to the other members of my committee, Drs. Wei Wang, Alex Bui, and Mario C. Deng for their enduring guidances and supports.
I would also like to thank my dear friends and colleagues, Dr. Jie Wang, Dr. David Liem, Dr. Ding Wang, Dr. Dominic Ng, Dr. Bilal Mirza, Dr. Harry Caufield, Mr. Anders Garlid (soon to be a doctor!), Dr. Dibakar Sigdel, Mr. Vincent Kyi, Dr. X’avia Chan, Dr. Sarah Scruggs, Dr. Dibakar Sigdel, Dr. Travis Cao, Dr. Nobel Zong, Dr. Haomin Li and the rest of the Ping lab members and our collaborators globally. To Henning Hermjakob, Antonio Febregat Mundo, and Juan Antonio Vizcaino at EMBL-EBI, I could not accomplish this without you.
Finally, I am most grateful to my family; to my parents whom taught me to say my first sentence and write my first equation, whom hold my hands through my educations in kindergarten, elementary schools, until now the completion of my PhD thesis. I am also tremendously grateful to my parents in law for their devoted support and love. To the joy of my life, my son and my wife for your enormous love and strong support, this thesis is for you.
xii
BIOGRAPHICAL SKETCH
Education and employment:M.S. Bioinformatics and Medical Informatics, San Diego State University, CA, 2012 B.S. Biological Resources and Technology, Yonsei University, South Korea, 2007 2010 - 2012 Research Programmer, The Scripps Research Institute, La Jolla, CA,
2010 Summer Internship, The Scripps Research Institute, La Jolla, CA Peer reviewed publications:
1. Chung, N. C.; Mirza, B.; Choi, H.; Wang, J.; Wang, D.; Ping, P.; Wang, W. (2019). Unsupervised Classification of Multi-Omics Data during Cardiac Remodeling using Deep Learning. Methods., pii: S1046-2023(18)30359-1. doi: 10.1016/j.ymeth.2019.03.004. PMID: 30853547.
2. Mirza, B.; Wang, W.; Wang, J.; Choi, H.; Chung, N. C.; Ping, P. (2019). Machine Learning and Integrative Analysis of Biomedical Big Data. Genes (Basel)., 10(2), 87. doi: 10.3390/genes10020087. PMID: 30696086.
3. Choi, H.; Wang, J.; Chung, N. C.; Cao, Q.; Ng, D. C. M.; Mirza, B.; Scruggs, S. B.; Wang, D.; Garlid, A. O.; Ping, P. (2018). Integrated Dissection of the Cysteine Oxidative Post-translational Modification Proteome During Cardiac Hypertrophy. J Proteome Res., 17(12), 4243-4257. doi: 10.1021/acs.jproteome.8b00372. PMID: 30141336.
4. Liem, D. A.; Murali, S.; Sigdel, D.; Shi, Y.; Wang, X.; Shen, J.; Choi, H.; Caufield, J. H.; Wang, W.; Ping, P.; Han, J. (2018). Phrase Mining of Textual Data to Analyze Extracellular Matrix Protein Patterns Across Cardiovascular Disease. Am J Physiol Heart Circ Physiol., 315(4), H910-H924. doi: 10.1152/ajpheart.00175.2018. PMID: 29775406.
5. Baek, K. I.; Li, R.; Jen, N.; Choi, H.; Kaboodrangi, A.; Ping, P.; Liem, D.; Beebe, T.; Hsiai, T. K. (2018). Flow-Responsive Vascular Endothelial Growth Factor Receptor-Protein Kinase C Isoform Epsilon Signaling Mediates Glycolytic Metabolites for Vascular Repair. Antioxid Redox Signal., 28(1), 31-43. doi: 10.1089/ars.2017.7044. PMID: 28762754.
6. Zhang, Y.; Xu, T.; Shan, B.; Hart, J.; Aslanian, A.; Han, X.; Zong, N.; Li, H.; Choi, H.; Wang, D.; Acharya, L.; Du, L.; Vogt, P. K.; Ping, P.; Yates, J. R., 3rd. (2015). ProteinInferencer: Confident protein identification and multiple experiment comparison for large scale proteomics projects. J Proteomics., 129, 25-32. doi: 10.1016/j.jprot.2015.07.006. PMID: 26196237.
7. Villaveces, J. M.; Jimenez, R. C.; Porras, P.; Del-Toro, N.; Duesbury, M.; Dumousseau, M.; Orchard, S.; Choi, H.; Ping, P.; Zong, N. C.; Askenazi, M.; Habermann, B. H.; Hermjakob, H. (2015). Merging and scoring molecular interactions utilising existing community standards: tools, use-cases and a case study. Database (Oxdord)., 2015, bau131. doi: 10.1093/database/bau131. PMID: 25652942.
8. Lindskog, C.; Linne, J.; Fagerberg, L.; Hallstrom, B. M.; Sundberg, C. J.; Lindholm, M.; Huss, M.; Kampf, C.; Choi, H.; Liem, D. A.; Ping, P.; Varemo, L.; Mardinoglu, A.; Nielsen, J.; Larsson, E.; Ponten, F.; Uhlen, M. (2015). The human cardiac and skeletal muscle
xiii
proteomes defined by transcriptomics and antibody-based profiling. BMC Genomics., 16(1), 475. doi: 10.1186/s12864-015-1686-y. PMID: 26109061.
9. Zong, N.; Ping, P.; Lau, E.; Choi, H. J.; Ng, D. C.; Meyer, D.; Fang, C.; Li, H.; Wang, D.; Zelaya, I. M.; Yates, J. R., 3rd; Lam, M. P. (2014). Lysine ubiquitination and acetylation of human cardiac 20S proteasomes. Proteomics Clin Appl., 8(7-8), 590-594. doi: 10.1002/prca.201400029. PMID: 24957502.
10. Lotz, C.; Lin, A. J.; Black, C. M.; Zhang, J.; Lau, E.; Deng, N.; Wang, Y.; Zong, N. C.; Choi, J. H.; Xu, T.; Liem, D. A.; Korge, P.; Weiss, J. N.; Hermjakob, H.; Yates, J. R., 3rd; Apweiler, R.; Ping, P. (2014). Characterization, design, and function of the mitochondrial proteome: from organs to organisms. J Proteome Res., 13(2), 433-446. doi: 10.1021/pr400539j. PMID: 24070373.
11. Zong, N. C.; Li, H.; Li, H.; Lam, M. P.; Jimenez, R. C.; Kim, C. S.; Deng, N.; Kim, A. K.; Choi, J. H.; Zelaya, I.; Liem, D.; Meyer, D.; Odeberg, J.; Fang, C.; Lu, H. J.; Xu, T.; Weiss, J.; Duan, H.; Uhlen, M.; Yates, J. R., 3rd; Apweiler, R.; Ge, J.; Hermjakob, H.; Ping, P. (2013). Integration of cardiac proteome biology and medicine by a specialized knowledgebase. Circ Res., 113(9), 1043-1053. doi: 10.1161/CIRCRESAHA.113.301151. PMID: 23965338.
12. Li, H.; Zong, N. C.; Liang, X.; Kim, A. K.; Choi, J. H.; Deng, N.; Zelaya, I.; Lam, M.; Duan, H.; Ping, P. (2013). A novel spectral library workflow to enhance protein identifications. J Proteomics., 81, 173-184. doi: 10.1016/j.jprot.2013.01.026. PMID: 23391412.
13. Fonslow, B. R.; Stein, B. D.; Webb, K. J.; Xu, T.; Choi, J.; Park, S. K.; Yates, J. R., 3rd. (2013). Digestion and depletion of abundant proteins improves proteomic coverage. Nat Methods., 10(1), 54-56. doi: 10.1038/nmeth.2250. PMID: 23160281.
14. Chan, C. X.; Khan, A. A.; Choi, J. H.; Ng, C. D.; Cadeiras, M.; Deng, M.; Ping, P. (2013). Technology platform development for targeted plasma metabolites in human heart failure. Clin Proteomics., 10(1), 7. doi: 10.1186/1559-0275-10-7. PMID: 23826926.
15. Fonslow, B. R.; Niessen, S. M.; Singh, M.; Wong, C. C.; Xu, T.; Carvalho, P. C.; Choi, J.; Park, S. K.; Yates, J. R., 3rd. (2012). Single-step inline hydroxyapatite enrichment facilitates identification and quantitation of phosphopeptides from mass-limited proteomes with MudPIT. J Proteome Res., 11 (5), 2697-2709. doi: 10.1021/pr300200x. PMID: 22509746. 16. Culver, B. P.; Savas, J. N.; Park, S. K.; Choi, J. H.; Zheng, S.; Zeitlin, S. O.; Yates, J. R.,
3rd. (2012). Tanese, N., Proteomic analysis of wild-type and mutant huntingtin-associated proteins in mouse brains identifies unique interactions and involvement in protein synthesis. J Biol Chem., 287(26), 21599-21614. doi: 10.1074/jbc.M112.359307. PMID: 22556411.
1
2
1.I. The Landscape of the Human Heart and Disease.
1.I.A. Cardiac Structure and Physiology.
The heart is a muscular organ that pumps blood to the body via the vessels of the circulatory system (Venes 2009). The circulatory system delivers the blood to all tissues in order to provide the body with oxygen and nutrients, and carries away metabolic wastes such as nitrogen compounds or sulphates for excretion (Hall and Guyton 2011). In humans and other mammals (e.g., mouse), the heart consists of four chambers including left and right atria and left and right ventricles, as well as four valves including two atrioventricular valves between atria and ventricles and two semilunar valves at the exit of each ventricle that prevent backflow (Starr, Evers, and Starr 2009; Kaplan 2008). The right atrium and right ventricle, commonly referred to as the right heart, collects deoxygenated blood from superior and inferior venae cavae and pumps into the pulmonary circulation in order to oxygenate the blood via the lungs. The left atrium and the left ventricle, referred to as the left heart, receives oxygenated blood via pulmonary veins and pumps into the systemic circulation. The heart is primarily made up with two types of cells: cardiomyocytes (~99%) which are contractile cells that enable the heart to pump, and cardiac pacemaker cells (~1%) that spontaneously depolarize and rapidly spread the impulse from cell to cell to trigger the autorhythmic contraction. Cardiomyocytes have a high mitochondrial density, which occupy at least 30% of cell volume (Piquereau et al. 2013), enabling them to produce sufficient amounts of adenosine triphosphate (ATP) to fuel contraction. This high density of the power plant of the cell combined with its rhythmic electrical impulse enables the heart to beat approximately to 72 beats per minute (bpm) at rest in humans, and more than 31 million times per year or 2 billion beats over an average lifetime.
3 1.I.B. Cardiac Remodeling and Heart Failure.
Cardiac remodeling, also referred to as ventricular remodeling, is defined as an alteration in the structure (dimensions, mass, shape) of the heart in response to hemodynamic load and/or cardiac injury in parallel with neurohormonal activation (Cohn, Ferrari, and Sharpe 2000). Remodeling can be either adaptive or maladaptive, with maladaptive cardiac remodeling leading to heart failure (HF) (Dorn, Robbins, and Sugden 2003). HF is a condition in which the heart is unable to pump a sufficient amount of blood to meet the body’s demand. HF is a convergent end result of many etiologies of heart disease, including cardiomyopathies. HF is a common, costly, and potentially fatal disease responsible for >300,000 deaths a year in the US, with 5.8 million Americans currently afflicted (Mancini and Colombo 2015; Roger 2013; Braunwald 2015; Goldberg et al. 2007). A major reason why this common disease is so intractable is its complex, multifactorial nature where disease outcome is often the combinatorial effect of multiple genetic and environmental causes.
1.I.C. Biomarkers of Heart Failure Progression.
B-type natriuretic peptide (BNP) and its biologically inert, amino-terminal pro-peptide counterpart (NT-proBNP) are the gold standard biomarkers in determining the diagnosis and prognosis of HF (Hanna K. Gaggin and Januzzi 2013). An array of additional biomarkers has emerged and can be arranged into the following categories: 1) myocardial stress/injury (e.g., myocyte stretch markers: MR-proANP; myocardial injury markers: troponin T, troponin I, myosin light-chain I, heart-type fatty-acid protein, CKMB; oxidative stress markers: myeloperoxidase, uric acid, oxidized low-density lipoproteins, urinary biopyrrins, urinary and plasma isoprostanes, plasma malodialdehyde), 2) neurohormonal activation (e.g., renin angiotensin system markers: renin, angiotensin II, aldosterone; sympathetic nervous system: norepinephrine, chromogranin A, MR-proADM; arginine vasopressin system: arginine vasopressin, copeptin; endothelins: ET-1, big proET-1), 3) remodeling (e.g., inflammation: C-reactive protein, TNF-α, soluble TNF
4
receptors, Fas, interleukins [I, 6 and 18], osteoprotegerin, adiponectin; hypertrophy/fibrosis: matrix metalloproteinases, collagen propeptides, galectin-3, soluble ST2; apoptosis: GDF-15; misc: MicroRNA, quiescin Q6, VEGFR-1) and 4) comorbidities (e.g., renal biomarkers: creatinine, BUN, eGFR, cystatin C, β-trace protein; renal injury markers: NGAL, KIM-1, NAG, liver-type fatty acid binding protein, IL-18; hematologic biomarkers: hemoglobin, RDW, iron deficiency [ferritin, transferrin sat], albumin) (Hanna Kim Gaggin et al. 2017).
The majority of key biomarkers mentioned above are comprised of proteins, post-translationally modified proteins, and metabolites. Notably, oxidative stress-related molecules comprise a significant population of myocardial stress/injury markers, suggesting a prominent role for oxidative stress in cardiac remodeling and heart failure. Although biomarkers such as BNP and troponin T are helpful in the diagnosis and management of irreversible myocardial injury, we currently have no satisfactory diagnostic markers of many cardiovascular complications that possibly leads to heart failure such as reversible myocardial ischemia, i.e. either stable or unstable angina (Gerszten, Asnani, and Carr 2011; Morrow et al. 2003). Despite increasing demand for cardiovascular biomarkers, few new markers have been FDA approved for the diagnosis of cardiovascular diseases (Morrow et al. 2003). Mass spectrometry (MS)-based proteomics and metabolomic technologies are capable of identifying hundreds to thousands of proteins, metabolites and oxidative stress-related molecules in cells, tissues and biofluids. Thus, a systematic approach integrating multi-omics analysis (i.e., proteomics, O-PTM proteomics, and metabolomics) would provide deep phenotyping to reveal new biomarkers, prioritize biomarker validation, and monitor biomarker panels for heart failure progression and drug response.
5
1.II. Systematic Characterization of the Cardiac Proteome and Metabolome.
1.II.A. Systematic Profiling of The Cardiac Proteome
As molecules that perform most mechanical and biochemical functions in the heart, proteins provide critical information to systems biology studies that aim to uncover the mechanisms of disease susceptibility and cardiac plasticity. Technologies now exist that can easily identify and quantify large numbers of proteins in a single experiment (Lotz et al. 2014; Mann 2006). These studies have advanced our understanding of the components constructing protein interaction networks (Orchard et al. 2014), the role of post-translational modifications in modulating cellular signals (Streng et al. 2013), the dynamics of individual protein half-life in response to perturbation (Lam et al. 2014), and the totality of proteins contributing to a given cellular process or organelle (Kim et al. 2014). One of the principal lessons from the proteomics revolution is that gene expression is no surrogate for protein function, e.g., following ISO stimulation, protein abundance changes independently of mRNA (Lam et al. 2014).
1.II.B. Profiling of the Cardiac Metabolomic Landscape.
The persistent contraction of cardiomyocytes demands tremendous amounts of energy; thus, maintaining metabolic homeostasis is essential for heart function. Accumulating evidence suggests that perturbation of cardiac metabolism plays an important role in the pathological progression of HF (Neubauer 2007). Comprehensive quantification of metabolite abundance in blood plasma, also known as plasma metabolomics profiling, provides mechanistic insights into the molecular alterations underlying HF (Cheng et al. 2015). The large-scale quantification of circulating metabolites also identifies metabolic changes for clinical classification, which may assess the outcomes of HF patients before and after optimal medical therapy and surgical interventions (Lloyd-Jones 2010). These metabolomic approaches can be established as
6
important avenues for biomarker and drug target development, as well as the validation of the efficacy of patient treatments.
1.II.C. Multi-omics Phenotyping of HF.
Along with advances in high-throughput technologies, recent studies have integrated gene expression profiling with proteomics, and have facilitated our understanding of the pathophysiology and the molecular mechanisms of HF (Hou et al. 2015; Dos Remedios et al. 2003). However, there are no systematic approaches for the integration of large proteomic datasets with metabolome datasets due to a glaring lack of bioinformatics strategies that can connect proteins to metabolites and elucidate their relationships.
1.III. Overview of Bioinformatic Methods for Driver Molecule Identification and Integration.
The availability of proteomics and metabolomics data analysis tools is currently limited compared to genomics analysis tools. For example, the Aztec resource discovery index (http://aztec.bio/) lists 778 proteomics tools, and 147 metabolomics tools while it lists thousands of genomics tools. To our knowledge, there is no application or computational pipeline that comprehensively analyzes, annotates, and integrates large-scale proteomic and metabolomic datasets. This limitation significantly hinders our capability to identify patterns of biomolecules relevant to HF.
1.III.A. Computational Approaches to Identify Driver Molecules.
Differential Expression Analysis: Differential Expression Analysis (DEA) is a univariate method widely used in omics studies for targeting molecules that are statistically significantly altered (i.e., up-regulated or down-regulated) after a medical treatment or physical exercise (Xia et al. 2015, 2012, 2009; Xia and Wishart 2011b). This method mainly employs two criteria: the
fold-7
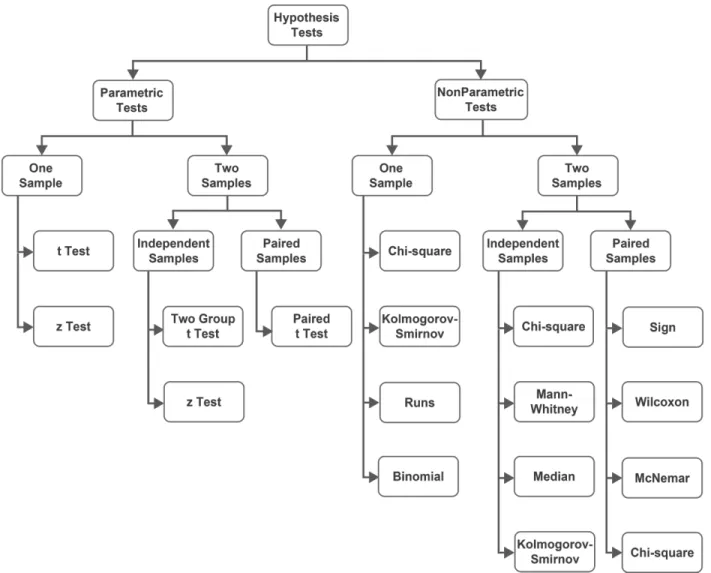
change of the molecule abundance in two sample groups and the adjusted p-value from statistical hypothesis testing followed by multiple testing correction. Recent studies have shown that if the sample size is sufficient (i.e., n > 12), the univariate test such as t test followed by multiple testing correction can outperform the multivariate methods (e.g., linear support vector machine-recursive features elimination or principal component discriminant analysis) in terms of not missing the true positives (Christin et al. 2013). Alternatively to the t test, a non-parametric test such as Wilcoxon signed-rank test can be applied if it is difficult to test the normality of the dataset (Figure 1.1.). Following the statistical hypothesis test, multiple testing correction to the p-values can be applied using the Benjamini-Hochberg method to reduce the false positives rate. Subsequently, the identified molecules can be validated by classification/clustering methods, such as Principal Component Analysis (PCA) or Unsupervised Hierarchical Clustering. PCA is a multivariate method for dimensional reduction of large datasets with many variables or observations. This facilitates visualization, clustering, pattern recognition, and identification of the key variables that vary most significantly across a population. PCA can aid investigators in understanding complex, higher-dimensional datasets by projecting them into a 2- or 3-dimensional space, where they can be more easily visualized without sacrificing fidelity (Xia et al. 2015, 2012, 2009; Xia and Wishart 2011b, [a] 2011). Moreover, Unsupervised Hierarchical Clustering is a widely used data analysis method to build a binary tree from data by merging similar groups of points based on the calculated distances across samples or molecules. Usually, the distances are displayed as dendrograms (Xia et al. 2015, 2012, 2009).
8
Figure 1.1. Hierachical Structure of Hypothesis Tests. Hypothetical testing related to statistical differences are classified into two categories: parametric and nonparametric tests, depending on prior knowledge about the population parameter. For each category, statistical approaches suitable for one sample or two samples tests are as illustrated in the hierarchical graph. For two sample test, statistical methods are further divided into independent and paired samples depend on the structure of the data. Among 11 statistical methods, t test and z test are applied in both one sample and two-sample tests of the parametric test, whereas Chi-square and Kolmogorov-Smirnov are applied in both subcategories of the non-parametric test. In addition, Runs and Binomial are specific for one sample non-parametric test; Mann-Whitney and Median are specific for independent two-sample non-parametric test; Sign, Wilcoxon, and McNemar are specific for paired two-sample non-parametric test. This hypothesis test hierarchy serves as the guiding principle for the implementation of statistical approaches throughout this thesis.
Machine Learning-based Feature Extraction: Machine Learning (ML)-based feature selection algorithm aims to identify key molecules discriminating one condition from the other. The filtered and scaled data from a mouse model is divided into non-overlapping training and test datasets. A two-stage feature selection and validation workflow are created to extract signature
9
metabolites. On the training set, randomized least absolute shrinkage and selection operator (LASSO)-based stability selection is applied in the first stage to screen for metabolites of interest and support vector machine (SVM)-based recursive feature elimination (RFE) is applied in the second stage to identify a subset of accurate metabolites. Subsequently, the identified metabolites are validated on the test sets using predictive models and then local interpretable model-agnostic explanations (LIME) (Ribeiro, Singh, and Guestrin 2016) is applied to understand the predictions made by ML models. Finally, a Bayesian networks-based graphical model is created to discover causal relationships between identified metabolites and phenotypic response.
Mixed Model-based Association Study: Linear Mixed Model (LMM) with Sample Relatedness Correction analyzes time-series omics data generated from heterogeneous samples to identify driver molecules that are highly associated with phenotypic characteristics. LMM correlates two variables and incorporates the samples’ relatedness, represented by omics expression or demographic factors, to improve statistical accuracy. We have applied LMM with Sample Relatedness Correction in our preliminary metabolomics study to find fingerprints of pathological stages following induction of HF using chronic infusion of the beta-adrenergic agonist, isoproterenol (ISO) HF treatment (H. M. Kang et al. 2008; Kirby et al. 2010).
1.III.B. Bioinformatic Stretage to Characterize Dynamic Patterns of Molecules
Cubic Spline-based Temporal Clustering: Cubic spline-based temporal clustering is a technique where first computes a low-degree polynomial pieces that fit smoothly on data, and then clusters the similar spline curves using clustering methods such as K-mean clustering. We used this technique in our studies to analyze metabolite concentrations for six genetically heterogeneous strains of mich that exhibit varying phenotypes including different susceptibilities to cardiac dysfunction. We subjected these to chronic ISO treatment over 14 days. Both CTRL
10
and ISO groups were selected for cubic spline-based temporal clustering. Missing concentration values were replaced with the average occupancy of the available timepoints for every strain. The log2-transformed ratio of concentration values of ISO to CTRL was calculated per site per strain. After scaling and centering these ratios, cubic splines were fitted to them across the timepoints in R. The degree of smoothing was automatically determined by leave-one-out cross-validation applied to each site per strain. The predicted spline values were used for K-mean clustering (kmean in R), following identification of the cluster numbers (mclust package in R).
1.III.C. Functional Enrichment Analysis and Annotation
Pathway Enrichment Analysis: Significantly altered metabolites in our studies may be searched against several metabolomics databases, including Chemical Entities of Biological Interest (ChEBI, UK) (Hastings et al. 2013), Human Metabolome Database (HMDB, Canada) (Wishart et al. 2013, 2009, 2007), and LIPID Metabolites And Pathways Strategy (LIPID MAPS) (Fahy et al. 2009, 2007) to cross-reference identifiers that are commonly used by pathway enrichment search engines and databases. The pathways enriched with identified metabolites may be further annotated with resources including MetaboLights (Haug et al. 2013) and Reactome (EMBL-EBI, UK) (Fabregat et al. 2016; Milacic et al. 2012).
Cloud-based Computational Knowledgebase: To extract biological meaning from multi-omics datasets, researchers rely heavily on computational resources that analyze and annotate the molecules of interest with known information. Currently, access to tools/annotations is not straightforward because they reside in fragmented and incomplete repositories. To address this challenge, we created a novel distributed query system and cloud-based infrastructure, MetProt, that is capable of providing unified access to protein and metabolite datasets, allowing users to submit a single query to access multiple resources including Reactome (Fabregat et al. 2016; Milacic et al. 2012), UniProt (UniProt Consortium 2015), MetaboLights (Haug et al. 2013),
11
BioGPS (Wu et al. 2016; Wu, Macleod, and Su 2013), Gene Wiki (Tsueng et al. 2016), and COPaKB (N. C. Zong et al. 2013; H. Li et al. 2013). We also engineered customized application programming interfaces (APIs) to provide direct access for information in MetProt. These resources are described below.
COPaKB: COPaKB (N. C. Zong et al. 2013; H. Li et al. 2013; N. Zong et al. 2014) (http://heartproteome.org) is an omics analysis platform with 2 key components: (1) a peptide spectral search engine; and (2) spectral library modules for knowledge annotation.
Reactome: The Reactome (Milacic et al. 2012; Croft et al. 2014) (http://reactome.org) platform is a suite of network analysis tools for performing topology analysis and over-representation analysis of gene/protein networks. It comprises a manually curated database of human pathways with views of protein and metabolite structures overlaid with expression data. We interfaced with Reactome to identify key pathways of interest in our omics data.
MetaboLights: MetaboLights (http://ebi.ac.uk/metabolights/) is a public database dedicated to the submission and sharing of metabolomics data, mass spectra, annotated biological roles, and other derived information (Haug et al. 2013). Based on spectral similarities and chemical structures, we employed its search services to analyze and interpret metabolite data we collected from our studies.
BioGPS/Gene Wiki: BioGPS (http://biogps.org) is an interface for omics research (Wu et al. 2016). It provides a user-customizable portal with aggregated information on protein annotations and target list analysis. Gene Wiki translates molecular information into structured knowledge; relevant pages representing molecular transducers will be aggregated and recruited into MetProt.
12
1.IV. Overview and Rationale.
Heart failure (HF), which afflicts an estimated 6.5 million Americans and has incurred $6.5 billion in medical costs that are projected to grow within the next 20 years, remains a significant challenge to diagnosis and treat due to its heterogeneous clinical manifestations and multifactorial risk drivers (Benjamin et al. 2018; Dunbar et al. 2018). Maladaptive cardiac remodeling and heart failure (HF) are common stages of many heart diseases and pose major public health problems in the United States (McMurray 2010). To date, advanced HF patients are clinically treated as a homogenous group with similar standard therapies (WRITING COMMITTEE MEMBERS et al. 2013). However, HF is a multifactorial disease and results not only from cardiac overload or injury, but also from a complex interplay among genetic, neurohormonal, inflammatory, and biochemical alterations, requiring more sophisticated means to stratify patient groups for divergent therapies (S. J. Shah et al. 2015; Taylor et al. 2004). Over the past years, racial disparities in HF are well documented (East et al. 2004; Mensah et al. 2005) along with common comorbidities such as hypertension, obesity, kidney disease, and diabetes, which before the age of 40 can predict the severity and outcome of HF (Husaini et al. 2011).
Research efforts have been spurred to understand its underlying molecular mechanisms for developing targeted therapeutic strategies (A. M. Shah et al. 2014). Towards this goal, the advancement of analytical technologies has drastically increased the depth, quality and volume of data generated by both proteomics and metabolomics experiments. Both proteins and metabolites are essential building blocks of cellular processes that collaboratively formulate biological pathways. In addition, oxidative stress is becoming increasingly recognized as a key signaling event in the progression of heart failure (Maulik and Kumar 2012). In response to oxidative stress, O-PTMs of proteins have been shown to alter the 3-dimensional structure and therefore functional activities of proteins in various biological pathways contributing to
13
hypertrophy development (Qin et al. 2014; Birk et al. 2015; Bak and Weerapana 2015). However, many large datasets of either proteins, protein O-PTM, or metabolites are often fragmented and rarely integrated, hindering the understanding of mechanistic details of heart failure progression and the extraction of statistically significant and biologically relevant molecular signatures.
Here, we will deep phenotype heart failure progression via newly developed machine learning and statistical workflows and platforms for collective analyses of the landscape of oxidative stress-modified proteomics, metabolomics, and protein-metabolite networks. In Chapter 2, we performed a multi-faceted proteomics study, combined with a state-of-the-art computational pipeline, to elucidate key O-PTMs of molecular signatures and pathways in cardiac remodeling and heart failure progression. In Chapter 3, we established a Multiple Reaction Monitoring (MRM)-based MS quantitative platform and a corresponding computational workflow to unravel the metabolomics fingerprints of healthy humans, HF patients, and a mouse model. Accordingly, we quantified the plasma levels of 610 metabolites, and identified metabolites highly correlated to phenotypic changes. Our study highlights an established computational workflow that, in conjunction with a benchmark dataset, will facilitate future biomarker discovery. In chapter 4, we built a cloud-based platform, MetProt, for quantifying, triaging and analyzing omics datasets, and in doing so elucidating novel connections between proteins and metabolites, annotating molecular functions, and providing biomedical insights.
14
CHAPTER 2: COMPUTATIONAL APPROACHES TO DISSECT THE
CYSTEINE O-PTM PROTEOME DURING CARDIAC HYPERTROPHY
15
2.I. Abstract.
Cysteine oxidative modification of cellular proteins is crucial for many aspects of cardiac hypertrophy development. However, integrated dissection of multiple types of cysteine oxidative post-translational modifications (O-PTM) of proteomes in cardiac hypertrophy is currently missing. Here we developed a novel discovery platform encompassing a customized biotin switch-based quantitative proteomics pipeline and an advanced analytic workflow to comprehensively profile the landscape of cysteine O-PTM in an ISO-induced cardiac hypertrophy mouse model. Specifically, we identified a total of 1,655 proteins containing 3,324 oxidized cysteine sites by at least one of the following three modifications: reversible cysteine O-PTM, cysteine sulfinylation (CysSO2H), and cysteine sulfonylation (CysSO3H). Analyzing the hypertrophy signatures that are reproducibly discovered from this computational workflow unveiled 4 biological processes with increased cysteine O-PTM. Among them, protein phosphorylation, creatine metabolism, and response to elevated Ca2+ pathways exhibited an elevation of cysteine O-PTM in early stages whereas glucose metabolism enzymes were increasingly modified in later stages, illustrating a temporal regulatory map in cardiac hypertrophy. Our cysteine O-PTM platform depicts a dynamic and integrated landscape of the cysteine oxidative proteome, through the extracted molecular signatures, and provides critical mechanistic insights in cardiac hypertrophy. Data are available via ProteomeXchange with identifier PXD010336.
2.II. Introduction.
Cardiac hypertrophy is an adaptive response of the heart to pressure overload and a risk factor for heart failure and sudden cardiac death (Shimizu and Minamino 2016; Maulik and Kumar 2012; Souders et al. 2012). The complex and dynamic pathophysiological mechanisms surrounding cardiac hypertrophy have been the focus of many investigations seeking therapeutic strategies. Reactive oxygen and nitrogen species (RO/NS) have been recognized
16
as second messengers that mediate important biological processes during the development of cardiac hypertrophy (Maulik and Kumar 2012; Murray and Van Eyk 2012). As a major target of RO/NS, protein cysteine residues can act as molecular switches and undergo various types of O-PTM (Lim et al. 2003), which can alter protein 3D structure and activity in cellular signaling, adaptive and maladaptive cardiac responses (Murray and Van Eyk 2012; Pastore and Piemonte 2013; Sag, Santos, and Shah 2014). Major cysteine O-PTM types observed in cardiac muscle include reversible (S-nitrosylation, S-glutathionylation, sulfenic acid, inter- and intramolecular disulfide bonds and S-sulfhydration) and irreversible sulfinic acid (CysSO2H) or sulfonic acid (CysSO3H) modifications (Murray and Van Eyk 2012; Alcock, Perkins, and Chalker 2018; Forrester and Stamler 2007).
As dysregulation of cysteine O-PTM is directly associated with disease pathology (Bechtel and Weerapana 2017; Murray and Van Eyk 2012), identification and characterization of cysteine O-PTM could yield a wider range of biomarkers and therapeutic targets for diseases characterized by oxidative stress. Due to the complexity of the cysteine oxidative proteome, elucidation of these molecular signatures during hypertrophy progression is currently lacking. Biotin switch assays and numerous iterations of this technique provide validated toolkits to customize the proteomic discovery platform and maximize the detection and quantification of the labile reversible cysteine O-PTM (Murray and Van Eyk 2012; Jaffrey and Snyder 2001). For example, work by Jennifer van Eyk’s laboratory has advanced methodologies to specifically detect S-nitrosylation and measure individual protein thiol-reactivity, thereby discriminating artifacts and ambiguity surrounding site assignment of oxidation (Murray et al. 2013, 2012). Meanwhile, spline-based computational analysis enables extraction of temporal patterns (T.-Y. Liu et al. 2017; Bhasi, Forrest, and Ramanathan 2005).
17
Here, we present the first proteome-wide study of major cysteine modification types in cardiac hypertrophy, including reversible O-PTM, CysSO2H, and CysSO3H. We devised a biotin switch-based cysteine O-PTM discovery platform specific for multi-time point quantitative proteomic analysis at different disease stages of hypertrophic progression. To limit non-biologically oxidized peptides, we selected a maleimide-based reagent for enrichment labeling and combined dimethyl labeling for quantification. Comparing to IAM based labeling, maleimide provides higher specificity and reactivity with free thiols (Kramer et al. 2015; Reisz et al. 2013). In addition, dimethyl-based quantitative labeling is highly-efficient and cost-effective in studies with large sample size. We implemented the cubic spline-based computational workflow to capture the cysteine O-PTM clusters with distinct temporal profiles and high association with a hypertrophic phenotypic temporal profile. We define proteins in these clusters as molecular signatures. The novelty lies in this being the first study to link global oxidative proteomic signatures to distinct time points of hypertrophic progression, thus showcasing multi-factor, temporal fingerprints rather than a singular protein or snapshot at one specific time point.
2.III. Methods and Materials.
2.III.A. Experimental Animal Models.
Male C57BL/6J mice, 9–12 weeks of age (Jackson Laboratories), were housed in a 12-hour light/12-hour dark cycle with controlled temperature, humidity, and access to standard chow and water ad libitum. Mice were surgically implanted with a subcutaneous micro-osmotic pump (ALZET) delivering 15mg/kg/day isoproterenol (ISO) (Sigma) or saline vehicle (Lau et al. 2018, 2016). In this treatment protocol, mice develop a gradual cardiac hypertrophy phenotype characterized by significantly increased ejection fraction and HW/BW (Lau et al. 2016; Drews et al. 2010). Independent groups of 3 mice from each treatment condition were euthanized for sample collection at 1, 3, 5, 7, 10, and 14 days post-implantation. Four technical replicates were
18
performed for each treatment condition. All animal procedures were performed in accordance with the Guide for the Care and Use of Laboratory Animals by the National Research Council and approved by the Animal Research Committee at UCLA.
2.III.B. Biotin Switch-based Sample Processing
Protein extraction. Left ventricles were collected from mouse hearts and placed in 1mL NP-40 lysis buffer (50mM Tris–HCl, pH 8, 137mM NaCl, 10% glycerol, 1% NP-40, 2mM EDTA) containing 100mM N-ethylmaleimide (NEM) and Halt™ Protease Inhibitor Cocktail (100X) (ThermoFisher Scientific). Tissue was homogenized using a glass hand homogenizer and mixed by rotation for 2hr at 4°C before centrifugation at 13,800g for 20 min at 4°C. The protein concentration of the supernatant was measured using the DC™ protein assay (Bio-Rad).
Biotin switch-based labeling of reversible cysteine O-PTM. Aliquots containing 2mg protein were prepared, then precipitated by 10% trichloroacetic acid (TCA) and centrifuged at 20,000g for 15min at 4°C. One wash with ice-cold 5% TCA and two washes with 95% ethanol were performed to get rid of small molecules. Pellets were re-suspended and alkylated in 1mL of urea-containing cysteine modification buffer (CMBU) (0.1M HEPES-NaOH, pH7.4, 1% SDS, 10mM diethylenetriaminepentaacetic acid [DTPA], 6M urea) with 0.1M NEM. After 30min rotation at room temperature, the samples were reduced by 0.12M dithiothreitol (DTT) and rotated for another 60min. To quantify the total abundance of cysteine sites and to preserve cysteine sulfinylation (CysSO2H) and sulfonylation (CysSO3H), 10% of the lysate was reserved as an unlabeled portion and underwent acetone precipitation followed by digestion. For the remaining 90%, proteins were separated from small molecules by centrifugation with 10% TCA, followed by one wash with 5% TCA and two washes with 95% ethanol. Pellets were suspended in 300µL CMBU with 0.1mM maleimide-biotin (Mal-Biotin) (Sigma-Aldrich). After a 30min rotation at room temperature, unreacted NEM was quenched with 10mM DTT for an additional
19
30min. Small molecules and proteins were separated by TCA and ethanol washes as described above (J. Wang and Sevier 2016; J. Wang et al. 2014).
Digestion and dimethyl labeling. Pellets from both labeled and unlabeled portions were solubilized in 0.1M triethylammonium bicarbonate buffer (TAEB) with 0.1% Rapigest (Waters) and heated at 60°C for 45min. Solubilized proteins were alkylated with 9mM iodoacetamide (IAM) incubation in the dark at room temperature for 30min. The alkylated lysate underwent trypsin digestion overnight (16hr) at 37°C with a 1:100 ratio of trypsin to protein. A final concentration of 0.16% (vol/vol) CH2O or C2H2O (Sigma-Aldrich) and 24mM sodium cyanoborohydride (NaBH3CN) (Sigma-Aldrich) were added to the designated samples with light or medium labeling, respectively. Reciprocal labeling was performed on two out of four technical replicates to minimize the technical bias from dimethyl labeling. After a 1 h incubation at room temperature, 0.16% (vol/vol) ammonium solution was added and mixed for 15 min to quench the reaction (García-Santamarina et al. 2014; Gu and Robinson 2016; Boersema et al. 2009).
Mal-biotin enrichment. Mal-Biotin and dimethyl labeled peptides were diluted in 1.2mL PBS with 200µL pre-washed High-Capacity NeutrAvidin slurry (Thermo Scientific). After overnight incubation, the sample was centrifuged, washed twice with 1mL PBS, once with 50mM ammonium bicarbonate w/ 20% methanol, and eluted with 50% Pierce™ acetonitrile (ACN) w/ 0.4% trifluoroacetic acid (TFA) (Chung et al. 2015).
C18 column cleanup. All samples were subjected to 30min incubation at 37°C with 1% TFA and centrifugation (13,000g for 15min) to remove remaining Rapigest. Samples were cleaned with PierceTM C18 Spin Columns (Thermo Scientific) to remove any interfering substances prior to LC-MS/MS analysis.
20 2.III.C. LC-MS/MS Analysis.
LC-MS/MS was performed on digested peptides as previously described (Lau et al. 2018, 2016). To reduce sample complexity and increase protein coverage, we fractionated peptide samples using high-pH/low–pH two-dimensional reversed-phase chromatography prior to MS/MS. Fifty micrograms of peptides were injected into a Phenomenex C18 column (Jupiter Proteo C12, 4-µm particle, 90-Å pore, 100mm×1mm dimension) using a Finnigan Surveyor LC system (Thermo Scientific) for the first-dimension (high-pH) separation. We established a gradient between solvent A (20mM ammonium formate, pH 10) and solvent B (20mM ammonium formate, 90% acetonitrile, pH10) at a 50µL·min−1 flow-rate with the following timing and solvent proportions: 0–5% solvent B in solvent A from 0–2min; 5–35% solvent B in solvent A from 3–32min; and, finally, 80% solvent B in solvent A from 32–37min. Six fractions of peptides were collected from 16–40min, lyophilized, and re-dissolved in 20µL 0.5% formic acid with 2% acetonitrile. Each high-pH fraction was injected (10μL) to an EasySpray C18 column (PepMap, 3-μm particle, 100-Å pore; 75μm×150mm dimension; Thermo Scientific) using an auto-sampler on a single Easy-nLC 1000 nano-UPLC system (Thermo Scientific) for second-dimension (low-pH) reversed-phase chromatography analysis. We established a gradient between solvent A (0.1% formic acid, 2% acetonitrile) and solvent B (0.1% formic acid, 80% acetonitrile) at a flow rate of 300nL·min−1 with the following timing and solvent proportions: 0–40% solvent B from 0– 110 min; 40–80% B from 110–117min; and 80% B from 117–120min. Column pressure was maintained below 150bar. High-resolution LC-MS/MS was performed on a single LTQ Orbitrap Elite instrument (Thermo Scientific) through a Thermo EasySpray interface. MS signals were acquired in Fourier-Transform/Ion-Trap (FT/IT) mode: each FT MS1 survey scan was analyzed at 400 to 2000 m/z mass range and 60,000 resolving power in profile mode, followed by rapid IT
21
MS2 scans on the top 15 ions with monoisotopic peak selection and 3000 intensity threshold. MS2 precursor isolation width was set to 2 m/z, normalized collision energy was 35, and charge state 1 and unassigned charge state were excluded. MS1 and MS2 target ion accumulation targets were 104 and 106, respectively. MS1 lock mass (m/z 425.120025) and dynamic exclusion (90s) were used. Throughout the LC-MS/MS experiment, column temperature was held at a constant 50°C.
2.III.D. Quantification of Cysteine O-PTM Abundance
The acquired raw mass spectra were processed with MaxQuant software (Cox and Mann 2008) version 1.5.6.0 as described (García-Santamarina et al. 2014). Peptide identification was performed using the Andromeda search engine (Cox et al. 2011), against a reverse-decoyed protein sequence database (UniProt Reference Proteome, reviewed, accessed June-12–2016). This Mus musculus proteome (taxonomy ID: 10090) database contains 33588 canonical sequences and does not include isoform information. Common contaminants were included in the database search. First and main searches were performed with precursor mass tolerances of 20ppm and 4.5ppm. Product ion tolerance was set to 0.5Da. Specificity for trypsin cleavage was required, allowing up to two missed cleavage sites (van der Reest et al. 2018). Dimethylated peptide labels were identified using the “multiplicity” query, including “DimethLys0” and “DimethN-term0” as light labels as well as “DimethLys4” and “DimethN4” as medium labels with a maximum four modified sites for each identified peptide. Variable modification types for enriched samples include Mal-biotin labeled cysteine (451.1889 Da), NEM-labeled cysteine (125.0477 Da), IAM-labeled cysteine (57.0215 Da), and methionine sulfoxidation (15.9949 Da) were queried with a maximum five modified sites for each identified peptide. Variable modification types for unlabeled whole tissue lysate samples include NEM-labeled cysteine (125.0477 Da), IAM-labeled cysteine (57.0215 Da), methionine sulfoxidation (15.9949 Da),
22
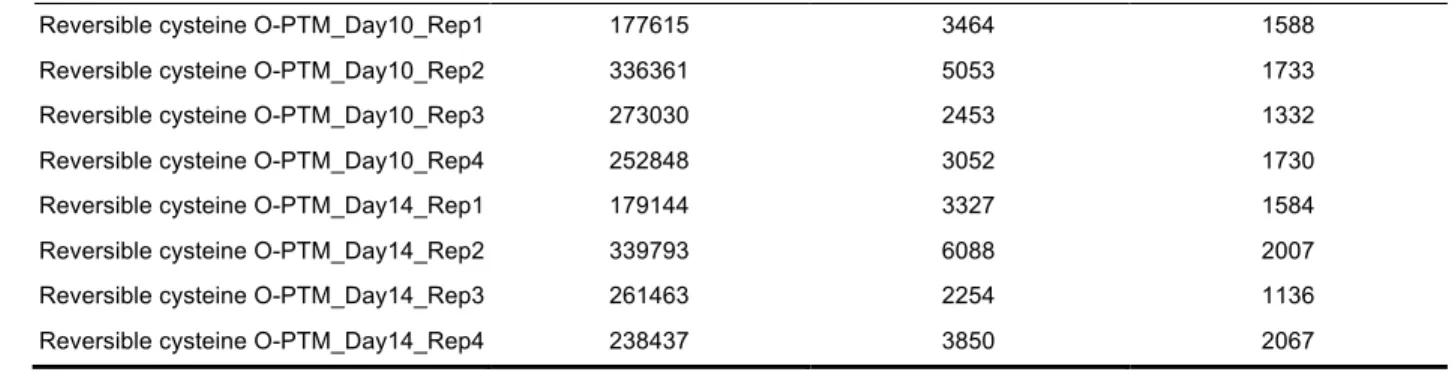
CysSO2H (31.9898 Da), and CysSO3H (47.9847 Da) were queried with a maximum five modified sites for each identified peptide. Tryptic, semi-tryptic, and non-tryptic peptides within a 20ppm parent mass window surrounding the candidate precursor mass were searched. Peptide ions from up to 3 isotopic peaks with fragment mass tolerance of 600ppm were allowed. Protein inference required ≤5% peptide spectra matching (PSM), posterior error probability (PEP), and ≤1% global level protein false discovery rate (FDR) (Q-value ≤1%), as well as a minimum of 2 ratio counts. Peptides with a cysteine count lower than one were excluded, along with reverse and potential contaminant flagged peptides. Modified peptide identifications with an Andromeda search score greater than 40, a delta score greater than 6, and a localization probability >0.8 were allowed (Bogdanow, Zauber, and Selbach 2016). All searches for a given data set were based on one set of Andromeda peak list files (apl-files). Each of the cysteine modifications (i.e. Mal-biotin, NEM, IAM, CysSO2H, and CysSO3H) was generated as a separate output file with identified cysteine sites, their extracted ion chromatogram (XIC) values, and normalized ratios of ISO vs. Vehicle conditions calculated from the differential dimethyl labeled peptides. To ensure data quality, technical replicates with significant change (p-value <0.05) in overall normalized ratio distribution among all four replicates were excluded. The total abundance of one cysteine site is quantified as the sum of XIC values from both modified and unmodified forms of that particular cysteine. Detailed information on number of spectra for identification and quantification, as well as number of unique peptide identified per experimental group are listed in Table 2.1. Furthermore, number of unique peptides, percent sequence coverage, heavy over light (H/L) ratio of mean peak area (± percent ratio H/L variability). The mass spectrometry proteomics data have been deposited to the ProteomeXchange Consortium (Deutsch et al. 2017) via the PRIDE (Vizcaíno et al. 2016) partner repository with the dataset identifier PXD010336.
23
Experimental Group # Spectra for Identification # Spectra for Quantification # Unique Peptide Identified
Total cysteine_Day1_Rep1 545427 9521 4935 Total cysteine_Day1_Rep2 435853 19484 8035 Total cysteine_Day1_Rep3 613730 18328 7422 Total cysteine_Day1_Rep4 494484 18236 7156 Total cysteine_Day3_Rep1 493264 13098 6039 Total cysteine_Day3_Rep2 478093 19376 8885 Total cysteine_Day3_Rep3 572188 19778 8007 Total cysteine_Day3_Rep4 496781 19996 7752 Total cysteine_Day5_Rep1 513134 6201 3293 Total cysteine_Day5_Rep2 327835 10759 5743 Total cysteine_Day5_Rep3 626678 20711 8109 Total cysteine_Day5_Rep4 521663 16660 7057 Total cysteine_Day7_Rep1 533963 16200 6780 Total cysteine_Day7_Rep2 597921 15568 7120 Total cysteine_Day7_Rep3 609493 24065 10116 Total cysteine_Day7_Rep4 505500 20557 8011 Total cysteine_Day10_Rep1 614085 18505 6755 Total cysteine_Day10_Rep2 456761 21063 8392 Total cysteine_Day10_Rep3 602423 18246 7832 Total cysteine_Day10_Rep4 503221 18106 7063 Total cysteine_Day14_Rep1 586878 11614 5019 Total cysteine_Day14_Rep2 554245 18840 8224 Total cysteine_Day14_Rep3 604953 20311 8381 Total cysteine_Day14_Rep4 472933 17988 7126 Reversible cysteine O-PTM_Day1_Rep1 227533 5012 2048 Reversible cysteine O-PTM_Day1_Rep2 314860 5868 2080 Reversible cysteine O-PTM_Day1_Rep3 357770 4044 1688 Reversible cysteine O-PTM_Day1_Rep4 274523 2887 1397 Reversible cysteine O-PTM_Day3_Rep1 262151 4290 1891 Reversible cysteine O-PTM_Day3_Rep2 326416 6133 2061 Reversible cysteine O-PTM_Day3_Rep3 284474 3457 1579 Reversible cysteine O-PTM_Day3_Rep4 252848 3052 1730 Reversible cysteine O-PTM_Day5_Rep1 213077 5751 2401 Reversible cysteine O-PTM_Day5_Rep2 337457 6302 2123 Reversible cysteine O-PTM_Day5_Rep3 296146 3761 1690 Reversible cysteine O-PTM_Day5_Rep4 315913 4370 1862 Reversible cysteine O-PTM_Day7_Rep1 312953 7326 2797 Reversible cysteine O-PTM_Day7_Rep2 238772 3392 1568 Reversible cysteine O-PTM_Day7_Rep3 278035 2659 1346 Reversible cysteine O-PTM_Day7_Rep4 235911 1831 1280
24
Experimental Group # Spectra for Identification # Spectra for Quantification # Unique Peptide Identified
Reversible cysteine O-PTM_Day10_Rep1 177615 3464 1588 Reversible cysteine O-PTM_Day10_Rep2 336361 5053 1733 Reversible cysteine O-PTM_Day10_Rep3 273030 2453 1332 Reversible cysteine O-PTM_Day10_Rep4 252848 3052 1730 Reversible cysteine O-PTM_Day14_Rep1 179144 3327 1584 Reversible cysteine O-PTM_Day14_Rep2 339793 6088 2007 Reversible cysteine O-PTM_Day14_Rep3 261463 2254 1136 Reversible cysteine O-PTM_Day14_Rep4 238437 3850 2067
Table 2.1. Summary information of raw file contents and statistics for all experimental groups.
2.III.E. Data Analysis.
Cubic spline-based temporal clustering. Mal-biotin labeled cysteine sites or total cysteine sites with abundance values represented in at least 4 out of 6 time points in both ISO and Vehicle groups were selected for cubic spline-based temporal clustering. The averaged ratio of abundance in ISO to Vehicle across replicates was calculated per site. Missing abundance values for a modification site were imputed using average abundance of remaining time-points. After scaling and centering, cubic splines were fitted to ratios across the time points in the R statistical programming language (v3.4.3). The predicted abundance ratios from cubic spline were used for K-mean clustering (kmean package in R) following identification of the cluster numbers (mclust package in R). All the codes used for the analyses were deposited to the Github public repository (https://github.com/UCLA-BD2K/Cubic-Spline-based-Temporal-Analysis-Workflow). The statistical significance of abundance change in ISO and Vehicle conditions was evaluated by a paired two-sided t-test. Pearson correlation was performed to analyze the association between phenotype and abundance of Mal-biotin labeled cysteines.
Functional annotations. Cellular pathway information was retrieved from Reactome (release v63, 2017_12) (https://reactome.org/) (Fabregat et al. 2018). To exclude single entity function
25
and non-specific/generalized pathway terms (e.g. metabolism), enriched pathways are required to house a minimum 2 found entities and a maximum of 200 total entities. Significantly enriched pathways are defined by FDR <0.05 calculated from Fisher’s exact test with FDR multiple test correction. NeXtProt (release 2018-02) was implemented to annotate the biological processes and disease association of key proteins identified in the analysis (Gaudet et al. 2017).
26
Figure 2.1. Quantitative cysteine O-PTM proteomics workflow. Left ventricular tissue samples originated from C57BL/6J were subjected to ISO (Hypertrophy) conditions or saline vehicle (Normal) for 1, 3, 5, 7, 10, and 14 days, with n = 3 mice per group. Extracted proteins underwent biotin switch for reversible cysteine O-PTM labeling. First, free cysteines in the cell lysate were alkylated with NEM to prevent nonspecific labeling of reversible cysteine O-PTM. Subsequently, reversibly oxidized cysteine were reduced with DTT. At this point, 10% of the lysate was separated out for the quantification of total cysteine site abundance and DTT-irreversible cysteine O-PTMs (i.e., CysSO2H and CysSO3H) (right side of flowchart). The remaining 90% (left side of flowchart) was treated with Mal-Biotin, which labels newly-reduced, free cysteine residues. Following trypsin digestion and IAM alkylation of newly exposed free cysteines, lysates from Normal and Hypertrophy groups were differentially labeled with medium/light dimethyl in two of the four technical replicates, whereas the other two received reciprocol labeling. The dimethyl-labeled peptides were quenched by ammonium and equally mixed. The Mal-Biotin labeled portion was enriched by avidin agarose and the abundance of reversible cysteine O-PTM was quantified by MS/MS. Following differential dimethyl labeling, the unlabeled 10% (right side) underwent LC-MS/MS to quantify the abundance of total cysteines and DTT-irreversible cysteine O-PTM. The identification of modified peptides is based on their mass changes by corresponding modifications, i.e., +451.1889 Da for reversible cysteine O-PTM, +31.9898 Da for CysSO2H, and +47.9847 Da for CysSO3H. Quantification of modifications is based on XIC values. Integrative analysis was performed to characterize the impact of ISO-induced cardiac hypertrophy on the cysteine O-PTM profile. Abbreviations: oxidative post-translational modification (O-PTM); isoproterenol (ISO); N-ethylmaleimide (NEM); dithiothreitol (DTT); cystein sulfinylation (CysSO2H); cystein sulfonylation (CysSO3H); maleimide biotin (Mal-Biotin); extracted ion chromatogram (XIC); iodoacetamide (IAM).
2.IV. Results.
2.IV.A. Overview.
We developed a cysteine O-PTM discovery platform by integrating a biotin switch-based quantitative proteomics approach with advanced computational analysis, and we applied the novel platform on an ISO-induced cardiac hypertrophic mouse model. First, we defined the abundance distribution of three types of cysteine O-PTM, including reversible CysSO2H, and CysSO3H during the progression of hypertrophy. Secondly, we applied statistical analysis to identify key proteins with significantly increased or decreased cysteine O-PTM abundance, followed by cubic spline-based K-mean clustering to dissect the temporal profiles of cysteine O-PTM together with their total cysteine abundance. Thirdly, temporal signatures along with their enriched hypertrophic pathways were identified. And finally, we established the association between cysteine O-PTM profiles and hypertrophic phenotypes, keying in on cysteine sites that were significantly correlated with the phenotype dynamics. Integrated analysis of key sites extracted from our computational approaches was performed to comprehensively identify
27
molecular signatures and provide mechanistic insights during the development of cardiac hypertrophy.
2.IV.B. Impact of ISO-induced hypertrophy on cysteine O-PTM.
Using our cysteine O-PTM discovery pipeline on mouse LV tissue from ISO and Vehicle groups (Figure 2.1.), we identified a total of 2,505 proteins containing 6,818 cysteine sites; with 1,655 proteins containing 3,324 sites modified by at least one of three cysteine O-PTM types. Specifically, 1,095 proteins containing 2,162 sites, 484 proteins containing 671 sites, and 447 proteins containing 613 sites were modified by reversible modification, CysSO2H, and CysSO3H, respectively. According to Uniprot, among the reversibly modified proteins and cysteine sites only 167 proteins containing 470 sites and 8 proteins containing 9 sites are known sites of disulfide-bonds and nitrosylation, respectively, revealing that the majority of identified cysteine sites are novel. Figure 2.2.A illustrates the overall change in abundance distribution of reversible cysteine O-PTM over the progression of hypertrophy, with the average abundance of reversible cysteine O-PTM sites across 4 technical replicates plotted for each time point. All histograms exhibit a J-shaped curve, demonstrating the higher frequency of modified cysteine sites concentrated in the low abundance XIC range. Notably, the distribution of O-PTM abundance in ISO demonstrates a sizeable reduction in the lower abundance range, indicating a global enrichment of O-PTM occurring as early as Day 3. Figure 2.2.B shows a Venn diagram to depict the number of proteins associated with each individual type of cysteine modification. To summarize, 1,057 sites within 377 proteins are unique to an enriched reversible O-PTM proteome, demonstrating the advantage of using enrichment to concentrate less abundant but highly oxidized proteins. The overlapping cysteine sites among three modification types are limited (5 sites), suggesting that this arrangement of cysteine O-PTM is highly site-specific. Comparatively, the numbers of proteins co-modified with all three modification types on separate residues are significantly higher, suggesting that diverse cysteine O-PTM patterns
28
occur on the same protein albeit in a site-specific manner. Overall, these data indicate that the oxidative regulation of proteins requires complex orchestration of myriad oxidative chemistries in a site-specific manner.
Accession Cysteine Change Fold P Value Signature Oxidation Type Name Entry Name Gene Protein Name Molecular Weight
A2ASQ1 A2ASQ1 _C441 0.842 0.026 Decreased Reversible Modification Reversible cysteine O-PTM AGRIN_ MOUSE Agrn Agrin
Agrin [Cleaved into: Agrin N-terminal 110 kDa subunit; Agrin C-terminal 110 kDa subunit; Agrin C-terminal 90 kDa fragment (C90); Agrin C-terminal
22 kDa fragment (C22)] 207,539 A2AX52 A2AX52_ C211 0.759 0.028 Decreased Reversible Modification Reversible cysteine O-PTM CO6A4_ MOUSE Col6a4
Dvwa Collagen alpha-4(VI) chain 250,798
B2RXS4 B2RXS4 _C617 0.914 0.04 Decreased Reversible Modification Reversible cysteine O-PTM PLXB2_ MOUSE Plxnb2 Plexin-B2 206,230 O08528 O08528_ C368 0.715 0.029 Decreased Reversible Modification Reversible cysteine O-PTM HXK2_M OUSE Hk2 Hexokinase-2 (EC 2.7.1.1)
(Hexokinase type II) (HK II) 102,535
O08796 O08796_ C145 0.876 0 Decreased Reversible Modification Reversible cysteine O-PTM EF2K_M OUSE Eef2k
Eukaryotic elongation factor 2 kinase (eEF-2 kinase) (eEF-2K) (EC 2.7.11.20) (Calcium/calmodulin-dependent eukaryotic elongation
factor 2 kinase) 81,739 O35459 O35459_ C91 0.921 0.011 Decreased Reversible Modification Reversible cysteine O-PTM ECH1_M OUSE Ech1 Delta(3,5)-Delta(2,4)-dienoyl-CoA
isomerase, mitochondrial (EC 5.3.3.-) 36,118
O35855 O35855_ C148 0.805 0.004 Decreased Reversible Modification Reversible cysteine O-PTM BCAT2_ MOUSE Bcat2 Bcatm Eca40 Branched-chain-amino-acid aminotransferase, mitochondrial (BCAT(m)) (EC 2.6.1.42) 44,127 O55143 O55143_ C349 0.924 0.031 Decreased Reversible Modification Reversible cysteine O-PTM AT2A2_ MOUSE Atp2a2 Sarcoplasmic/endoplasmic reticulum