5
Stress-Strain
Material Laws
TABLE OF CONTENTS
Page
§5.1 Introduction . . . 5–3
§5.2 Constitutive Equations . . . 5–3
§5.2.1 Material Behavior Assumptions . . . 5–3 §5.2.2 The Tension Test Revisited . . . 5–3 §5.3 Characterizing a Linearly Elastic Isotropic Material . . . 5–5 §5.3.1 Determination Of Elastic Modulus and Poisson’s Ratio . . . 5–5 §5.3.2 Determination Of Shear Modulus . . . 5–5 §5.3.3 Determination Of Thermal Expansion Coefficient . . . 5–5
§5.4 Hooke’s Law in 1D . . . 5–6
§5.4.1 Elastic Modulus And Poisson’s Ratio In 1D Stress State . . . 5–6 §5.4.2 Shear Modulus In 1D Stress State . . . 5–6 §5.4.3 Thermal Strains In 1D Stress State . . . 5–8
§5.5 Generalized Hooke’s Law in 3D . . . 5–9
§5.5.1 Strain-To-Stress Relations . . . 5–9 §5.5.2 Stress-To-Strain Relations . . . 5–10 §5.5.3 Thermal Effects in 3D . . . 5–11
§5.6 Generalized Hooke’s Law in 2D . . . 5–12
§5.6.1 Plane Stress . . . 5–12 §5.6.2 Plane Strain . . . 5–13
§5.7 Example: An Inflating Balloon . . . 5–14
§5.7.1 Strains and Stresses in Balloon Wall . . . 5–14 §5.7.2 When Will the Balloon Burst? . . . 5–15
§5.2 CONSTITUTIVE EQUATIONS §
5.1. Introduction
Recall from the previous Lecture the following connections between various quantities that appear in continuum structural mechanics:
internal forces⇒ stresses MP⇒ strains ⇒ displacements⇒size & shape changes (5.1)
displacements ⇒ strains MP⇒ stresses ⇒ internal forces (5.2) Of these, we have studied mechanical stresses in Lecture 1 and strains in Lecture 4. How are they linked? Through the material properties of the structural body. This is pictured by the ‘MP’ symbol above the appropriate arrow connectors. Material behavior is mathematically characterized by the so-called constitutive equations, also called material laws.
§
5.2. Constitutive Equations
In this Lecture we will restrict detailed examination of constitutive behavior to elastic isotropic materials. More complex behavior (for example: orthotropy, plasticity, viscoelasticity, and fracture) are studied in senior and graduate level courses in Structural and Solid mechanics.
§5.2.1. Material Behavior Assumptions
There is a very wide range of materials used for structures, with drastically different behavior. In addition the same material can go through different response regimes: elastic, plastic, viscoelastic, cracking and localization, fracture. As noted above, we will restrict our attention to a very specific material class and response regime by making the following behavioral assumptions.
1. Macroscopic Model. The material is mathematically modeled as a continuum body. Features
at the meso, micro and nano levels: crystal grains, molecules, and atoms, are ignored.
2. Elasticity. This means the stress-strain response is reversible and consequently the material
has a preferred natural state. This state is assumed to be taken in the absence of loads at a
reference temperature. By convention we will say that the material is then unstressed and undeformed. On applying loads, and possibly temperature changes, the material develops
nonzero stresses and strains, and moves to occupy a deformed configuration.
3. Linearity. The relationship between strains and stresses is linear. Doubling stresses doubles
strains, and viceversa.
4. Isotropy. The properties of the material are independent of direction. This is a good assumption
for materials such as metals, concrete, plastics, etc. It is not adequate for heterogenous mixtures such as composites or reinforced concrete, which are anisotropic by nature. The substantial complications introduced by anisotropic behavior justifies its exclusion from an introductory treatment.
5. Small Strains. Deformations are considered so small that changes of geometry are neglected
as the loads are applied. Violation of this assumption requires the introduction of nonlinear relations between displacements and strains. This is necessary for highly deformable materials such as rubber (more generally, polymers). Inclusion of nonlinear behavior significantly complicates the constitutive equations and is therefore left for advanced courses.
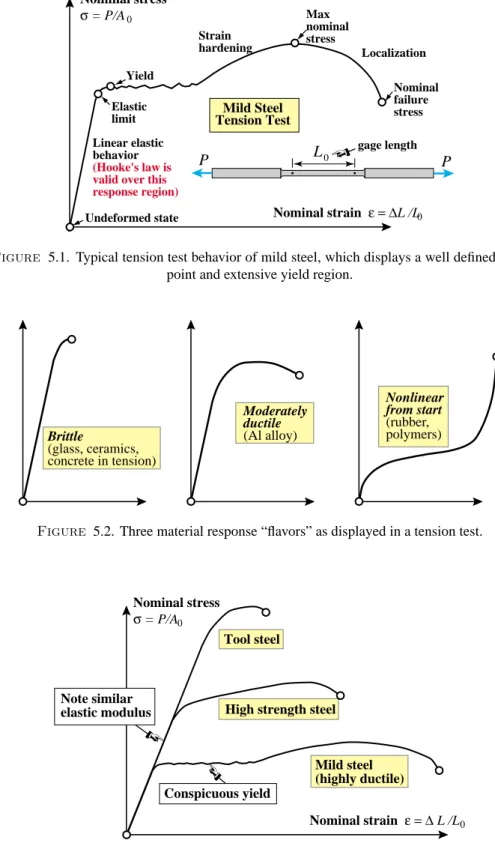
Nominal stress σ = P/A0 0 Yield Linear elastic behavior (Hooke's law is valid over this response region) Strain hardening Max nominal stress Nominal failure stress Localization Mild Steel Tension Test Nominal strain ε = ∆L /L Elastic limit Undeformed state L0 P P gage length
Figure 5.1. Typical tension test behavior of mild steel, which displays a well defined yield point and extensive yield region.
Brittle (glass, ceramics, concrete in tension) Moderately ductile (Al alloy) Nonlinear from start (rubber, polymers)
Figure 5.2. Three material response “flavors” as displayed in a tension test.
Nominal stress
σ = P/A0
0
Mild steel (highly ductile) High strength steel
Nominal strain ε = ∆ L /L Tool steel
Conspicuous yield Note similar
elastic modulus
Figure 5.3. Different steel grades have approximately the same elastic modulus, but very different post-elastic behavior.
§5.3 CHARACTERIZING A LINEARLY ELASTIC ISOTROPIC MATERIAL §5.2.2. The Tension Test Revisited
The first acquaintance of an engineering student with lab-controlled material behavior is usually through tension tests carried out during the first Mechanics, Statics and Structures sophomore course. Test results are usually displayed as axial nominal strain versus axial nominal strain, as illustrated in Figure 5.1 for a mild steel specimen taken up to failure. Several response regions are indicated there: linearly elastic, yield, strain hardening, localization and failure. These are discussed in the aforementioned course, and studied further in courses on Aerospace Materials. It is sufficient to note here that we shall be mostly concerned with the linearly elastic region that occurs before yield. In that region the one-dimensional (1D) Hooke’s law is assumed to hold. Material behavior may depart significantly from that shown in Figure 5.1. Three distinct flavors: brittle, moderately ductile and nonlinear-from-start, are shown schematically in Figure 5.2 . Brittle materials such as glass, rock, ceramics, concrete-under-tension, etc., exhibit primarily linear be-havior up to near failure by fracture. Metallic alloys used in aerospace, such as Aluminum and Titanium alloys, display moderately ductile behavior, without a well defined yield point and yield region: the stress-strain curve gradually turns down finally dropping to failure. Some materials, such as rubbers and polymers, exhibit strong nonlinear behavior from the start. Although such materials may be elastic there is no easily identifiable linearly elastic region.
Even for a well known material such as steel, the tension test behavior can vary significantly depending on combination with other components. Figure 5.3 sketches the response of mild steel with high-strength steel used in critical structural components, and with tool steel. Mild steel is highly ductile and clearly exhibits an extensive yield region. Hi-strength steel is less ductile and does not show a well defined yield point. Tool steel has little ductility, and its behavior displays features associated with brittle materials. The trade off between ductility and strength is typical. Note, however, that all three grades of steel have approximately the same elastic modulus, which is the slope of the stress-strain line in the linear region of the tension test.
§
5.3. Characterizing a Linearly Elastic Isotropic Material
For an isotropic material in the linearly elastic region of its response, four numerical properties are sufficient to establish constitutive equations. Those equations are associated with the well known Hooke’s law, originally enunciated by Robert Hooke by 1660 for a spring, and later expressed in terms of stresses and strains once those concepts appeared in the XIX Century. These four properties: E,ν, G andα, are tabulated in Figure 5.4.
§5.3.1. Determination Of Elastic Modulus and Poisson’s Ratio
The experimental determination of the elastic modulus E and Poisson’s ratio ν makes use of a uniaxial tension test specimen such as the one pictured in Figure 5.5. See slides for operational details.
§5.3.2. Determination Of Shear Modulus
The experimental determination of the shear modulus G makes use of a torsion test specimen such as the one pictured in Figure 5.6. See slides for operational details.
E Elastic modulus, a.k.a. Young's modulus
Physical dimension: stress=force/area (e.g. ksi)
ν Poisson's ratio
Physical dimension: dimensionless (just a number) G Shear modulus, a.k.a. modulus of rigidity
Physical dimension: stress=force/area (e.g. MPa)
α Coefficient of thermal expansion
Physical dimension: 1/degree (e.g., 1/ C)
E, ν andG are not independent. They are linked by E = 2G (1+ν), G = E/(2(1+ν)), ν= E /(2G)−1
Figure 5.4. Four properties that fully characterize the thermomechanical response of an isotropic material in the linearly elastic range.
§5.3.3. Determination Of Thermal Expansion Coefficient
The experimental determination of the thermal expansion coefficient α can be made byt using a uniaxial tension test specimen such as the one pictured in Figure 5.7. See slides for operational details.
§
5.4. Hooke’s Law in 1D
Once the values of E ,ν, G andαare experimentally determined (for widely used structural materials they can be simply read off a manual), they can be used to construct thermoelastic constitutive equations that link stresses and strains as described in the following subsections.
§5.4.1. Elastic Modulus And Poisson’s Ratio In 1D Stress State
The one-dimensional Hooke’s law relates 1D normal stress to 1D extensional strain through two material parameters introduced previously: the modulus of elasticity E, also called Young’s modulus and Poisson’s ratioν. The modulus of elasticity connects axial stressσ to axial strain:
σ = E, E = σ
, = σ
E. (5.3)
Poisson’s ratioν is defined as ratio of lateral strain to axial strain:
ν =lateral strain
axial strain
= −lateral strain
axial strain . (5.4) The −sign is introduced for convenience so that ν comes out positive. For structural materials
ν lies in the range 0.0 ≤ ν < 0.5. For most metals ν ≈ 0.25–0.35. For concrete and ceramics,
ν ≈0.10. For corkν ≈0. For rubber,ν ≈0.5 to 3 places. A material for whichν =0.5 is called
§5.4 HOOKE’S LAW IN 1D
P P
P
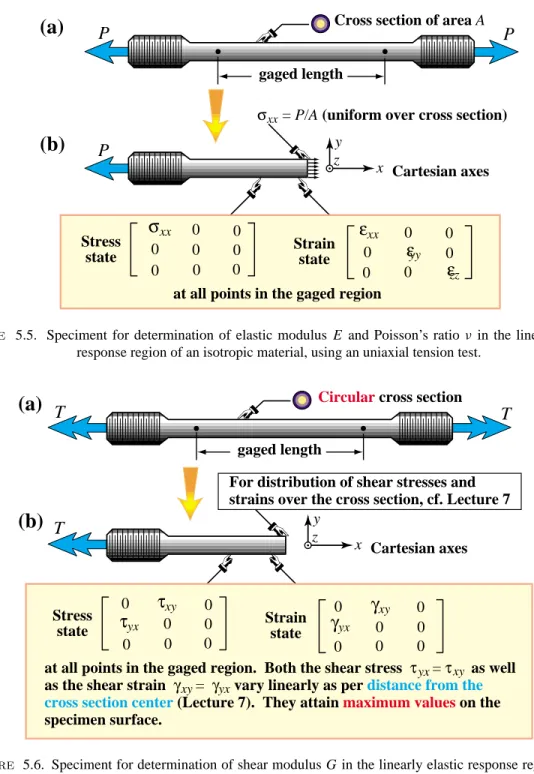
σ xx = P/A (uniform over cross section)
(b)
(a)
εxx εyy εzz 0 0 0 0 0 0 Strain state σxx 0 0 0 0 0 0 0 0 Stress stateat all points in the gaged region
y z
x Cartesian axes
Cross section of area A
gaged length
Figure 5.5. Speciment for determination of elastic modulus E and Poisson’s ratioνin the linearly elastic response region of an isotropic material, using an uniaxial tension test.
T T
T
Circular cross section
(b)
(a)
0 0 0 0 0 0 0 Strain state τxy xy γxy xy τyx yx γyx yx 0 0 0 0 0 0 0 Stress stateat all points in the gaged region. Both the shear stress τ = τ as well as the shear strain γ = γ vary linearly as per distance from the
cross section center (Lecture 7). They attain maximum values on the specimen surface.
y z
x Cartesian axes
gaged length
For distribution of shear stresses and strains over the cross section, cf. Lecture 7
Figure 5.6. Speciment for determination of shear modulus G in the linearly elastic response region of an isotropic material, using a torsion test.
§5.4.2. Shear Modulus In 1D Stress State
The shear modulus G connects a shear strainγ to the corresponding shear stressτ:
τ =Gγ, G = τ
γ, γ = τ
G. (5.5)
“Corresponding” means that if γ = γx y, say, then τ = τx y, and similarly for the other shear components. The shear modulus is usually obtained from a torsion test. It turns out that the
gaged length
x
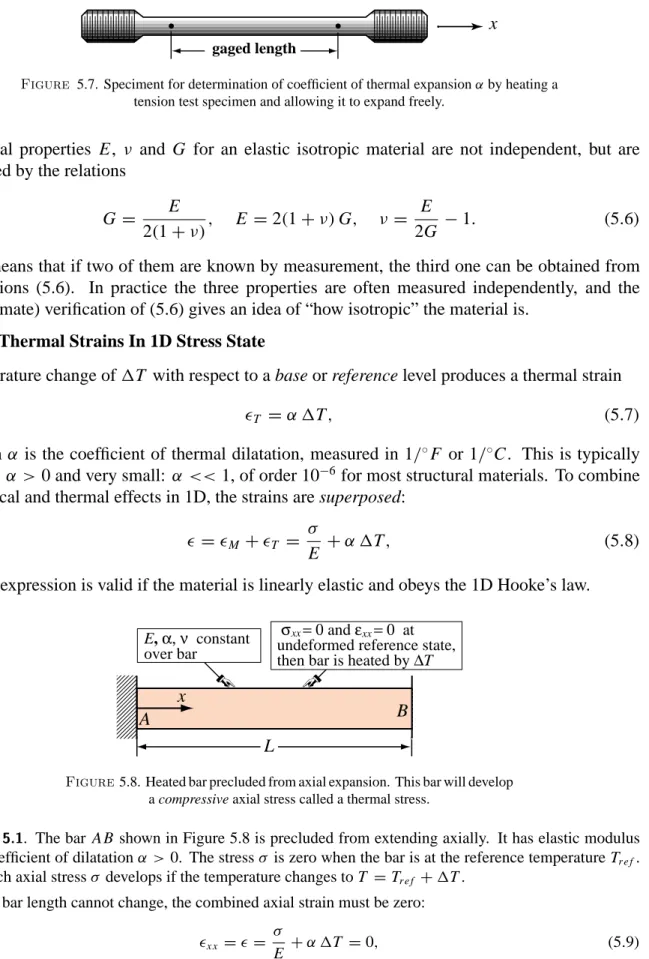
Figure 5.7. Speciment for determination of coefficient of thermal expansionαby heating a tension test specimen and allowing it to expand freely.
3 material properties E , ν and G for an elastic isotropic material are not independent, but are connected by the relations
G = E
2(1+ν), E =2(1+ν)G, ν =
E
2G −1. (5.6) which means that if two of them are known by measurement, the third one can be obtained from the relations (5.6). In practice the three properties are often measured independently, and the (approximate) verification of (5.6) gives an idea of “how isotropic” the material is.
§5.4.3. Thermal Strains In 1D Stress State
A temperature change ofT with respect to a base or reference level produces a thermal strain
T =α T, (5.7)
in whichα is the coefficient of thermal dilatation, measured in 1/◦F or 1/◦C. This is typically
positive: α >0 and very small: α <<1, of order 10−6 for most structural materials. To combine mechanical and thermal effects in 1D, the strains are superposed:
=M +T =
σ
E +α T, (5.8)
The last expression is valid if the material is linearly elastic and obeys the 1D Hooke’s law.
; ; ; x A B L ;; ;; ;; xx E, α, ν constant over bar σ = 0 and ε = 0 at undeformed reference state, then bar is heated by ∆T
xx xx
Figure5.8. Heated bar precluded from axial expansion. This bar will develop a compressive axial stress called a thermal stress.
Example 5.1. The bar A B shown in Figure 5.8 is precluded from extending axially. It has elastic modulus E and coefficient of dilatationα >0. The stressσ is zero when the bar is at the reference temperature Tr e f. Find which axial stressσ develops if the temperature changes to T =Tr e f +T .
Since the bar length cannot change, the combined axial strain must be zero: x x ==
σ
§5.5 GENERALIZED HOOKE’S LAW IN 3D (a) a b c σxx σxx σyy σyy σzz σzz Initial shape y x z (c) b a c Final shape after test (2) Final shape
after test (1) Final shapeafter test (3)
(b) a b c (d) a b c
Figure 5.9. Derivation of three-dimensional Generalized Hooke’s Law for normal stresses and strains. Three tension tests are assumed to be carried out along{x,y,z}, respectively, and strains superposed.
Solving forσ gives
σ = −Eα T. (5.10)
Since E andαare positive, a rise in temperature, i.e.,T >0, will produce a negative axial stress, and the bar will be in compression. This is an example of the so-called thermally induced stress or simply thermal stress. It is the reason behind the use of expansion joints in pavements, rails and bridges. The effect is important in orbiting vehicles such as satellites, which undergo extreme (and cyclical) temperature changes from full sun to Earth shade.
§
5.5. Generalized Hooke’s Law in 3D
§5.5.1. Strain-To-Stress Relations
We now generalize the foregoing equations to the three-dimensional case, still assuming that the material is elastic and isotropic. Condider a cube of material aligned with the axes {x,y,z}, as shown in Figure 5.9. Imagine that three“tension tests”, labeled (1), (2) and (3) respectively, are conducted along x, y and z, respectively. Pulling the material by applyingσx xalong x will produce normal strains (1) x x = σx x E , (1) yy = − ν σx x E , (1) zz = − ν σx x E . (5.11)
Next, pull the material byσyy along y to get the strains
(2) yy = σyy E , (2) x x = − ν σyy E , (2) zz = − ν σyy E . (5.12)
Finally pull the material byσzzalong z to get
(3) zz = σzz E , (3) x x = − ν σzz E , (3) yy = − ν σzz E . (5.13)
In the general case the cube is subjected to combined normal stressesσx x, σyy andσzz. Since we assumed that the material is linearly elastic, the combined strains can be obtained by superposition of the foregoing results:
x x =x x(1)+( 2) x x +( 3) x x = σx x E − ν σyy E − ν σzz E = 1 E σx x−ν σyy −ν σzz . yy =(yy1)+( 2) yy +( 3) yy = − ν σx x E + σyy E − ν σzz E = 1 E −ν σx x +σyy −ν σzz . zz =zz(1)+( 2) zz +( 3) zz = − ν σx x E − ν σyy E + σzz E = 1 E −ν σx x −ν σyy+σzz . (5.14)
The shear strains and stresses are connected by the shear modulus as
γx y =γyx = τx y G = τyx G , γyz =γzy = τyz G = τzy G , γzx =γx z = τzx G = τx z G . (5.15)
The three equations in (5.14), plus the three in (5.15), may be collectively expressed in matrix form as x x yy zz γx y γyz γzx = 1 E −Eν −Eν 0 0 0 −Eν 1 E −Eν 0 0 0 −Eν −Eν E1 0 0 0 0 0 0 1 G 0 0 0 0 0 0 1 G 0 0 0 0 0 0 1 G σx x σyy σzz τx y τyz τzx . ( 5.16) §5.5.2. Stress-To-Strain Relations
To get stresses if the strains are given, the most expedient method is to invert the matrix equation (5.16). This gives σx x σyy σzz τx y τyz τzx = ˆ E(1−ν) Eˆν Eˆν 0 0 0 ˆ Eν Eˆ(1−ν) Eˆν 0 0 0 ˆ Eν Eˆν Eˆ(1−ν) 0 0 0 0 0 0 G 0 0 0 0 0 0 G 0 0 0 0 0 0 G x x yy zz γx y γyz γzx . ( 5.17)
Here E is an “effective” modulus modified by Poisson’s ratio:ˆ ˆ
E = E
(1−2ν)(1+ν) (5.18) The six relations in (5.17) written out in long form are
σx x = E (1−2ν)(1+ν) (1−ν) x x +ν yy +ν zz , σyy = E (1−2ν)(1+ν) ν x x+(1−ν) yy +ν zz , σzz = E (1−2ν)(1+ν) ν x x+ν yy+(1−ν) zz , τx y = Gγx y, τyz = Gγyz, τzx =Gγzx. (5.19)
§5.5 GENERALIZED HOOKE’S LAW IN 3D The combination
σav = 13(σx x +σyy +σzz) (5.20)
is called the mean stress, or average stress. The negative ofσav is the pressure: p= −σav.
The combinationv = x x +yy +zz is called the volumetric strain, or dilatation. The negative of v is known as the condensation. Both pressure and volumetric strain are invariants, that is, their value does not change if axes{x,y,z}are rotated. An important relation between pressure and volumetric strain can be obtained by adding the first three equations in (5.19), which upon simplification and accounting for (5.20) and p = −σav relates pressure and volumetric strain as
p = − E
3(1−2ν)v = −K v. (5.21) This coefficient K is called the bulk modulus. If Poisson’s ratio approaches 12, which happens for near incompressible materials, K → ∞.
Remark 5.1. In the solid mechanics literature p is also defined (depending on author’s preferences) as p = σav = 13(σx x +σyy +σzz), which is the negative of the above one. If so, p = +Kv. The definition
p= −σav is the most common one in fluid mechanics.
§5.5.3. Thermal Effects in 3D
To incorporate the effect of a temperature changeT with respect to a base or reference temperature,
addα T to the three normal strains in (5.14) x x = 1 E σx x−ν σyy −ν σzz +α T, yy = 1 E −ν σx x +σyy −ν σzz +α T, zz = 1 E −ν σx x −ν σyy +σzz +α T. (5.22)
No change in the shear strain-stress relation is needed because if the material is linearly elastic and isotropic, a temperature change only produces normal strains. The stress-to-strain matrix relation (5.16) expands to x x yy zz γx y γyz γzx = 1 E −Eν −Eν 0 0 0 −Eν 1 E −Eν 0 0 0 −Eν −Eν 1 E 0 0 0 0 0 0 1 G 0 0 0 0 0 0 1 G 0 0 0 0 0 0 1 G σx x σyy σzz τx y τyz τzx +α T 1 1 1 0 0 0 . ( 5.23)
Inverting this relation provides the stress-strain relations that account for a temperature change: σx x σyy σzz τx y τyz τzx = ˆ E(1−ν) Eˆν Eˆν 0 0 0 ˆ Eν Eˆ(1−ν) Eˆν 0 0 0 ˆ Eν Eˆν Eˆ (1−ν) 0 0 0 0 0 0 G 0 0 0 0 0 0 G 0 0 0 0 0 0 G x x yy zz γx y γyz γzx − Eα T 1−2ν 1 1 1 0 0 0 , (5.24) in which E is defined in (5.18). Note that if all mechanical normal strainsˆ x x,yy, andzzvanish, but T = 0, the normal stresses given by (5.24) are nonzero. Those are called initial thermal
stresses, and are important in engineering systems exposed to large temperature variations, such as
rails, turbine engines, satellites or reentry vehicles. §
5.6. Generalized Hooke’s Law in 2D
Two specializations of the foregoing 3D equations to two dimensions are of interest in the appli-cations: plane stress and plane strain. Plane stress is more important in Aerospace structures, which tend to be thin, so in this course more attention is given to that case. Both specializations are reviewed next.
§5.6.1. Plane Stress
In this case all stress components with a z component are assumed to vanish. For a linearly elastic isotropic material, the strain and stress matrices take on the form
x x γx y 0 γyx yy 0 0 0 zz , σ x x τx y 0 τyx σyy 0 0 0 0 (5.25) Note that the zz strain, often called the transverse strain or thickness strain in applications, in general will be nonzero because of Poisson’s ratio effect. The strain-stress equations are easily obtained by going to (5.14) and (5.15) and settingσzz =τyz =τzx =0. This gives
x x = 1 E σx x −ν σyy , yy = 1 E −ν σx x +σyy , zz = − ν E σx x +σyy , γx y = τx y G , γyz =γzx =0. (5.26) The matrix form, omitting known zero components, is
x x yy zz γx y = 1 E −Eν 0 −Eν 1 E 0 −Eν −Eν 0 0 0 G1 σ x x σyy τx y . (5.27)
Inverting the matrix composed by the first, second and fourth rows of the above relation gives the stress-strain equations σx x σyy τx y = E˜ E˜ ν 0 ˜ Eν E˜ 0 0 0 G x x yy γx y . (5.28)
§5.6 GENERALIZED HOOKE’S LAW IN 2D in which E˜ = E/(1−ν2). Written in long hand,
σx x = E 1−ν2(x x+ν yy), σyy = E 1−ν2(yy+ν x x), τx y =Gγx y. (5.29) §5.6.2. Plane Strain
In this case all strain components with a z component are assumed to vanish. For a linearly elastic isotropic material, the strain and stress matrices take on the form
x x γx y 0 γyx yy 0 0 0 0 , σ x x τx y 0 τyx σyy 0 0 0 σzz (5.30) Note that the σzz stress, which is called the transverse stress in applications, in general will not vanish. The strain-to-stress relations can be easily obtained by setting zz = γyz = γzx = 0 in (5.19). This gives σx x = E (1−2ν)(1+ν) (1−ν) x x+ν yy , σyy = E (1−2ν)(1+ν) ν x x +(1−ν) yy , σzz = E (1−2ν)(1+ν) ν x x +ν yy , τx y =Gγx y, τyz =0, τzx =0. (5.31)
which in matrix form, with the zero components removed, is σx x σyy σzz τx y = ˆ E(1−ν) Eˆ ν 0 ˆ Eν Eˆ (1−ν) 0 ˆ Eν Eˆ ν 0 0 0 G x x yy γx y . (5.32) Inverting the system provided by extracting the first, second and fourth rows of (5.32) gives the stress-to-strain relations, which are omitted for simplicity.
The effect of temperature changes can be incorporated in both plane stress and plane strain relations without any difficulty.
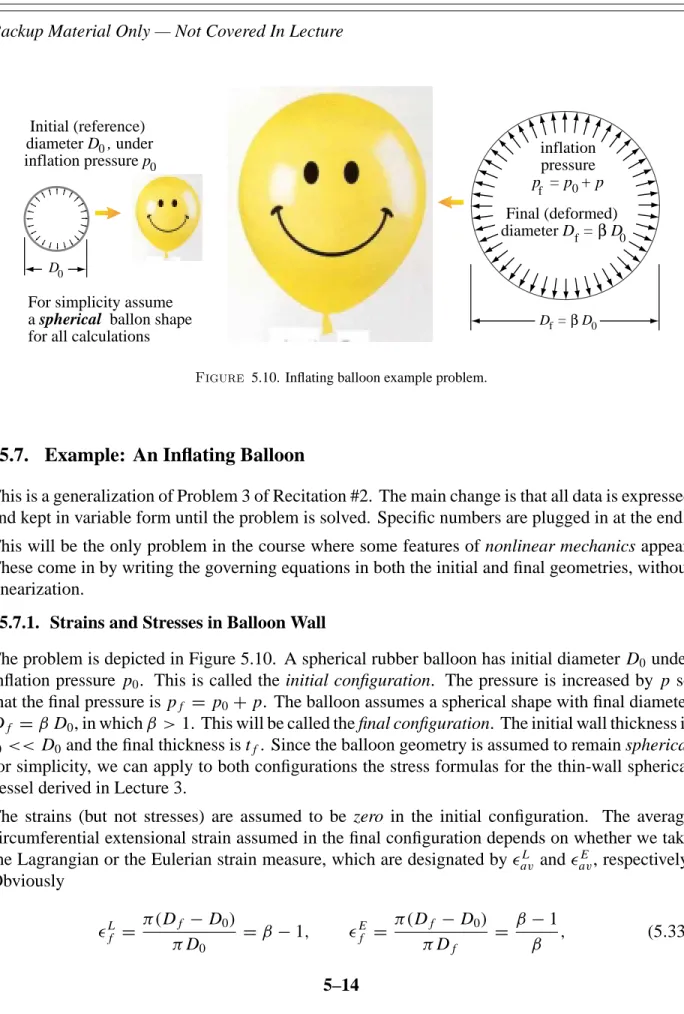
Backup Material Only — Not Covered In Lecture Initial (reference) diameter D , under inflation pressure p0 0 0 0 Final (deformed) diameter D = β D inflation pressure p = p + p
For simplicity assume a spherical ballon shape for all calculations
f f
D = f β D0
0
D
Figure 5.10. Inflating balloon example problem.
§
5.7. Example: An Inflating Balloon
This is a generalization of Problem 3 of Recitation #2. The main change is that all data is expressed and kept in variable form until the problem is solved. Specific numbers are plugged in at the end. This will be the only problem in the course where some features of nonlinear mechanics appear. These come in by writing the governing equations in both the initial and final geometries, without linearization.
§5.7.1. Strains and Stresses in Balloon Wall
The problem is depicted in Figure 5.10. A spherical rubber balloon has initial diameter D0 under
inflation pressure p0. This is called the initial configuration. The pressure is increased by p so
that the final pressure is pf = p0+ p. The balloon assumes a spherical shape with final diameter Df =β D0, in whichβ >1. This will be called the final configuration. The initial wall thickness is t0 << D0 and the final thickness is tf. Since the balloon geometry is assumed to remain spherical for simplicity, we can apply to both configurations the stress formulas for the thin-wall spherical vessel derived in Lecture 3.
The strains (but not stresses) are assumed to be zero in the initial configuration. The average circumferential extensional strain assumed in the final configuration depends on whether we take the Lagrangian or the Eulerian strain measure, which are designated byavL andavE, respectively. Obviously L f = π(Df − D0) πD0 =β−1, Ef = π(Df −D0) πDf = β−1 β , (5.33)
§5.7 EXAMPLE: AN INFLATING BALLOON Since the balloon is assumed to remain spherical and its thickness is very small compared to its diameter, the above strains hold at all points of the balloon wall, and are the same in any direction tangent to the sphere. If we choose the sphere normal as local z axis, the wall is in a plane stress state.
Next we introduce material laws. We will assume that rubber obeys the two-dimensional, plane stress generalized Hooke’s law (5.29) with respect to the Eulerian strain measure, with effective modulus of elasticity E and Poisson’s ratioν.1 Settingx x = yy = Ef andγx y = 0 therein and accounting for the initial stressσ0, we obtain the inplane normal stress in the final configuration:
σx x =σyy =σf =σ0+ E 1−ν2( E f +ν E f )=σ0+ E 1−ν E f =σ0+ E 1−ν β−1 β . (5.34)
The normal inplane wall stress is the same in all directions, so it is called simply σ0 andσf, for initial and final configurations, respectively. The inplane shear stressτ vanishes in all directions. Assume D0, t0, E andν are given as data. An interesting question: what is the relation between p
(the excess or gage pressure) and the diameter Df =βD0? And, is there a maximum pressure that
will cause the balloon to burst?
§5.7.2. When Will the Balloon Burst?
To relate p and β it is necessary to express the wall stressesσ0 andσf in terms of geometry and internal pressure. This is provided by equation (3.10) in Lecture 3, derived for a thin-wall spherical vessel. In that equation replace p, R and t by quantities in the initial and final configurations:
σ0 = p0 R0 2t0 = p0D0 4t0 , σf = pf Rf 2 tf = (p0 + p)Df 4 tf = (p0+ p) βD0 4 tf . (5.35) All quantities in the above expressions are known in terms of the data, except tf. A kinematic analysis beyond the scope of this course shows that
tf = 1+2ν 1 β2 −1 t0. (5.36)
We can check (5.36) by inserting two limit values of Poisson’s ratio:
ν =0: tf =t0. This is correct since the thickness does not change.
ν =1/2: tf = t0/β2. Is this correct? Ifν = 1/2 the material is incompressible and does not
change volume. The initial and final volume of the thin-wall spherical balloon are
V0 = πD20t0 and Vf = πD2f tf =πβ2 D20tf, respectively. On setting V0 = Vf and solving for tf we get tf =t0/β2.
To obtain p in terms of β, replace (5.36) into (5.35), equate this to (5.34) and solve for p. The result provided by Mathematica is
p= 4E t0(1−β)(2ν+β
2(1−2ν))+ D
0p0β(1−ν)(4ν+β2(2−β−4ν)) D0β4(1−ν)
(5.37)
1 This is a very rough approximation since constitutive equations for rubber (and polymers in general) are highly nonlinear.
1.5 2 1 2.5 3 3.5 4 1 0 2 3 4 5 6 7 β = D /D p (MPa) ν=1/2 ν=0 f 0
Figure 5.11. Inflating pressure (in MPa) versus diameter expansion ratio
β=Df/D0for a balloon with E =1900 MPa, D0=50 mm, p0 =0 MPa,
t0=0.18 mm, 1≤β≤4 and Poisson’s ratiosν=0 andν= 12.
This expression simplifies considerably in the two Poisson’s ratio limits:
p|ν=0 = 4E t0(β−1)+D0 p0(2−β) β D0β2 (5.38) p|ν=1/2 = 8E t0(β−1)+D0 p0(2−β 3) β D0β4 (5.39) Pressure versus diameter ratio curves given by (5.38) and (5.39) are plotted in Figure 5.11 for the numerical values indicated there. Those values correspond to the data used in Problem 3 of Recitation 2, in whichν =1/2 was specified from the start.
Rubber (and, in general, polymer materials) are nearly incompressible; for exampleν ≈0.4995 for rubber. Consequently, the response depicted in Figure 5.11 forν =1/2 is more physically relevant than the other one.
Do the response plots in Figure 5.11 tell you when an inflating balloon is about to collapse? Yes. This is the matter of a (optional) Homework Exercise.