This item was submitted to Loughborough’s Institutional Repository (https://dspace.lboro.ac.uk/) by the author and is made available under the
following Creative Commons Licence conditions.
For the full text of this licence, please go to:
A systems approach for modelling supply chain risks
Purpose- With increasing exposure to disruptions, it is vital for supply chains to manage risks proactively. Prediction of potential failure points and overall impact of these risks is challenging. In this paper, systems thinking concepts are applied for modelling supply chain risks. The aim of this research is to develop a holistic, systematic and quantitative risk assessment process for measuring the overall risk behaviour.
Design/methodology/approach- A framework for Supply Chain Risk Management
(SCRM) is developed and tested using an industrial case study. A systematically developed research design is employed to capture the dynamic behaviour of risks. Additionally, a system based supply chain risk model is conceptualized for risk modelling. Sensitivity modelling results are combined for validating the supply chain risk model.
Findings- The systems approach for modelling supply chain risks predicts the failure points along with their overall risk impact in the supply chain network. System based risk modelling provides a holistic picture of risk behavioural performance which is difficult to realise through other research methodologies commonly preferred in the SCRM research.
Practical implications- The developed framework for SCRM is tested in an industry setting for its viability. The framework for SCRM along with the supply chain risk model is expected to benefit practitioners in understanding the intricacies of supply chain risks. The system model for risk assessment is a working tool which could provide a perspective of future disruptive events.
Originality- A holistic, systematic and quantitative risk modelling mechanism for capturing overall behaviour of risks is a valuable contribution of this research. The paper presents a new perspective towards using systems thinking for modelling supply chain risks.
Keywords- Supply Chain Risk Management, Systems Thinking, Risk Modelling.
1. Introduction
Supply chain risk management focuses on developing new approaches for management of disruptions. The field of Supply Chain Risk Management (SCRM) has originated from the idea of Enterprise Risk Management (ERM), the paradigm for managing the portfolio of risks that threaten organisations (Gordon et al., 2009). It is a challenge to capture the multi-dimensional and inter-dependent behaviour of the risks. Raw material passes through various processes, geographic and political regions, changes ownerships and modes of transportation before reaching the end customers in the form of the finished product (Handfield and Ernest, 2002; Stecke and Kumar, 2009). All of these processes expose potential points where supply chains are vulnerable to disruptions. Modern supply chain trends such as globalization, decentralization, outsourcing and Just-In-Time are introduced to try and make supply chains efficient. However, this has led to an increase in the number of exposure points (Stecke and Kumar, 2009). In order to identify these failure points within the network, supply chain systems need a holistic perspective to understand and capture the complex network of interconnected nodes. Complexity within the supply chain system can be defined as a condition occurring due to the association of numerous inter-related and inter-dependent entities in the supply system using several process inter-connections. System oriented and holistic approaches to risk management are identified in the SCRM literature as important in complex, uncertain and volatile global environments (Harland et al., 2003; Oehmen et al., 2009; Tang and Nurmaya Musa, 2010). Systems thinking may provide a methodological and structured approach to risk management due to its ability to consider the systemic environments within the larger system. It is necessary to look at supply chain systems from a 'system of systems' perspective. Systems thinking supports in capturing the dynamic, complex and inter-dependent nature of the system (Sterman, 2000). This research intends to study the portfolio of supply chain risks through three distinctive phases as concept development, implementation and evaluation.
Empirically grounded research is needed for setting practicable managerial guidelines for supply chain risk related problems (Juttner et al., 2003). From the literature survey on SCRM, the qualitative research approach has been widely used with several empirical studies and conceptual models in early research. Various algorithm based quantitative modelling techniques (e.g. Towill, 2005; Nagurney et al.,
2005; Yang et al., 2005; Goh et al., 2007; Wagner and Neshat, 2010) have been effectively used in past to solve supply chain network disruption problems. Modern nature inspired evolutionary algorithms have been used more recently for solving large, dynamic and complex optimisation problems (Chiong, 2009). Different interdisciplinary theories like real options (e.g. Hult and Craighead, 2010), game theory (e.g. Xiao and Yang, 2008) and simulation (e.g. Wu and Olson, 2008; Kim et al., 2006) have shown some potential for managing supply chain disruptions. Several qualitative as well as quantitative research methods are utilised in the SCRM context. However, these important studies have either looked at risks across a dyad or one risk at a time. These studies do not provide a methodology of considering the influence of multiple risks on a supply system network, nor do they suggest a methodology for depicting risk propagation. The research reported in this paper provides practitioners as well as researchers an approach to consider multiple supply chain risks and to capture their behaviour over a period in supply chain network. The holistic risk management framework, systematic research design process and quantitative supply chain risk modelling brings together a unique capability for capturing the overall behavioural performance of risks. More recently the systems oriented approach has been identified to be promising for modelling complex and dynamic problems (Cheng and Kam, 2008; Oehmen et al., 2009; Tang and Nurmaya Musa, 2010; Sheffield et al., 2012). The research intends to add to the existing work in SCRM by developing a holistic, systematic and quantitative risk assessment approach for measuring the overall risk behaviour.
The paper is structured as follows: a brief literature review on SCRM within the context of ERM is discussed in the next section. Principles of systems thinking are utilized to build the framework for SCRM in section 3. Section 4 describes the research design implemented for the risk assessment process along with the data collection activity for the research. Risk attributes are modelled based on the supply chain risk model in section 5. System based risk modelling is attempted through statistical and simulation modelling and is based on the developed supply chain risk model. Section 6 draws important insights from the conducted risk assessment to investigate overall risk behaviour. Finally, the paper concludes with discussion on important research contributions for practitioners as well as researchers from operational as well as strategic perspective.
2. Literature review
SCRM is a crucial and fundamental element of ERM addressing the supply side, even though SCRM and ERM are often perceived as separate functions within the firm (Blome and Schoenherr, 2011). Supply chain risk management to a certain extent can be compared to project and/or enterprise risk management as both environments consist of several nodes of network interconnected and working together for a single objective. According to Kleindorfer and Saad (2005) historically, operations or disruption risk management has been included under Integrated ERM. Hence, the approach to modelling of risks is built on the principles of ERM and SCRM literature. “Enterprise risk management is defined as a process applied in terms of strategy setting across the enterprise, designed to identify and manage potential events that may affect the organisation to provide reasonable assurance
regarding the achievement of set objectives” (COSO, 2004). The aligning link
between ERM and SCRM processes has received very limited attention in the existing research (Blome and Schoenherr, 2011) but, the research on risk management has evolved into numerous distinctive fields like financial risk
management, healthcare risk management, project risk management, supply chain risk management, etc. (Harland et al., 2003; Handfield and McCormack, 2007).
Although supply chain risks are discussed significantly within SCRM literature, there is limited information on how to deal with them from a practical perspective on short-term as well as long-term basis (Blackhurst et al., 2005). The attention given to assessing supply chain risks is fairly limited (Rao and Goldsby, 2009). Researchers suggest that, an approach to risk management needs to follow a formal and structured process (Khan et al., 2008). Colicchia and Strozzi (2012) predict a need for a comprehensive and dynamic approach to supply chain risk management. Identifying risks is the first step in developing efficient risk management procedure. It is evident from a systematic literature review on SCRM that, qualitative as well as quantitative research methods are utilised for solving supply chain issues. Conceptual as well as empirical methods along with the case study based approach are found to be commonly used. Quantitative tools like mathematical modelling and simulation techniques have recently been used to understand the intricacies of the SCRM field. Systems thinking and system dynamics can be effectively used for holistically studying different risk issues within a supply chain network. Although
there are some instances of studying supply chain risks using the systems approach, in general we find that systems thinking based research approaches are largely unexplored for solving SCRM problems. Supply chains could be benefited by developing models that are able to model the risks from complex and dynamic networks (Stecke and Kumar, 2009). Identifying the points of failure by developing dynamic models to capture vulnerability in the supply chain would benefit researchers and practitioners for proactively mitigating the risks. Hence, a thorough investigation of supply chain risks for understanding their complex phenomenon is essential.
Risk management is increasingly becoming an integral part of a holistic SCM design (Christopher and Lee, 2004). Supply chain risk management follows a fairly traditional risk management process but is driven by the systemic interrelationships focussed at identifying and reducing risks not only at an organisation level but the entire supply chain. In general, SCRM consists of management processes such as identification, assessment, mitigation and control of risks (Hallikas et al., 2004). Risk classification and identification has been exhaustively discussed in the SCRM literature. Wold and Shriver (1997) define risk assessment as the process of analysing the vulnerability to threats and recommending solutions to reduce the level of risk to an organisation. The risk assessment process thus covers the most critical function of risk management. Chaudhuri et al. (2013) suggest that the assessment of supply chain risks should start during the new product development process due to the growing uncertainty in supply chains. Multidisciplinary approaches have been attempted for building models for supply chain risk analysis in the literature. Wu et al.
(2006) and Wang et al. (2012) use analytical hierarchy process to model supply chain risk assessment. Multi-stage influence diagram (Liu, 2009), Monte Carlo approach (Klibi and Martel, 2012), Interpretive structural modelling (Diabat et al., 2012), partial least square method (Kern et al., 2012) and several other methods from MS/OR (e.g. Bryson et al., 2002) have been utilised by academics to test models for supply chain risk assessment. Nevertheless, risk assessment in supply chains is bounded by operational and economic constraints for a detailed study (Pai
et al., 2003). According to a leading multinational consultancy service firm, the risk
assessment in industry setting is conducted based on previous experience and forward thinking analysis is a must for effective risk mitigation (PricewaterhouseCoopers, 2008). Moreover, supply chain risk behavioural
performance is inherently unpredictable and chaotic. Hence supply chain practitioners demand a vigorous risk assessment mechanism to protect organisations against unforeseen disruptive events. Proactive assessment and execution is a key consideration for robust SCRM (Sodhi and Tang, 2012). The research attempts to bridge the gap between theory and practice in using a systems perspective within supply chain risk management by developing a robust, systemic risk assessment methodology.
3. Framework for supply chain risk management
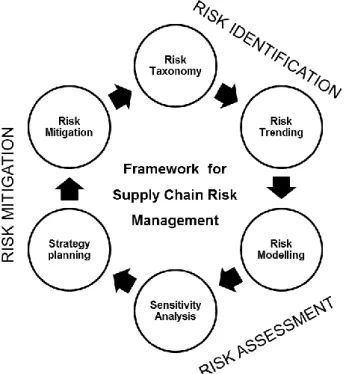
In this section, the conceptual framework for SCRM is developed using a systems perspective. The conceptual framework follows a standard risk management processes; risk identification, risk assessment and risk mitigation as seen in Figure 1. Although the processes may look similar to standard risk management, the difference lies in the approach to the problem and the research methodology implemented for the study.
The systematic development of the framework was achieved beginning with a standard risk management process. To capture the intricacies involved in each process, two stages were developed for each process during data experimentation. Each stage in the conceptual framework was improved through a continuous feedback loop system. Risk taxonomy is the first stage in the framework where the risks are identified and classified from the pool of risks. Risks trending, the second stage in the risk identification process is for predicting the operational boundaries of the risk variables. The risk assessment process is the major focus of our research and hence discussed exhaustively in this paper. A research design for assessing the dynamic behaviour of risks is developed. For risk modelling, a model is developed in order to capture the impact in terms of cost and time (delay) and the possible failure point due to disruption. Risk modelling and sensitivity analysis stages in the risk assessment process are attempted through quantitative modelling techniques to evaluate the overall performance of the risks. The risk mitigation process is classified into two stages as strategic planning and risk mitigation. Strong inferences drawn from risk trending, risk modelling and sensitivity analysis provides directions for the risk mitigation. New risk mitigation strategies identified from the study are utilized for future projects. The framework for SCRM forms a closed loop system for continuous improvement. The systematically developed framework for SCRM (Figure 1) is believed to capture the overall nature of risks through a structured study discussed in the later part of this research. All the activities described in the conceptual framework are structurally followed for modelling supply chain risks in section 5.
4. Research design
The research design implemented for the risk assessment is based on the application of systems thinking concepts. Sterman (2000, p4) defines systems thinking as “the ability to see the world as a complex system, in which we understand
that you can’t just do one thing and that ‘everything is connected to everything else”.
Luna-Reyes and Anderson (2003) define systems thinking as a modelling approach used for conceptualizing and analysing interdependencies of the system. Sterman (2000, p4) has suggested that when one is a part of a complex system, it is difficult to learn about it. System dynamics is thus a “method to enhance learning in complex
conceptualisation phase in system dynamics (Forrester, 1961). The systems thinking approach provides a structured development process from conceptualisation to the end of system life-cycle (Forrester, 1961; Forrester 1994; Sterman, 2000). Qualitative as well as quantitative data can be used for conceptualizing and modelling the system (Luna-Reyes and Anderson, 2003). Tools like simulation/system dynamics and different algorithm modelling have the potential to capture static as well as the dynamic behaviour of supply chains. Following the systems thinking approach, a step-by-step experimental research design for risk assessment is developed and implemented in this section.
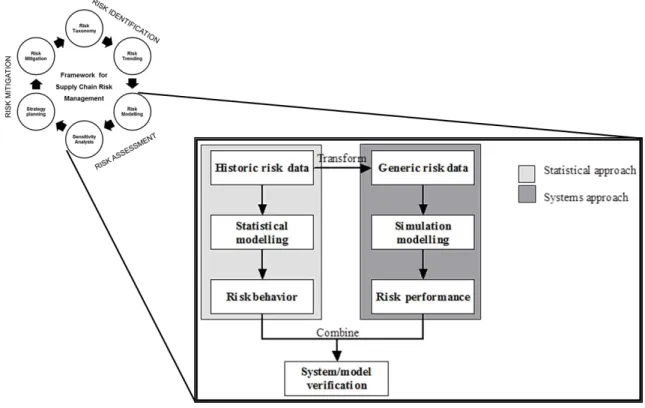
Figure 2 Research design: Modelling supply chain risks
The research design for modelling supply chain risks primarily focuses on the risk assessment process in the proposed framework for SCRM. Empirical research designs use statistical analysis, OR modelling and simulation techniques to draw the results (Luna-Reyes and Anderson, 2003). Figure 2 shows the developed research design for modelling supply chain risks. It implements two distinctive approaches for evaluating the complete risk behavioural performance. The left side is termed as ‘statistical approach’, for behavioural risk assessment and right side is termed as ‘systems approach’ for exploring the risk performance. Both modelling platforms run
parallel to each other during the risk assessment process and are later combined to extract comprehensive results.
A reputed Aerospace and Defence organisation in the UK was approached for modelling of the supply chain risks phenomenon. The organisation has its supply chain network spread across the world. The typical nature of supply chain activities for this organisation involves design, manufacture, delivery and after sales maintenance of the product. Several informal meetings were held with the organisation to discuss the identified research problem and to further understand the gap in modelling supply chain risks from an industry perspective. The discussions identified that for the case company there was a need to move from a traditional risk management to an enhanced risk management approach. The knowledge gap in relating SCRM theory to industry practice was another important concern raised by this collaborating organisation. By matching the research objectives, the collaborative project generated the ideal platform for participatory experimental research whilst working with the Risk Manager and System Engineers from the organisation. Qualitative as well as quantitative data was collated from different internal projects within the organisation. The project inherently was a product development environment representing a global supply chain network. The data collection for an experimental research can be in a wide variety of formats. This can be in the form of documents, reports, registers, spread sheets, audio/video recordings etc. The data for this research was in the form of risk documentation in the risk register. The quantitative risk register data was supported with qualitative data in the form of informal interviews and secondary data made available from company reports and internet sources. Initially the project risk data was thoroughly studied and transformed into a form required for the experimentation. The inputs from informal interviews with the Risk Managers were integrated to comprehend their understanding of possible risk impacts and severity of the events. The company reports helped in recording the events and their impact in terms of cost and delay over the running of the complete project. In order to comprehensively study the behaviour of the risks, the available data was screened by filtering confidential information associated with the collaborating organisation to form the historical risk data. In order to bridge the findings made from the qualitative and quantitative data sources, the Delphi method was used for arriving at a common consensus. The Delphi group, an extension of the focus group is found to be a commonly used
research method for data dissemination and learning. The Delphi method is used to obtain reliable consensus of opinion of group of experts with a controlled feedback system (McKenna, 1994). This structured technique is believed to work well when the objective is to improve the understanding of the problems and solutions (Skulmoski et al., 2007). Thus the data available in different (qualitative and quantitative) forms was transformed into ‘quantitative’ historical risk data for experimentation. This transformed risk data comprised of 30 risk events called ‘risk scenarios’ each having the description of event discussing type of risks observed and their probability, cost and delay changes over different stages/nodes in the project. The historical risk data was further transformed to form the generic risk data by sampling from the probability distributions. Historical risk data was analysed following a statistical approach and generic risk data was analysed using the System Dynamics (SD) modelling approach. Forrester advocated the use of computer simulation instead of mathematical models to learn about the systems modes of behaviour and design policies to improve system performance (Lane 1997, Vennix and Vennix, 1996). Richardson and Pugh III (1981) suggest that system dynamics considers that ‘feedback’ and ‘delay’ cause system behaviour and hence the system structure is very important to understand system behaviour. Forrester (1961) suggested using SD simulation models for test-piloting a new structural form for an organisation and to investigate systemic challenges to supply chain network. The reason for the two modelling approaches used in this paper was to test and validate statistical as well as empirical relationships between supply chain risks. Two distinct approaches were believed to facilitate critical insights through cross-comparison and combination of the results, difficult to comprehend individually. The SD simulation model for measuring overall risk performance is modelled using the simulation platform named Vensim®, which is a discrete event simulation software. The findings from the two different risk assessment approaches are collated and compared for drawing concluding results.
5. Modelling the supply chain risks
The experimental study with the collaborating organisation was conducted to test the viability of the framework in an industry environment. The collaborating organisation that provided us with the data also provided the opportunity for testing the developed
framework for SCRM. All stages from the framework are discussed systematically for predicting the overall behaviour of risks within supply chain network.
5.1. Risk taxonomy
Risk taxonomy can be defined as the method for facilitating the methodical and repeatable identification of risks associated with in a given system (Carr et al., 1993). This particular activity needs to be comprehensive as well as consistent for the best process output. The first stage of the framework for SCRM is to identify and classify the risks based on causal (relational) attributes. There exists several risk classifications in SCRM literature. Risk itself is termed as disruption, vulnerability, uncertainty, disaster, peril and hazard in SCRM literature (Ghadge et al., 2012). A commonly preferred risk classification is based on ‘sources of risk’ as organisational and network risks. Organisational risks are the risks that lie inside the organisational boundaries whereas, network related risks arises from interactions between organisation and other supply chain network partners (Juttner et al., 2003).
The literature of ERM and systems thinking brings the concept of 'system of systems' where the enterprise or a larger system like supply chain is considered from a strategic (macro) as well as an operational (micro) perspective. In order to achieve this, we classified the risks based on multi-dimensional causal relationships seen in Table I. This is not just limited to classifying the risks based on its risk sources but, also takes into account other important interdependent factors such as work activities and business practices undertaken at an organisation during the development of risk taxonomy. We adopted the ‘enterprise architecture’ based classification from Burtonshaw-Gunn (2008) for identifying supply chain risks as this provides a systematic approach to selecting and recording unclassified behaviour of risks. Enterprise architecture is classified into business and system architecture. The business architecture represents the most important work activities and assets in an organisation along with the organisations core business practices as the primary set of requirements (Burtonshaw-Gunn, 2008). ‘POLDAT’ is abbreviation for Process,
Organisation and Location, Data, Applications and Technology. POLDAT is a hexagonal model developed for process improvement and was first used by the American Computer Services Corporation for comparing the activities at different organisations (Burtonshaw-Gunn, 2008). The use of process improvement model for
(Adopted from POLDAT methodology, Burtonshaw-Gunn, 2008). Enterprise architecture Risk attribute Sources/activities/ issues/practices Nature of risks observed Business Enterprise Process
Focuses on the internal business activities. It looks at what the enterprise does and in which sequence it does it. Process attribute captures the end results by its classification.
Product design risk Information distortion risk Demand risk Quality risk Disruption risk Operational risks Organization
Focuses on human resources within an enterprise. It considers the culture, capabilities and roles of the people. It also considers the team structure and organizational units associated with the given activity.
Financial risk, Skill/performance risk Poor management Safety/Security risk Reputation risk Location
Focuses on geographic location types. Issues associated with physical and infrastructure facilities are considered in this set of attribute. Supply risks Safety risk Geopolitical risk Supply risk Capacity risk System Enterprise Data Focuses on business information data. It addresses the content, structure and relationship associated with information data.
Intellectual Property (IP) risk Regulatory/Legal risk Information distortion risks Application Focuses on structure, capabilities and user interface of the software used in the enterprise. All issues associated with IT are covered in this attribute.
Integration risk Network risk
Technology
Focuses on hardware, technology associated with the software used. All issues associated with communication between hardware/software are considered in this attribute.
Technology risk IT failure
risk classification is expected to provide the systematic approach for capturing the risk behaviour within the SC network. These six attributes are ‘spheres of change’
which helps to identify commonalities between activities, issues, solution fits within a system (Burtonshaw-Gunn, 2008). These risk attributes constitutes the portfolio of risks based on causality found in the enterprise or supply chain. It is essential to consider them together for a holistic picture of the risks within the supply chain network. This multi-dimensional perspective for classifying the risks utilising theory from enterprise architecture is new to existing supply chain risk classifications discussed in the SCRM literature.
The risk register for a project (new product development supply chain) was studied at the collaborating company. This led to the identification of 30 different risk scenarios and these were later classified by referring to their association with different sources, activities and practices within the organisation. Based on this predefined risk taxonomy, some of the commonly observed risks identified from the risk scenarios are presented in Table I. The nature of risks identified for each risk attribute is associated with either process or practice. This provides a good measure for not just classifying the risks but also provides a direct indication towards particular process needing attention to overcome impending disaster.
5.2. Risk trending
It is necessary to understand the fundamental nature of risks before understanding the overall risk behaviour. The risk attributes (POLDAT) are considered for the group of risks and then analysed to draw a preliminary understanding of the risk profile. Risk trending is defined here as identifying (upper and lower limit) ‘zones of operation’ observed for each risk attribute. It is understood that, every project or supply chain network is expected to behave independently and may have different operational limits. Risk is a financial liability (McCarthy, 1996) and hence it is important to define the limit of its liability. The operational limit also represents the worst case scenario for driving insurance policies and project budgets. Some of risk events were comprised of more than one type of risk attribute. In such cases, each risk was assumed to be independent with no appropriate distributions considered. Upper and lower limits of probability of event and its impact in terms of cost and delay are crucial parameters for the risk assessment process as they define the boundary of the system under study. Quality (of products and services), cost and
delivery offered by the organisation are the most important key performance indicators affecting the business performance (Ghobadian et. al., 1994; Atkinson, 1999). At the same time, cost, customer responsiveness, quality and flexibility are most important supply chain modelling performance measures (Beamon, 1999). Quality and service associated with the customer responsiveness is assumed to be the function of either cost or delay (delivery time) in this risk assessment process. It is earlier identified by Gunasekaran et al. (2004) that the quality and service can be improved or controlled by additional cost or time.
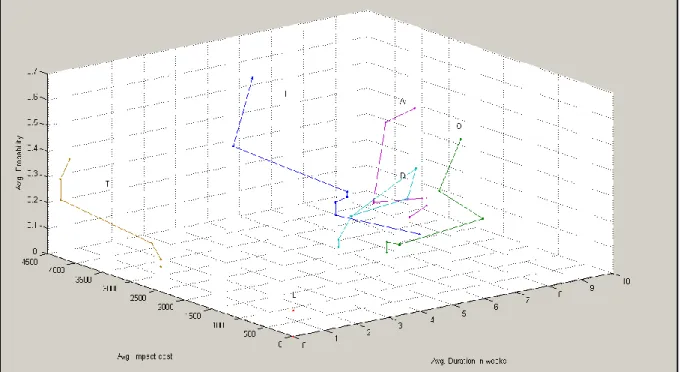
Figure 3 Risk trending: Static behaviour of risks (POLDAT)
Figure 3 depicts the static behaviour of a group of risks classified using the POLDAT risk attribute taxonomy. The operating zones for different risk attributes are captured through a three dimensional plot. The plot shows the operating envelope for average probability of the risk, impact cost and the duration of the risk for the analysed data. The data available on risk scenarios was first collated into POLDAT risk attributes and later the average performance of probability, cost and duration was captured over different periods in a project. It is observed from the risk trending plot that the process based risk tends to have high probability at the beginning of the project compared with risks associated with location. The plot also gives information about the cost limits as well as the generic behaviour of each risk attribute over the
length of the project. This kind of information could help Risk Managers to prepare proactively for the oncoming disruption. The generic static behaviour provides first-hand information on the set of risks needing priority during the mitigation stage. The historical risk data was later studied to predict the probability distribution pattern of the risk performance variables. Different approaches for identifying the probability distribution are discussed in the academic literature. It is important to predict the right probability distribution fit for transforming the historic risk data into generic risk data for further quantitative analysis.
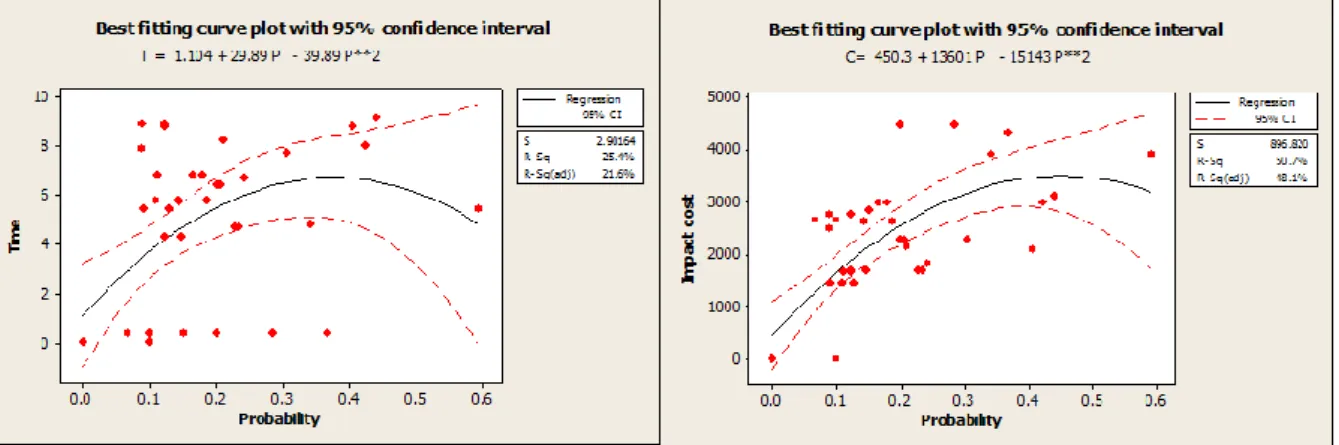
Figure 4 Best fitting curve for risk variables
The scatter diagram shown in figure 4 is a collection of points showing the relationship between dependent and independent variables. Using the identified 30 risk scenarios, three important risk performance variables namely probability, cost and time (delay) are studied for any possible correlation. The behaviour of cost and time with respect to probability were plotted for all the risk scenarios. The scatter points obtained as seen in Figure 4 were analysed for obtaining possible correlations between different risk performance variables. Minitab©, a commercial statistical and process management software was used for generating the risk trending results. The best fitting curve attempts to obtains the possible ‘degree of correlation', providing useful information for resources allocation during the project planning activity. Figure 4 shows the accumulation of risk scenarios in a specific range of probability, but does not provide evident correlation between performance variables. With a 95% confidence interval, best curve fit for the set of data was found to be poor and hence had to be rejected. R2 a ‘coefficient of determination’ is a statistical measure of how well the regression line approximates the real data points and is a measure of the
‘goodness of fit’ for the estimated regression equation (Anderson et al., 2007). Lower values of R2 were found as seen in Figure 4 for probability versus time and probability versus cost data points. No universal best-fit procedure is guaranteed to provide a correct solution for the random relationships (Ortells, 2011). This analysis is conducted with an intension to see if there is any significant correlation between the three risk performance variables. Probability, cost and time (delay) were observed to be behaving independently of each other for the given set of risk events. This means that even with the high probability of an event, there may be less likelihood of impact either on cost or time (delay) and vice-versa. With this crucial finding, further modelling of supply chain risks was developed.
One of the authors was closely associated with the organisation and collected the qualitative data related to number of stages, their expected duration and risk operational limits for different past projects through informal interviews with Risk Managers. The discussions emerging out of the respondents in a research environment provides new concepts and critical issues like policies, competencies or causal factors (Luna-Reyes and Anderson, 2003). A focus group consisting of two researchers from SCRM and three practitioners from the Systems Engineering field formed the Delphi study group and provided consensus for the observed risk trending behaviour. This activity was followed in three repetitions; the first focus group meeting did not derive any consensus but helped the group in problem synchronization. The second and third meetings led to a strong consensus on the relationship and static behaviour of risk parameters. The focus group verified the assumptions made and supported in defining the boundaries of the system under study. Modelling of risks during the risk assessment process was later conducted with the hypothesis that, the three risk performance variables namely probability, cost and time (delay) are functionally independent and do not influence one another directly.
5.3. Risk modelling
The preliminary analysis on risk trending provided directions towards important considerations for modelling risks. The functioning of risk modelling is fundamentally based on a developed supply chain risk model. The developed model is a ‘system’ combining the risk theory and working mechanism for the risk modelling activity.
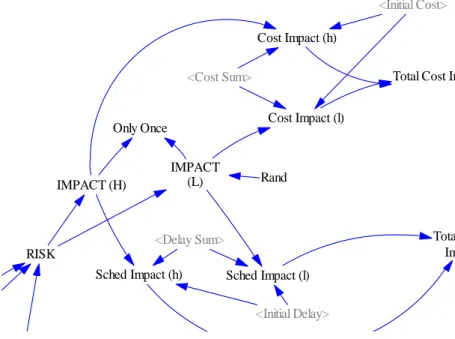
Figure 5 depicts the schematic of the supply chain risk model. ‘'Risk' is an input to the model taking into account different sets of risk attributes and parameters. The input requirements for the model to function are nature and combination of risk attribute; and the anticipated values of probability, cost and delay at the start of project. The model then considers the combination of risk attributes and their behavioural patterns to model the overall impact. The developed model considers a risk event triggered with an anticipated probability. For a given probability, it is expected to have a low or high impact on the supply chain system. Random integers are fed during this stage into the model to control the impact. The impact of the risk event could be high or low depending on the forces acting during risk propagation. This is presented in the model as high or low with a constraint that either one occurs during each risk event. In order to define the impact created by the risk event, a control feedback is provided which will calculate the impact just once (as high or low) depending on several parameters considered in the modelling. Although a risk event is assumed to be disrupting only once, in reality the risk impact propagates over periods and levels. Risk propagates in three different levels as primary, secondary and tertiary zone of risk propagation (Deep and Dani, 2009). In the primary zone of risk propagation, the disruption spreads into core activities within SC network i.e., procurement, production and logistics. In the secondary zone the risk affects critical service support such as R&D, Finance, Information technology and other non-critical supply chain entities. In the tertiary risk propagation zone, the risk further propagates to social and environmental elements of the business. Primary and secondary zone of risk propagation tends to have short term impact with tertiary zone having a long term impact on complete supply network (Ghadge, et. al., 2011). Deep and Dani (2009) portray the primary, secondary and tertiary zones in a different way. They portray the primary zone as the critical chain of fulfilment, the secondary zone as the zone that feeds into the primary zone or is the output of the primary zone; and the tertiary zone as the zone that feeds into the secondary zone or is the output of the secondary zone. The developed model is designed to capture risk propagation phenomenon in periods within the primary zone.
Figure 5 Supply chain risk model
A low or high impact condition for varying risk probability provides a condition for the risk to occur at a reduced impact providing early warning for disruption for possible mitigation action. At the high condition of impact, the probability reaches 100% (or more) and remains unchanged indicating the full extent of disruption, providing no opportunity for the risk mitigation. This concept of risk propagation is further expanded to capture the impact in terms of cost and schedule. The model later considers two scenarios for cost and schedule (as high and low). The accumulative impact in terms of cost and schedule over different periods is calculated as total cost impact and total delay impact respectively. The cost and time (delay) impacts are associated with the overall impact of disruption and hence separated for individual assessments in the model.
For the smooth functioning of the model, projected or anticipated values for initial probability, initial cost and initial time (delay) were provided to activate the system. The system model automatically considers the previous parameters for measuring the impact for the next period. The overall cost and time (delay) accumulated over the period were represented as total cost and delay impact. The risk performance was evaluated in form of impact for the given probability. Based on this underpinning concept, statistical modelling was performed to predict risk
RISK
IMPACT (L) IMPACT (H)
Cost Impact (l)
Sched Impact (h) Sched Impact (l) Cost Impact (h)
Only Once
Rand
Total Cost Impact
Total Delay Impact <Initial Cost> <Initial Delay> <Cost Sum> <Delay Sum>
behaviour whereas; the simulation modelling was performed to predict risk performance.
Statistical modelling
Statistical modelling was conducted on the lines of the supply chain risk modelling theory discussed above. In order to develop a generic risk data set from the historical risk data, it is important to find the best probability distribution for the set of the data. Probability distribution was used for predicting the basic behaviour of risks during the risk identification process and was further used to extrapolate the historic risk data by reproducing random numbers. Random numbers are generated to replicate the randomness occurring in the stochastic environment system (Oakshott, 1997). The generated random numbers for the given probability distribution were used to replicate the real world risk conditions experienced in any standard supply chain network. This also gave us the opportunity to generalize the risk behaviour for any given project in order to overcome the limitations of the historic risk data. The generated random numbers were checked through a hypothesis testing for a sample size to prove that the random numbers generated for an identified risk probability distribution were not significantly different each time. Following group consensus, check for ‘goodness of fit’ for risk distributions was undertaken using Chi-Squared test. Goodness of fit tests whether data taken as a whole is uniform and consistent (Oakshott, 1997). The Chi-Squared test is used to determine if a sample comes from a population with a specific distribution (Anderson et al., 2007).
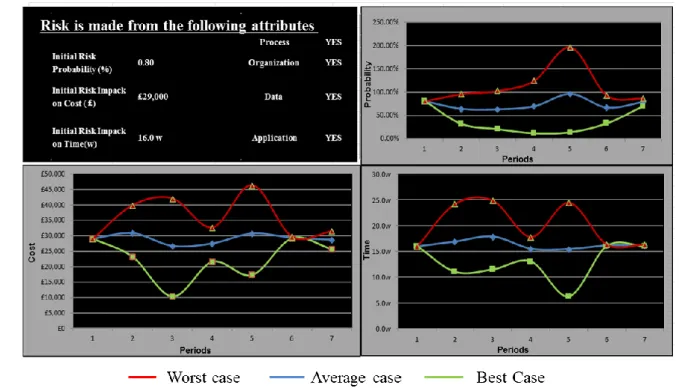
The statistical model is provided with input parameters as a set of risk attributes and initial expected probability, cost and delay. Statistical modelling is performed for risk attribute trending with three possible outcomes for the risk behaviour as best case (lower line), average case (middle line) and worst case (top line) as seen in Figure 6. Table II shows the process map of the activities for calculating the worst, average and best case scenarios from the given set of risk data. The best case is the most ideal risk scenario where the event does not occur (mathematically represented as negative). The average case is the most likely outcome from the risk scenario for the risk event. The worst case is the predicted risk performance providing the approximate period and impact expected for the given risk event, if it occurs. In the statistical modelling the 'negative probability' (Feynman, 1987) concepts is utilized to understand three paradoxical cases. Negative
probability thus can have a complementary probability greater than unity (Bartlett, 1945). Although practically unrealistic, in theory the overall risk probability may sometime overshoot above the 100% threshold mark due to combination of different mutually inclusive risk attributes.
Modelling process chart Description of the activity
1. Data decomposition
Risk scenarios/events are classified into POLDAT attributes.
2. Distribution Curve fitting
In order to predict behaviour over a period, identify the distribution fit for set of data.
3. Check for Goodness of fit
Chi square test: Goodness of fit tests indicates whether or not it is reasonable to assume that a random sample comes from a specific distribution.
4. Generate random numbers
Generate a random sample based on identified probability distribution.
5. Calculate: Median of sample size
This will give ‘Average case scenario’ for risk predictability.
6. Calculate: 10
Percentile of sample size
This will give ‘Best case scenario’ for risk predictability.
7. Calculate: 90
Percentile of sample size
This will give ‘Worst case scenario’ for risk predictability.
8. Calculate risk propagation impact
Calculate the risk propagation by estimating initial (at the start of project) parameters for probability, Cost and Time (Delay).
Table II Process map for evaluating risk propagation
The risk behaviour as seen in Figure 6 is plotted over periods representing three case-estimated changes in the risk profile from its given initial condition. For the example considered in Figure 6, risk behaviour is captured with three possible outcomes showing cost, delay and probability changes during different periods when all four risk variables (process, organisation, data and application) are activated (shown as ‘yes’). The screenshot depicts the behaviour for this run when the cumulative impacts of all risks are taken into consideration. The three risk performance parameters behave independently as reflected in the model.
Figure 6 statistical model for risk behaviour
Simulation modelling
The objective of the simulation modelling is to capture the dynamic interactions of different risk attributes in a supply chain. SD modelling captures the dynamics of different variables within SC by representing them into stocks and flows. The conceptual or mental model is transformed into computer based simulation model by structured development process. But, no SD model is successful without a strong theoretical background built through systems thinking concepts. In the generation of a SD model, there are conceptually two components in consideration: structure and parameters. The structure provides the qualitative aspects of the problem domain whereas, the parameters provide the quantitative measures in the process of generating systems based models. Following the systems approach for the SCRM framework and supply chain risk model, a causal loop diagram is obtained, capturing the inter-dependencies of risk attributes and performance variables.
The systems model as shown in figure 7 is based on the stock and flow representation of risk attributes and periods interacting with varying risk variables. The stock and flow diagram developed, takes into consideration the supply chain risk model theory, all six risk attributes and their associated likelihood of impact over
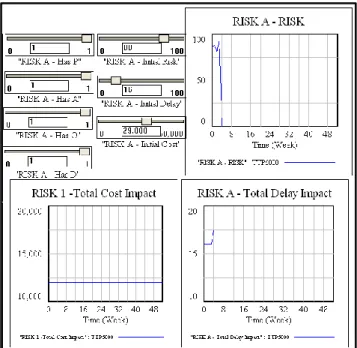
periods. The system model was provided with the initial anticipated probability, cost and time (delay) parameters to activate the simulation run similar to the statistical modelling approach. The SD model was fed with the information on risk attributes associated with the event as seen in top left side of the SD model in Figure 7.
Figure 7 Systems model for risk performance
An example of a risk event is considered for analysing the risk performance seen in Figure 7. The risk event consists of Process (P), Organisational (O), Data (D) and Application (A) risk attributes with initial estimated probability of risk event to occur as 80% and the expected impact in terms of cost and delay as seen in Figure 7. The simulation that was run for 200 iterations shows that the predicted risk occurs approximately in 3-4 week with 100% probability threshold estimation. It also shows that there is a slight increase in time (delay) for the project with no deviation to cost over the periods. This implies that although the set of risks disrupts the network in terms of increased delay, it does not substantially influence the cost parameter. The dynamic system thus estimates the impact for single risk event although this risk behaviour is expected to change due to changing circumstances in SC network like emergence and accumulation of new risks or events, lack of recovery planning, etc. Considering all such parameters will provide us with exact information of total delay and cost impact over the lifecycle of the project or network. The aspect of having no impact on the cost within the suggested example is relevant only for the scenario when the attributes have a certain profile. This may be different at different interactions of the attributes. The advantage of this system is visible when the
interdependency between the attributes can be studied at different interaction and probability levels. The modelling platform predicts the possible point of failure apart from estimating the total impact for any risk event. The risk variables show independent nature of behaviour which is evident from the statistical as well as simulation results. However, it is also evident that the risk variables when considered together create a different set of risk propagation failure points and this brings out the systemic approach of considering the interaction of the different variable to create the risk profile of the system. The results are approximate but provides the Risk Managers with sufficient understanding of fracture points and its possible impact for a given risk conditions.
5.4. Sensitivity analysis
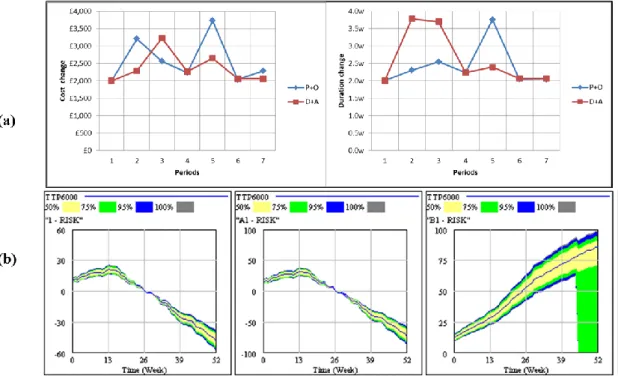
Sensitivity analysis is the study of variation in the output of a mathematical model influenced due to different variations in the inputs (Saltelli et al., 2008). Sensitivity analysis supports the modelling process in two stages; the first consideration is parameter (variable) sensitivity analysis, initially confirming the level of variation in the modelling parameter assumptions. Further allowing the assumptions to be refined in order to reduce the error tolerance within the model. Identifying the variables that have significant impact on model performance requires a robust or re-addressed input relationship. The variable sensitivity analysis is effectively the conditional probability distributions of the modelling framework. In figure 8 (a), the behavioural pattern of business and system enterprise risk attributes are analysed for change in cost and delay over a period. It is interesting to observe that the business risk attributes tends to impact in cost more than delays as observed for system risk attributes. Different conditional probabilities are plotted to observe the variation in impact in the simulation model as seen in Figure 8 (b). The variable sensitivity analysis provides the macro picture of risk impact by reacting to the working model.
Evidence sensitivity analysis is the second stage of the sensitivity runs. This is carried out when it is found that the modelling representation is providing an anticipated response to the known data-base of cases, knowledge acquisition and modelling assumptions. This next stage is used when the parametric validation of the model has been accepted. Evidence sensitivity analysis can be extended to become the subsequent modelling prediction analysis for the micro-level analysis. The
behavioural performance of risk attributes at a failure point is predicted through evidence sensitivity since both platforms provided similar results for predicting the failure point for varying risk assessment parameters. Figure 9 shows the example of evidence sensitivity for failure point prediction. The difference in behavioural patterns of risk attributes individually and cumulatively can be evidently observed in the example. Due to difference in the set of risks observed in each attribute, the risks propagate its impact over a limited period. This is represented by a sudden surge in the probability. When the different set of risk attributes are combined the pattern of behaviour is changed completely.
Figure 8 Variable sensitivity analysis: (a) Statistical model, (b) Simulation model
Example in Figure 9 shows one or more risks being combined to represent the cumulative effect on point of failure. As more and more risks are combined the probability of the event to occur reduces, but it is difficult to predict whether there would be shift in the failure point due to the accumulation of risks in the model. It is however projected that the failure point will occur earlier due to accumulation of risks within a system. The combination of risks and initial probability can be varied in evidence sensitivity analysis to further analyse the complex behavioural patterns.
Figure 9 Example for evidence sensitivity analysis
The system based modelling and sensitivity approach to the risk assessment process was created to elicit results through an iteration of statistical and simulation testing. Using average, best and worst case conditions for statistical and simulation modelling, the risk data can be holistically analysed. An example of variable and evidence sensitivity analysis is provided to observe the occurrence of failure point for varying risk parameters in Figure 8 and 9. These examples support in verifying the theory behind the supply chain risk model and to validate the developed framework for SCRM.
5.5. Strategy planning
Strategy planning is a significant stage in the risk mitigation process as it draws interpretations and adds new knowledge to the overall risk management process. The quantitative modelling process using the supply chain risk model has provided a holistic picture of risk performance. Statistical trending and likelihood of non-normal behaviour of associated risk attributes is represented in the best, average and worst case scenarios and clearly defines the expected zone of operation of the risk performance variables. The SD simulation platform represents the dynamic nature of risk attribute behaviour well beyond the overall project period through iterative and predictive process. Both the modelling platforms show the expected probability of the event occurring approximately at same time for the same input conditions. Predicted impact in terms of cost and time for the given example is observed to be fluctuating over the period in statistical modelling whereas found to be stable in the simulation results. This is due to iterative nature of the SD simulation modelling where
consistent fluctuations for the limited periods are neutralized over the long periods. This also draws an important inference that, the statistical model is slightly constrained and is limited to specific project periods while providing the clear picture of risks. On the other hand, the SD simulation model identifies the general behaviour of risks. Such generic, unbiased results can provide a better view of risk performance for Risk Managers for quick and easy learning. The risk modelling approach has helped in investigating the behaviour of risks beyond the conventional supply chain risk assessment commonly followed through the identification of the probability vs. likelihood of impact for different risks. Practitioners can comprehend this combined approach better for predicting the dynamic behaviour of risks. System feedback guides in developing their supply chain strategies to mitigate risks proactively.
5.6. Risk mitigation
The risk mitigation process forms a closed loop in the framework for SCRM. The sensitivity analysis study provides a glimpse of capability of the supply chain risk model to conduct micro-level analysis as explained through different examples. With the help of risk modelling results, Risk Managers can decide their strategies for the set of risk attributes instead of dealing with each risk independently. The modelling platforms are expected to provide a unique ‘early warning system’ for unpredictable risk events for effective risk control and mitigation. The system can be also used during risk recovery by reactively providing the understanding of most influential risk attribute and their inter-relationship in cascading the risk. This information is vital for reactive risk mitigation process in order to quickly recover from the disruption.
For proactive as well as reactive risk mitigation, agility, flexibility, responsiveness and preparedness are ideal generic strategies (Ponomarov and Holcomb, 2009). Based on the fundamental understanding of risk behaviour, Risk Managers can leverage on agility or flexibility to develop their proactive mitigation strategies. The understanding drawn from past projects and observed risk events can build the knowledge in deciding the right strategy for different risk conditions. Following these generic strategies and approaches, few risks have been discussed in POLDAT attribute form as seen in Table III. For each risk type, the probable mitigation strategy is suggested. The risk mitigation option could vary depending upon the nature of risk and decision making. Risk transfer, risk sharing, risk avoid
and risk accept are the decision making options and they depend very much on the behaviour of the Risk and Project Managers in the organisation. The behavioural rationale in risk mitigation decision making can provide interesting insights related to risk mitigation process but are beyond the scope of this research.
Risk attribute Commonly observed
risks Mitigation strategy
Decision option
Process
Product design risk Information distortion risk Demand risk Quality risk Product standardization ERP/SCM tools Postponement/ Strategic stock Process Standardization. Risk transfer Risk sharing Risk avoid Risk share Organizational Financial risk, Skill/performance risk Poor management Risk sharing contracts Outsourcing/ trainings Mentoring Risk sharing Risk accept Risk avoid Location Supply risks Safety risk Geopolitical risk Supply risk
Diverse supply base Stricter guidelines Alternate options Sustainable logistics models Multi/Dual/Contract sourcing Risk transfer/sharin g Risk avoid Risk transfer Risk sharing
Data IP risk Contractual
agreements
Risk sharing
Application Integration risk Common platforms Risk sharing
Technology Technology risk
IT failure
Cloud database Data backups
Risk transfer Risk avoid
Table III Risk mitigation strategies and decision options
6. Conclusion
Practitioner-oriented SCRM methodology effectively supports structure and strategic decision making (Tummala and Schoenherr, 2011). The proposed approach to supply chain risk modelling accentuates the complex nature of risk behavioural
interactions. Giunipero and Eltantawy (2004) identified the need for investing in extensive risk management systems for holistic supply chain management. The fundamental objective of the research reported in this paper was to develop a holistic risk management approach to measure overall risk behavioural performance. Following three distinctive systems thinking phases, the framework for SCRM is conceptualised and later implemented with the proposed research design. The framework is evaluated using the developed supply chain risk model. The systematically developed framework for SCRM is successfully tested with the collaborating organisation for its viability. The supply chain risk model is cross-verified and inferred using two risk modelling platforms for quantitative risk assessment.
The risk modelling process supports qualitative as well as quantitative data analysis making the process robust and comprehensive. Additionally, the combined modelling approach provides insights which may be difficult to capture independently. The proposed research design was found to be suitable for research related to risk management. Fundamental analysis results like failure point estimation and zones of operation of the risk attributes were found to be same in both modelling platforms, thus validating the working of the supply chain risk model. Altay and Green (2006) have suggested that answers to the duration of failure and probable impact of disruption are critical for today’s businesses. The statistical modelling process which was based on historical data was slightly constrained but provided a dynamic and predictive assessment of risk performance variables similar to the simulation model. Quantitative risk modelling has helped in not just capturing the fracture points in supply chains, but also providing other interesting insights into the behaviour of portfolio of risks.
This research provides strong implications for theory and practice. Various activities within the network (Handfield and Ernest, 2002) expose supply chains to disruptions. The increase in the number of exposure points (Stecke and Kumar, 2009) increases the need to identify these failure points within the network. The research has shown how a holistic perspective to understand and capture the complex network of interconnected nodes can be achieved. It is also necessary to understand the association of numerous inter-related and inter-dependent entities in the supply system and thus the complexity of the supply system. Although researchers (e.g. Harland et al., 2003; Oehmen et al., 2009; Tang and Nurmaya
Musa, 2010) have provided system oriented and holistic approaches to risk management, these studies do not provide a methodology of considering the influence of multiple risks on a supply system, nor do they suggest a methodology for predicting the risk propagation. The research reported in this paper provides practitioners as well as researchers an approach to consider multiple supply chain risks and depicts their behaviour over a period in the supply chain network. The holistic risk management framework, systematic research design process and quantitative supply chain risk modelling brings together a unique capability for capturing the overall behavioural performance of risks. The framework for SCRM provides a systematic process for enhanced risk management. The process also provides a foresight into how risks will propagate in future periods based on the historical data. The holistic approach to risk management is believed to benefit practitioners to capture the intricate behaviour of supply chain disruptions. The framework can also provide the ability to map the behaviour of a single risk variable over a number of periods or can capture the effect of a number of variables acting together on the risk profile.
Risk management frameworks, processes and designs are becoming an integral part of modern business models and the research can support in enhancing the existing knowledge. Systems thinking provide the ability to capture the dynamic picture of risk behaviour. This research contributes by bridging the risk modelling theory and practice to provide a holistic, systematic and quantitative risk modelling approach to SCRM. The research currently lacks micro level sensitivity analysis to predict the behaviour of risks for different combinations of risk attributes. The behavioural dimensions into the use of risk mitigation strategy could provide dimensions for bounded rationality in decision making. The research in the future intends to investigate ‘evidence sensitivity’ to bring forward some of the intricate behavioural patterns associated with each risk attribute. The risk model is tested and validated based on single case study and further studies in different sectors will improve the robustness of SCRM framework.
References
Altay, N. and Green, W. (2006), “OR/MS research in disaster operations management”, European Journal of Operational Research, Vol. 175 No.1, pp. 475-493.
Atkinson, R. (1999), “Project management: cost, time and quality, two best guesses and a phenomenon, it’s time to accept other success criteria”, International
Journal of Project Management, Vol. 17 No. 6, pp. 337-342.
Anderson, D. R., Sweeney, D. J., Williams, T. A., Freeman, J. and Shoesmith, E. (2007), Second edition, Statistics for Business and Economics, Thomson, United Kingdom.
Bartlett, S. (1945), "Negative probability", Mathematical Proceedings of the Cambridge Philosophical Society, Vol. 41 No. 1, pp. 71-73.
Beamon, B. M. (1999),"Measuring supply chain performance", International Journal
of Operations & Production Management, Vol. 19 No. 3 pp. 275-292.
Blackhurst, J., Craighead, C.W., Elkins, D. and Handfield, R. B. (2005), “An empirically derived agenda of critical research issues for managing supply-chain disruptions”, International Journal of Production Research, Vol. 43 No. 19, pp. 4067-4081.
Blome, C. and Schoenherr, T. (2011), “Supply chain risk management in financial crises-A multiple case-study approach”, International Journal of Production
Economics, Vol.134 No. 1, pp. 43-57.
Bryson, K., Millar, H., Joseph, A. and Mobolurin, A. (2002), “Using formal MS/OR modeling to support disaster recovery planning”, European Journal of
Operational Research, Vol. 141 No. 3, pp. 679–688.
Burtonshaw-Gunn S. A. (2008), The essential management toolbox: Tools, models
and notes for Managers and Consultants, John Wiley & Sons, United Kingdom.
Carr, M., Konda, S., Monarch, I., Ulrich, C. and Walker, C. (1993), Taxonomy based risk identification (CMU/SEI-93-TR-6, ADA266992), Software Engineering
Institute, Carnegie Mellon University, Pittsburgh, PA.
Chaudhuri, A., Mohanty, B and Singh, K. (2013), "Supply chain risk assessment during new product development: a group decision making approach using numeric and linguistic data", International Journal of Production Research, Vol. 51 No. 10, pp. 2790-2804.
Chiong, R. (2009), Nature-Inspired Algorithms for Optimisation, Series in Studies in Computational Intelligence, Vol. 193, Springer-Verlag, Berlin.
Christopher, M. and Lee, H. (2004), “Mitigating supply chain risk through improved confidence”, International Journal of Physical Distribution & Logistics
Management, Vol. 34 No. 5, pp. 388-396.
Cheng, S. K. and Kam, B. H. (2008), "A conceptual framework for analysing risk in supply networks", Journal of Enterprise Information Management, Vol. 21 No. 4, pp. 345-360.
COSO, (2004), Enterprise Risk Management-Integrated Framework, The Committee of Sponsoring Organisations of the Treadway Commission (COSO), executive summary report.
Colicchia, C. and Strozzi, F. (2012), "Supply chain risk management: a new methodology for a systematic literature review", Supply Chain Management: An
International Journal, Vol. 17 No. 4, pp. 403-418.
Deep A. and Dani S. (2009), “Managing Global Food Supply Chain Risks: A Scenario Planning Perspective”, Production and Operations Management
Society, 20th Annual Conference, Orlando, Florida, USA, May1-4, pp. 21.
Diabat, A., Govindan, K. and Panicker, V. (2012), "Supply chain risk management and its mitigation in a food industry", International Journal of Production
Research, Vol. 50 No.11, pp. 3039-3050.
Feynman, R. P. (1987), Negative probability, Quantum implications: essays in
honour of David Bohm, pp. 235-248.
Forrester, J. W. (1961), Industrial Dynamics. Productivity Press, Cambridge, MA.
Forrester, J.W. (1994) “System dynamics, systems thinking, and soft OR”, System
Dynamics Review, Vol. 10 No. 2-3, pp. 245–256.
Ghadge, A., Dani, S. and Roy, K., (2011), Systems Thinking for Modelling Risk Propagation in Supply Networks, 5th International Conference on Industrial
Engineering and Engineering Management, IEEE, Singapore, pp. 1685 -1689.
Ghadge, A., Dani, S. and Roy, K. (2012), “Supply Chain Risk Management: Present
and Future Scope”, International Journal of Logistics Management, Vol. 23, No.
3, pp. 313-339.
Ghobadian, A., Speller, S. and Jones, M. (1994), "Service Quality Concepts and Models", International Journal of Quality and Reliability Management, Vol. 11 No. 9, pp. 43-66.
Gordon, L. A., Loeb, M.P. and Tseng, C-Y. (2009), “Enterprise risk management and firm performance: A contingency perspective”, Journal of Accounting and Public
Policy, Vol. 28, No. 4, pp. 301-327.
Goh, M., Lim, J. Y. S. and Meng, F. (2007), "A stochastic model for risk management in global supply chain networks", European Journal of Operational Research, Vol. 182, No. 1, pp. 164-173.
Giunipero, L. and Eltantawy, R. (2004), “Securing the upstream supply chain”,
International Journal of Physical Distribution & Logistics Management, Vol. 34