PROBLEM-SOLVING CONFIDENCE OF MIDDLE AND HIGH SCHOOL MATHEMATICS STUDENTS
by Edwin Montijo Liberty University
A Dissertation Presented in Partial Fulfillment Of the Requirements for the Degree
Doctor of Education
Liberty University 2017
THE EFFECTS OF DESMOS AND TI-83 PLUS GRAPHING CALCULATORS ON THE PROBLEM-SOLVING CONFIDENCE OF MIDDLE AND HIGH SCHOOL MATHEMATICS
STUDENTS by Edwin Montijo
A Dissertation Presented in Partial Fulfillment
Of the Requirements for the Degree
Doctor of Education
Liberty University, Lynchburg, VA 2017
APPROVED BY:
Timothy R. Nelson, Ed.D., Committee Chair
Nancy K. DeJarnette, Ed.D., Committee Member
Marianne T. Bartley, Ed.D., Committee Member
ABSTRACT
As technology in education continues to improve, research is necessary to assess the impact it is having on students’ confidence in the way students solve mathematics problems. The purpose of this quasi-experimental, non-equivalent control-group comparison study is to examine the impact the Desmos graphing calculator has on the problem-solving confidence of middle school and high school students as compared to students who use a TI-83 Plus graphing calculator while controlling for students’ math achievement scores. The students (N = 146) participating in this study were learning their respective mathematics material for an equivalent period of 12 weeks in order to determine whether students who used the Desmos calculator experienced a
statistically significant difference in problem-solving confidence levels. Students in both groups took the assessment at the end of the 12-week period of learning and an Analysis of Covariance (ANCOVA) was used to test whether there was a significant difference in the scores of the Problem Solving Inventory (PSI). Results indicate that there was a statistically significant difference in problem-solving confidence scores between middle and high school students who used the Desmos graphing calculator as compared to students who used a TI-83 Plus graphing calculator, while controlling for student math achievement scores.
Keywords: graphing calculator, Desmos, TI-83 Plus, mathematics, Social Cognitive Theory, problem solving, confidence, Problem Solving Inventory
Acknowledgements
The first person I would like to acknowledge is my Lord. Over 10 years ago, I asked the Lord what I should do and the simple response was, “Doctor of Education.” Thank you for providing such clear instructions and allowing me to see this dissertation through until the end.
As I worked my way through the master’s and doctorate, I would like to thank my wife Paula and my children Samuel, Kaylisa, Timothy, and Elizabeth for their sacrifices and support throughout the years. We gave up many evenings and weekends to make this a reality. Your love and support continues to amaze me.
I would like to thank Dr. Nelson, my Committee Chair, for the work it took to guide me through this task. The amount of transformation a dissertation can go through from start to finish is a wonder! Your guidance and encouragement were always positive, supportive, and gave me the direction needed to complete the dissertation. Thanks for always being there.
Thank you to Dr. Bartley and Dr. Dejarnette for your input and counsel throughout this process. I remember when we first started this journey the dissertation design was in need of a greater vision. You both provided this and guided the transformation of this dissertation into something better. Thank you for the time you invested in helping me make this a stronger dissertation.
Finally, thank you to the church family that held me up in prayer during this time, especially Pastor Rick Martin and Mr. Bruce Althouse. Your encouragement and prayerful support during this time was faithful and appreciated.
Table of Contents ABSTRACT ...3 Acknowledgements ...4 List of Tables ...7 List of Figures ...8 List of Abbreviations ...9
CHAPTER ONE: INTRODUCTION ...10
Background ...10
Problem Statement ...13
Purpose Statement ...14
Significance of the Study ...15
Research Question ...16
Null Hypothesis ...16
Definitions ...16
CHAPTER TWO: LITERATURE REVIEW ...18
Introduction ...18
Theoretical Framework ...26
Motivational Factors Influencing Problem Solving ...32
Literature Review ...41
CHAPTER THREE: METHODS ...55
Design ...55
Research Question ...57
Participants and Setting ...57
Instrumentation ...60
Procedures ...65
Data Analysis ...66
CHAPTER FOUR: FINDINGS ...68
Research Question ...68
Null Hypothesis ...68
Descriptive Statistics ...68
Results ...70
CHAPTER FIVE: DISCUSSION, CONCLUSIONS, AND RECOMMENDATIONS ...75
Overview ...75
Discussion ...75
Implications ...77
Limitations ...78
Recommendations for Future Research ...80
REFERENCES ...82
APPENDIX A: Problem Solving Inventory ...98
APPENDIX B: Student/Parent Information Form ...99
APPENDIX C: Liberty University IRB Approval ...100
List of Tables
Table 1. Solving Linear Systems using the TI-83 Plus and Desmos Graphing Calculator
...20
Table 2.Control Group Demographics ...59
Table 3.Treatment Group Demographics ...60
Table 4. Measures of Academic Progress Achievement Test ...69
Table 5. Problem Solving Inventory: Problem Solving Confidence Subscale ...69
Table 6. Adjusted PSI Scores ...70
Table 7. Tests of Normality ...71
Table 8. Homogeneity of Regression Slopes Test ...73
Table 9. Levene’s Test of Equality of Error Variances ...73
List of Figures
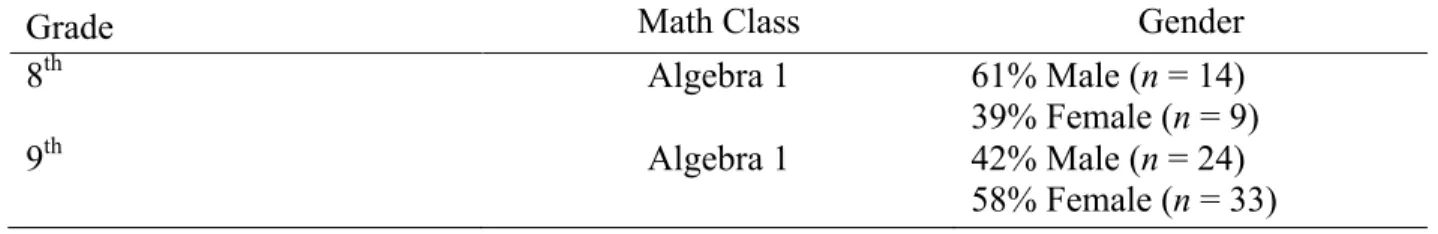
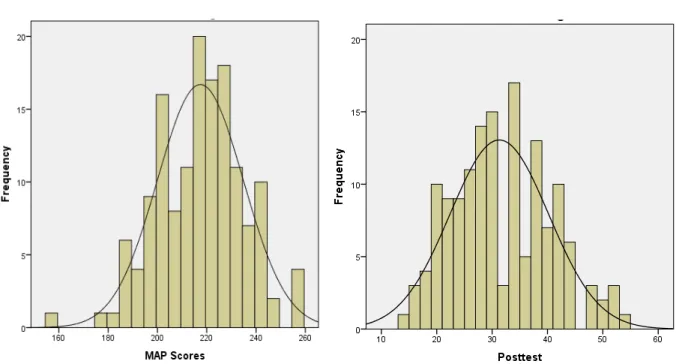
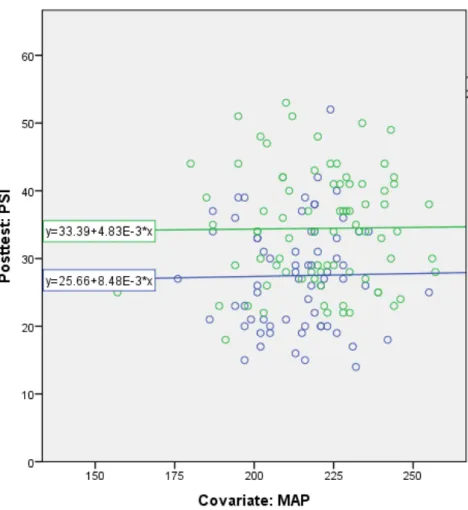
Figure 1. Distribution of MAP Mathematics Achievement Scores ...71 Figure 2: Distribution of PSI Posttest Scores ...71 Figure 3: Scatterplot of MAP Scores and PSI Scores ...72
List of Abbreviations
Analysis of Covariance (ANCOVA) English Language Learner (ELL) Measures of Academic Progress (MAP) Northwest Evaluation Association (NWEA) Problem Solving Inventory (PSI)
CHAPTER ONE: INTRODUCTION Background
Educational technology in mathematics has become dynamic and progressive. There has been a steady advance in the technology available for math teachers and students; namely, four function calculators, scientific calculators, computers, graphing calculators, and applications for mobile technology. As graphing calculators assimilate into the mathematics classroom, changes occur (Al Lily, 2013; Lee & McDougall, 2010). Currently, the TI-83 Plus, manufactured by Texas Instruments, has been the graphing calculator of choice for many high schools in the United States. It is familiar to teachers and integrated into many textbook activities, lesson plans, and teacher professional development. The graphing calculator is widely used on state tests and national examinations, such as the College Board’s SAT and Advanced Placement Exams. The SAT and other standardized tests do not allow the newer online and downloadable calculator applications. This is due to the extra capabilities the devices have, such as a keyboard, cell phone service, and the fact that many are on laptops or hand held computers (The College Board, 2015).
The focus of this study is to examine the effects of the Desmos and TI-83 Plus calculators on students’ problem-solving confidence, since the use of graphing calculators plays a role in student achievement. Laumakis and Herman’s (2008) study of teacher training with graphing calculators showed an increase in student achievement. They concluded that student
achievement increased with the implementation of graphing calculators by trained teachers. As students continue to interact with newer graphing calculators, researchers should investigate them further, as it may alter students’ problem-solving confidence. This is in keeping with prior research patterns. For example, increases in technology literacy skills have led to reduced
anxiety for students and teachers (Sun & Pyzdrowski, 2009; Tatar, Zengin, & Kagizmanh, 2015). This is because students can feel anxiety over finding patterns and relationships and the
additional help the graphing calculators provides can ease this anxiety. Since graphing
calculators may ease anxiety, it is reasonable that researchers investigate them for their effect on problem-solving confidence.
Recent mathematical applications have kept up with current trends in mobile technology (Nadel, 2012; Wahl, 2015). Many types of calculators, including online graphing calculators and downloadable applications, are available free of charge or for a few dollars for those equipped with computers, tablets, phones, and other mobile devices. These online graphing calculators have interfaces that dramatically simplify the manipulation of data, equations, and graphs. As technology continues to make mathematics computations easier and more intuitive, further investigation should follow to measure its effect on the problem solving confidence of students as they engage in meaningful mathematics applications.
One model of an online graphing calculator is the Desmos calculator. It is downloadable without cost to mobile devices or used in its online application. Its developers have included built-in content such as a bank of equations, dual workspace that includes data and graph located on the same screen, and application anticipation features such as automatically displaying vital information about the graph (Desmos, 2015). By comparison, students need to access two separate screens to go from seeing the graph and table on the TI-83 Plus graphing calculator. There is a split screen option, but this makes both the graph and table smaller. On Desmos, students have access to the graph, table, and important points on the function in one screen. These factors make Desmos easier to manipulate and more intuitive in its approach to math, cutting down steps that interfere with the deep thinking required when solving math problems.
Intuitive features create a benefit to high school students because students can easily navigate difficult math concepts with programs found on the mobile technology (Freeman, 2012). Changing the screen dimensions of the graph involves multiple steps on the traditional graphing calculator, whereas on Desmos, zooming in and out requires pressing the plus/minus button on the screen or if it is a touch screen, squeezing one’s fingers together or apart on the screen to zoom in or out. Finding the intersection of two lines, a difficult math concept, involves a series of learned steps on the older technology. On newer technology, it is a matter of clicking once on the intersection of the lines on the new calculator. Teaching the series of steps required to use the TI-83 could be a main objective in a 45-minute class period. With the new calculator, this now becomes a simple tool to allow the teacher to access more difficult problems within a matter of minutes of starting the lesson. Since the Desmos calculator is more intuitive and easier to use in certain aspects of math, this researcher believes that students who use this calculator may experience less stress when solving math problems. By easing students’ anxiety, this researcher believes that the type of calculator may affect the problem-solving confidence of students. Hillman (2012) noted that one of the problems with technology is the inherent complexity within the device that hinders students from using it successfully.
Although implementation of online graphing calculators is becoming more accessible to teachers due to the increases in technology, not all schools have a mobile device for each student. This limits the exposure students nationwide have to the Desmos graphing calculator. Another consideration is that state assessments or college entrance exams do not currently allow test takers to use online graphing calculators for tests. This creates a barrier for students, teachers, and schools that consider using the more advanced graphing technologies. Additional research on the impact of this technology may help educators make informed decisions.
Problem Statement
Given the propensity towards the development of new technologies that aid academic achievement, the Office of Educational Technology recommended additional research to assist teachers so that they can adjust their teaching and educational technology practices (Office of Educational Technology, 2014). There is still a need for further research to determine if various types of graphing calculators lead to differing levels of problem-solving proficiency (Kenney, 2014). As such, middle school and high school teachers face the challenge of understanding the impact the type of calculator has on their students’ perceptions of mathematical skills and problem-solving abilities. This information would aid them in making informed decisions concerning graphing calculator usage in their middle school or high school classroom.
Studies have not yet linked various graphing technologies to the effects on problem-solving confidence. There is a need to determine whether the Desmos graphing calculator has an impact on student problem-solving confidence because problem solving is a fundamental
attribute in math related fields (Ozyurt, 2014). Understanding this gap in the research, Kaya, Izgiol, and Kesan (2014) have called for the advancement of problem-solving abilities of students with regard to the use of graphing calculators. Hillman (2012) made a similar proclamation, stating that problem-solving abilities are not as advanced as they could be. Hillman noted that one of the problems with technology is the inherent complexity within the device that hinders students from using it successfully. For these reasons, it is worth the effort to study the effects of graphing calculators on the problem-solving confidence of students.
The problem is there is a lack of research to determine if various types of graphing calculators lead to differing levels of problem-solving proficiency (Kenney, 2014). Problem solving improvement continues to be a foundational goal for mathematics teachers in secondary
education and newer calculators may influence student problem-solving confidence. Despite the call for education to keep up with the advances in technology due to its engaging qualities (Periathiruvadi & Rinn, 2012), the research is limited when it concerns the impact the type of device has on student problem-solving confidence. The void in the literature suggests that further research needs to occur for the verification and reflection of problem-solving skills of a wide range of students due to the cross-section of students who do not excel at problem solving (Allison, 2000).
Purpose Statement
The purpose of this nonequivalent control-group study is to examine the impact the Desmos graphing calculator has on the problem-solving confidence of high school and middle school students as compared to the impact the TI-83 Plus graphing calculator has on students. The independent variable was the type of calculator used and the dependent variable was problem-solving confidence as measured by the Problem Solving Inventory (PSI) (Heppner & Peterson, 1982). This study included a sample (N=146) of middle school and high school students. This sample was from one of the approximate 500 Pennsylvania school districts.
The dependent variable, confidence in problem-solving ability, is one’s sense of assurance to be able to solve tasks. This confidence can be measured by the PSI created by Heppner and Peterson (1982). Confidence is rooted in self-efficacy, which Myers (2014) defined as one’s impression of proficiency on a task or set of tasks. As such, Schwarzer and Jerusalem (1995) asserted that it facilitates goal setting, effort investment, and perseverance in the face of obstacles and drawbacks. This study recognizes problem solving as the interactions of cognitive, affective, and behavior processes with the aim of reconciling internal and external tasks (Heppner & Krauskopf, 1987).
Significance of the Study
Effective use of graphing technology creates a practical way for teachers to provide their students with a framework that enables them to enhance their mathematical understanding (Lee & McDougall, 2010). Allison (2000) demonstrated that the graphing calculator can aid problem solving and that students can use a graphical approach to mathematical problem solving. The body of research associated with graphing calculators has demonstrated that these digital technologies are amplifiers that augment student learning (Barrera-Mora & Reyes-Rodriquez, 2013). In a meta-analysis of the use of graphing calculators, Nikolaou (2001) found that graphing calculators had a modest positive effect on achievement and problem solving, regardless of socio-economic level, location, and ability level.
The significance of this study is to focus on the calculator in order to see if one of the devices can cause an increased confidence in a student’s ability to solve problems when provided one of two different graphing calculators. Problem solving uses four recognized steps that the problem solver uses to arrive at an answer effectively. Namely, (a) understanding the situation within the problem, (b) utilizing a plan that incorporates a problem-solving strategy, (c)
executing the plan, and (d) checking the results (Musser, Burger, & Peterson, 2001). Educators and students use the calculator as an aid to assist them in attaining an answer. The significance is that there may be a measureable difference in confidence levels caused by the graphing calculators. Calculators, as educational tools, differ in the presentation of their data, difficulty level in inserting the appropriate information, and cost. As such, the experience of using one calculator versus another changes the experience the problem solver has when solving
has previously established a correlation between mathematical knowledge and proficiency in graphing calculator usage (Ocak, 2006).
Accordingly, teachers and other school personnel would be interested in knowing the impact different graphing calculators have on problem-solving confidence. Thomas and Hong (2013) support the introduction of graphing calculators because they sought to understand the implementation dynamics of graphing calculators among teachers. They noted that teacher perceptions of technology play a role in their graphing calculator implementation. As such, this study aims to contribute significantly to the body of literature on graphing calculators available to teachers by investigating the impact newer graphing technology has on perceptions of problem solving.
Research Question
RQ1: As measured by the Problem Solving Inventory (PSI) is there a significant difference in middle and high school students’ problem-solving confidence when provided the use of the Desmos calculator as compared to students who use the TI-83 Plus calculator while controlling for student achievement math scores?
Null Hypothoses
H01: As measured by the Problem Solving Inventory (PSI) there is not a significant
difference in middle and high school students’ problem-solving confidence when provided the use of the Desmos calculator as compared to students who use the TI-83 Plus calculator while controlling for student achievement math scores.
Definitions
1. Desmos Calculator: This downloadable online graphing calculator can readily graph various forms of equations, show their tables, and provide the user with information
regarding functions. A trait of the calculator is that the function form does not matter when graphing. Changing the screen dimensions on Desmos, or zooming in and out, involves pressing the plus/minus button on the screen, or if it is a touch screen, squeezing one’s fingers together or apart on the screen. Difficult concepts, such as finding the intersection of two lines, involves clicking once on the intersection of the lines on the new calculator.
2. Problem Solving: Problem solving is a process that synthesizes internal and external resources and applies them to problems or challenges at hand. Problem solving is a dynamic interaction among cognitive, affective, and behavior processes with the aim of making changes due to internal and external challenges (Heppner & Krauskopf, 1987). Stages involved in problem solving include general orientation, definition of the
problem, production of alternatives, decision-making and selection of strategies, and evaluation of outcomes and procedures (Heppner & Peterson, 1981). Similarly, Kaya, Izgiol, and Kesan (2014) declared that there are a fair number of concepts about problem-solving skills that include defining of the problem, generating possible
solutions, persevering to find solutions, obtaining conclusions, and providing a decision. 3. Problem-Solving Confidence: Heppner and Baker (1997) defined problem-solving
confidence as a student’s self-assurance while actively dealing with a range of problem-solving activities and as a confidence in one’s ability to problem solve.
4. Social Cognitive Theory: The social cognitive theory provides a framework concerning social and cognitive factors within an environment. According to Bandura (1997), these factors are in a state of perpetual reciprocal interactions, which provide humans the ability to determine their course of action, especially when solving a problem.
CHAPTER TWO: LITERATURE REVIEW Introduction
The purpose of this chapter is to explore the technological and educational impact graphing calculators have on education and provide a framework to explore further the
ramification of their use. The convenient nature of graphing calculators continues to evolve as an ongoing social innovation in its usability and ability to solve mathematical problems. In turn, this opens up new doors to explore as it relates to a student’s ability to solve problems. The principles of social cognitive theory provide a platform to understand the applications of both usability and problem solving as it influences student learning.
Technology and Math
The impact of the graphing calculator is far reaching and its integration has shown that this technology allows students to reach better conclusions and improve performance on procedures (Abu-Naja, 2008; Ozel, Yetkiner, & Capraro, 2008). The key is the purposeful implementation of the technology into the classroom. Holubz (2008) added to the literature and claimed that student achievement via calculators stems from engaged student participation, vibrant interactive class discussions, and increased focus on instruction. Since achievement is increasing, students benefit from calculator usage during instruction.
The skill of the mathematics teacher matters when it concerns graphing calculators. Meagher, Ozgun-Koca, and Edwards (2011) claimed that teacher preparedness is an important aspect to integration of the graphing calculator in the classroom. There are many methods to ensure mastery of the graphing calculator. Depending on their available resources, teachers can find information within instructional books or textbooks, or ask college professors and each other to find out how to integrate the graphing calculator into the classroom. Teachers can also find a
host of online instructional materials, such as YouTube videos, that demonstrate to both teachers and students how to use the graphing calculator.
Preservice teachers are particularly influenced by the modeling of technology, as Meagher, Ozgun-Koca, and Edwards (2011) concluded in their study that the use of advanced digital technologies during field placements made a decisive impact on preservice teachers’ attitudes regarding the use of the technology that would become their own teaching practice. This is especially true when the lesson’s activity with technology includes open-ended questions and an inquiry-based approach. In these types of problems, modeling is especially effective when the material learned and taught is similar in cognitive difficulty, such as rate of change investigation problems that are in line with intercept and slope for Algebra 1, and non-linear patterns for the second year of algebra (Sinn, 2007). Students are empowered to believe that they can accomplish a task when teachers model how to use technology such as the graphing calculator.
Broad gains in student achievement have been associated with graphing technologies. When teachers received instructions in how to use the graphing calculator, there was a
significant increase in the scores of their students (Laumakis & Herman, 2008). Laumakis and Herman’s study (2008) examined statewide assessment scores for 328 students and found no significant gains for students taught by non-trained teachers, and furthermore concluded that teacher training was a critical factor in efficiently presenting and utilizing these technologies within the classroom. Three years later, Meagher, Ozgun-Koca, and Edwards (2011) concluded that teacher training was a key factor in implementing technology.
Mastery of the graphing calculator is not the only factor to consider for teacher preparedness. Teachers must also consider efficiency. For example, Table 1lists the number
steps required to solve a linear system of equations using Desmos and the TI–83 Plus graphing calculators.
Table 1
Solving Linear Systems using the TI-83 Plus and Desmos Graphing Calculators
Number of Steps Desmos TI – 83 Plus
1 Go to desmos.com Turn on calculator
2 Press Start Graphing Press y=
3 Insert equation in line 1 Insert linear equation in Y1 4 Insert equation in line 2 Insert linear equation in Y2
5 Adjust the window Press GRAPH
6 Press on the intersect Adjust window as necessary
8 Press 2nd and TRACE
9 Select intersect
10 Press ENTER to choose the
graph of the first equation
11 Press ENTER to choose the
graph of the second equation
12 Press ENTER to take a guess
of the intersect
According to Freeman (2012), solving equations efficiently with mobile technology is upon us. One only needs to study the varying complexity found in the differences between the TI-83 Plus and Desmos graphing calculators. Using the TI-83 Plus, there are approximately 12 steps required to find the intersection of two lines (solution to a linear system). Using Desmos, there are half as many steps. Graphing calculators are currently undergoing major upgrades and
are available via mobile technology. Teachers and students must not overlook the importance of upgrades.
Effective use of graphing technology creates a practical way for teachers to provide their students with a setting that enables them to enhance their mathematical understanding (Lee & McDougall, 2010). Two factors that influence this finding include the level of proficiency with the calculator and the level of integration into the curriculum. This is especially important for at-risk students, since students who traditionally lag behind in achievement can make gains from incorporating graphing technology. Freeman (2012) found that English Language Learner (ELL) students, with frequent educational needs, benefitted from digital interventions in a coherent and purposeful student centered design. Hence, the results of Freeman’s study demonstrated that purposeful digital interventions can improve students’ math abilities and their perceived math self-efficacy.
A benefit of the newer graphing calculator Desmos is that it is a free calculator and can be readily found and downloaded to mobile devices. This technology aids students by reducing or eliminating complex graphing calculations that are prone to errors when computed by hand. With the reduction of steps involved in solving math problems, teachers can dramatically reduce the amount of verbal and written instruction to students. The new applications on mobile devices can be a significant upgrade for students when compared to popular graphing calculators such as the TI-83 Plus.
Graphing Calculators as a Societal Innovation
Graphing calculators have reduced educational boundaries much the same way other technologies, such as online learning, e-books, and social networks have reduced traditional spatial boundaries (Al Lily, 2013). As such, graphing calculators constitute a social innovation
that has affected the mathematics classroom across the United States. Bandura’s (1998) (1998) social cognitive theory provides a framework that describes the impact on society by innovations and new ideas.
Bandura (1998) rationalized that the pattern of social diffusion begins with early adopters conveying information about the real and perceived benefits of a practice. If the practice gains momentum and is widespread, it does so at an accelerated rate. Eventually, the practice saturates a society and the acceleration levels off and begins its decline due to the lesser numbers that have not adopted the practice. In addition, it is also true that innovative practices face competition and are subject to alternate forms that take some of the participants away. Applying this principle to graphing calculators, the Texas Instrument family of graphing calculators has been the most widely distributed graphing calculator and is now seeing competition from online graphing calculators such as Desmos.
There is a difference between knowing about an innovation and applying that innovation into practice. Incentive factors influence the adoption of an innovation (Bandura, 1998). In mathematics, incentives exist when calculator users navigate difficult math concepts with ease with programs found on mobile technology (Freeman, 2012). To facilitate this, orientation to a graphing calculator can be entertaining for students. For instance, teachers can use scavenger hunts to get students to find and think about ideal locations in which calculator functions exist (Huizdos & Gosse, 2003). For example, on the TI-83 Plus, the yellow button opens access to all the functions in that particular color, providing an alternate function to every button. A
scavenger hunt allows students to explore the calculator in a cognitively safe way and allows students the opportunity to learn how to exit out of functions they have entered.
Innovations need to satisfy a person’s self-evaluation concerning their values, beliefs, and standards in order to lead to adaptive behaviors (Bandura, 1998). Teachers who value the
innovations that a graphing calculator brings to mathematical learning will readily use the devices they value (Reeves, 2003). Conversely, teachers who believe that the use of graphing calculators hinders student academic growth will resist using the devices.
Moreover, adoption of innovations will often require financial resources, and this could hinder the disposition of people to obtain the innovations (Bandura, 1998). When it concerns affordability, Desmos has an advantage in that it is free to download, provided a school district has access to a platform that can run it, such as a computer, laptop, tablet, phone, or other similar device that connects to the Internet. Some schools can afford to provide these devices to every student, while others do not have these options.
New innovations face several obstacles such as additional time and effort, overcoming or facing insecurities, and learning new skills in order for people to release old habits to conform to new ones (Bandura, 1998). If a teacher works with a particular calculator and invests a large amount of energy into synchronizing their lessons with it, the teacher may have preferences regarding the implementation of the technology (Fleener, 1995). For instance, the teacher may know how to use a graphing calculator to find the vertex of a quadratic equation. The teacher may also know where in the curriculum this skill is useful. The teacher, however, may still question when the best time is to introduce the matching graphing calculator activity into the lesson, (i.e., before students can compute the vertex by hand, or after this skill is developed). Furthermore, innovations have the potential to clash with the existing frameworks and practices already in place. For example, state testing requirements may only permit certain types of calculators in an exam room. Suppose a new calculator emerges that does not meet those
requirements; it could face resistance from teachers who deem such a calculator not worthy of the risk of using it, given the high stakes nature of state testing. Teachers would be slow to adapt this innovation due to the hindrances of the bureaucracy imposed on the system. Groups not encompassed by state testing mandates, such as private schools and home schooled students, would not face this aversion and therefore not be subject to the institutionalized barriers it creates.
In order to produce a socio-cultural change within a system, a diffusion program should select a favorable setting, meet the preconditions for change, effectively implement the program, and spread the innovation(s) elsewhere (Bandura, 1998). Calculators have long been a fixture in many schools (Dion, Jackson, Klag, Liu, & Wright, 2001); therefore, schools would be a
reasonable place for innovative calculators to make their appearance. In order to continue to expand and upgrade the use of calculators, developers would have to convince teachers that the new calculators are useful in promoting critical thinking and innovative ways to solve problems, and are readily accessible. The main enhancement to Bandura’s diffusion steps is that due to the Internet, schools that have access could implement new online-based calculators without having to wait for results from other schools. This allows a quicker saturation of a new technology and eliminates some of the early adopter role to convey information because explorers are now actively searching for helpful applications. Schools that have technology integration personnel serve as an example to demonstrate that new technologies are being developed at a quick enough rate that schools have designated personnel to investigate and implement them.
Individuals gain affective learning through direct experiences, which leads to likes and dislikes by individuals within a group (Bandura, 1998). Relating to mathematics, students have preferences on the calculators they use due to the aesthetics of the device, screen preference, and
complexity (Hanson, Brown, Levine, & Garcia, 2001). Although dated to the technology at the turn of the century, Hanson et al.’s (2001) study showed that students perceived that their personal calculators were more sophisticated than the one provided for standardized testing. This is a reason why studying the effects of newer calculators is important. When students have access to the newest technology, this may affect their preferences and thereby their confidence. The graphing calculators show favorable impact on student perceptions and their ability to find solutions (Allison, 2000). This is because they provide ready access to a level of mathematical speed and accuracy within scalable graphs and tables of values not possible by hand and pencil. Taking away this arduous aspect of mathematics allows the individual student to focus on reasoning and results.
The Usability of Graphing Calculators
Competition among devices spurs individuals and systems to examine the usability of the devices to determine which product best serves the needs of the users. When comparing
graphing calculators, their usability is not a tangible attribute, but rather a measurable
examination of the quality of suitability for the created purpose (Jordan, Thomas, Weerdmeester, & McClelland, 1996). Product usability is effective and successful when the product performs its technical function and its user(s) can get the product to work as intended (Kortum & Bangor, 2013). The concept of usability for graphing calculators is framed within the curriculum the school uses (parameters of the intended users); the ease by which functions and graphs can be accessed (task the artifact aims to perform); and the classroom (environment) in which it is used. It seeks to measure the effectiveness, efficiency, and satisfaction of the graphing calculator while using a measuring tool that is cost effective, quick, and able to compare accurately.
As such, the measurement of the graphing calculator’s usability is beneficial to educators and administers (practitioners) because it provides an equitable method to compare the graphing calculators (specified product) (Bangor, Kortum, & Miller, 2008; Kortum & Bangor, 2013; Sauro, 2011). While both are proficient at graphing applications, the Desmos and TI-83+ calculators differ in their interfaces and by default, so do the procedures and length of steps required to assist students in their problem solving skills.
Theoretical Framework
The foundation and springboard to investigating graphing calculators’ impact on problem solving can be found in Bandura’s (1986) social cognitive theory due to the dynamic nature of student learning in a school setting.
Problem Solving and Social Cognitive Theory
Social cognitive theory provides a wide-ranging framework concerning social and cognitive factors within an environment. These cognitive and social factors are in a state of perpetual reciprocal interaction, which provide humans with the ability to determine their course of action, especially when solving a problem (Bandura, 1997). In addition, social cognitive theory is suited for the study of students in their school environment as it encompasses diverse cultural environments that differ in their values, traditions, and social practices (Bandura, 2002).
In mathematics, problem solving can involve highly structured routines, such as applying a formula or following the steps to solve an equation. Van Merriënboer (2013) referred to this process as the strong methods definition of problem solving and builds upon this definition to arrive at practical problem solving in real-life situations. Real-life problem solving involves a mix of non-structured and well-structured processes that require the student to integrate reasoning and decision making skills with strong methods to arrive at conclusions.
At the cognitive level, algebra students are learning a new language with its own set of rules and nuances that provide a way to apply relevant mathematical thoughts and insights to realistic problems (Abram, 1969). Whether on paper or on the graphing calculators, this ability for students to use symbols to represent real-life phenomena is explained within social cognitive theory as the capability humans have to symbolize aspects of their environment that allow problems to be solved symbolically before being applied in real life (Bandura, 1986). The use of graphing calculators in algebra provides another way or avenue for students to put symbols and equations into practical applications without eliminating their ability to interpret and formulate (Pierce, 2005).
Frameworks for dealing with symbols in calculator-assisted math classes exist. Relevant to this study are various student abilities, mainly: (a) linking verbal and symbolic representations together; (b) recognizing conventions and their properties; (c) making connections to symbols and their graphs; (d) linking symbols with their numeric representational (e.g., equations and tables); and (e) recognizing their meaning within the problem (Kenney, 2014; Pierce, 2005).
Verbal and symbolic representations in the form of equations allow students to model real-life situations as mathematical models and analyze interpretations (i.e., projections, estimations, and patterns). Calculators assist in these tasks by manipulating equations and making graphs and tables of data that can be both quickly generated and manipulated. Doing difficult problems by hand requires time, and long tedious problems take time away from other important curricula. Graphing calculators make these laborious problems more manageable and thus allow teachers to focus on parts of the curriculum that were previously inaccessible due to time limits (Pierce, 2005). An underlying assumption to Pierce’s conclusion is that teachers are
not spending a large amount of time learning to operate the calculator, thus negating the time allowed for other important curricula.
Observational Learning and Problem Solving with Graphing Calculators
Social cognitive theory describes the ability individuals possess to learn by observation, which is relevant due to the visual aspect of graphing calculators. Bandura (1998) evoked the concept that learning can occur by observing behaviors and actions without experiencing them first hand. Research has shown that students in upper elementary math classrooms can observe how teachers and peers solve problems and benefit from the modeling that occurs (Ramdass, 2011; Ramdass & Zimmerman, 2011). Concerning secondary students, the use of teacher modeling with the employment of mistakes and error analysis leads to a favorable form of
observation, as opposed to using mastery teaching without errors. Teachers use interactive white boards, such as the Smart boards used in Nejem and Muhanna’s (2014) study, as a modeling tool that have a positive effect on middle school students’ achievement and math retention. Teachers can use interactive white boards along with other projection tools to model the use of calculating devices to students. Generally, a teacher would need computer access with graphing software or Internet access to attach to the interactive white board. One benefit of using large displays is that students observe the sequences used to manipulate graphing calculators and can apply that information as they perform their tasks.
Observational research is important because it uses the vicarious capability of humans to acquire rules and patterns of behaviors without the tedious route of trial and error (Bandura, 1998). This is useful because students can learn graphing calculator procedures through
observation. This is important because a classroom full of students with iPads connected to the Internet has an abundance of options if they were to download calculator apps from the Apple
store. These options may not need involve teacher modeling, as students may be using them without permission. Photomath is one example, because students can take a photo of the math problem and the answer comes up on the student’s screen.
In the case of mathematics education, the teacher’s personal values, attitudes, and behaviors can have an impact on his or her students. The power of observation extends past knowledge; it affects values, attitudes, and behaviors (Bandura, 1998). The level of attention and interest an individual demonstrates affects the depth of observation. Ardies, Maeyer, Gijbels, and Keulen (2015) found teachers who sustained interest in high school aged males (12-14 years) fostered a more positive view about a future career in technology. This suggests that the better a teacher can arouse student interest in the subject matter, including the use of graphing
calculators, the better the level of attention and interest a student will display.
Observations, by their nature, need modeled events in order to take behavior from observation to matching patterns. According to Bandura (1998), modeled events are first observed or given attention, then retained; afterward, it goes through a production process, and finally through a motivational process, which can culminate in a matching pattern. As it relates to problem solving, it benefits students to observe problem solving events before teachers ask the student to duplicate the skill. Van Merriënboer (2013) argued that providing support to students is highly valuable in helping them expand their problem solving skills. Support in the use of calculator use can include help with skills such as graphing, reading tables, and solving equations.
Teachers can aid students in making the most of their observation skills. The goal is to make the students realize that they too can be good problem solvers and mathematicians. In an article describing a method on how to prepare students for problem solving, Hodges, Johnson
and Fandrich (2014) shared a strategy in which students reflected on other students’ problem solving abilities and then internalized this information and applied it to themselves. In this strategy, the teacher focuses their students’ attention on how others solve problems, how to address the issue of adversity, and where they go to find help. Afterwards, the teacher focuses the attention back to the student. The subsequent questions would ask the student where they could get help, what would you do if you got an incorrect answer, and how would you help someone who is struggling. By focusing on other student’s good math solving qualities, the teacher is using that as a modeled event that may lead to a matching pattern.
Along with the power of observation, the ability to self-reflect is a human function that enables individuals to analyze past behaviors and muse over their thoughts (Bandura, 1998). This is important in problem solving because the multiplicity of answers students are capable of producing require a knowledgeable teacher who can identify, interpret, evaluate, and remediate answers when conducting error analysis work (Peng & Luo, 2009). Teachers can empower mathematics students by helping them identify the existence of their errors, assisting them to understand and interpret their work, encouraging self-evaluation of performance, and presenting teaching strategies to eliminate errors. Each of these problem-solving actions can help students resolve mathematical setbacks better.
In mathematics, correcting errors using self-reflection is a common occurrence that requires individuals to take into account past learning to reflect on whether a current answer is plausible or not. As students reflect on their ability and confidence to use the graphing
calculator, they come to conclusions concerning their problem-solving abilities. Graham, Headlam, Honey, Sharp, and Smith (2003) concluded that familiarity with a graphing calculator was a deciding factor in its usage. Additionally, students need to decide whether the time spent
on a calculator is worth the effort to solve the problem. This is a critical area for further research because different calculators have differing amounts of steps they use when solving a problem.
Attention is tuning into pertinent aspects of a modeled activity (Bandura, 1998). Factors such as attraction, chunking information, and cognitive skills affect the level of attention. In mathematics, the observed information sometimes comes too quickly for assimilation and students need multiple examples to learn the presented material. This repeating strategy avoids fragmentary observations and ensures the modeling is best suited for the cognitive capabilities of the observer or student (Bullock, 1983). As applied to graphing calculators and problem solving, teachers would do well to provide multiple layered examples.
In order for modeled activities to translate into matching behavior, retention is necessary – since, as Bandura (1998) aptly noted, it would be impossible to perform a forgotten task. This property of observation is effective when symbolic representation of an event occurs, facilitating the remembrance of information in a format easily restored. The power of imagery, the symbolic representation, should precede verbal representation when presenting to students new
unsolidified concepts. The purpose is to build a memory bank of information that aids the student in future problem solving endeavors. Symbolic representations are relevant to
mathematics, specifically image representation. Image representation happens when a student observes a process occurring and then visualizes the sequences of steps necessary to reproduce the action. For example, the teacher displays a graphing calculator screen on the board and then proceeds to explain how to graph a linear problem (y = mx + b). The student, relying on the image representation, recreates the problem with another example provided by the teacher.
Similarly, verbal representations of observational learning are effective because the processes that control behavior are predominantly conceptual (Bandura, 1998). The fact that
learning mathematics is similar to learning a new language makes verbal representation a vital part of teaching mathematics. Eighty years ago, students faced the same problem current students do, in that there are words whose meanings in English and in mathematics are very different (Moulton, 1946). Base, vertical, and degree are a few examples of mathematics vocabulary terms that have dual definitions with regular English definitions. A complete and thorough understanding of vocabulary words is an essential aspect in learning mathematics (Oldfield, 1996). One helpful piece to effective representation is that mathematical language should come as second nature to teachers. They should use correct terminology in fluid
conversation and encourage students to do likewise. The downfall is that verbal representations can be more easily forgotten, thereby requiring rehearsal to store the information.
As representations or modeled events go from observation to practice, the production process becomes necessary because it provides the learner with a chance to see if the observed learning produces a faultless performance (Bandura, 1998). When mathematics teachers check for understanding in problem solving, they are checking to see if the observed learning produced work that is free from error. As teachers find errors, the next round of observational learning concentrates its efforts in those places to eliminate the error.
Motivational Factors Influencing Problem Solving
Motivational factors are relevant because students make judgments about whether they will even attempt to problem solve specific mathematics content. As such, researchers need to consider internal or external motivational influences that encourage behavior, which include problem-solving behavior.
Inherent within any environment are incentives and disincentives. Incentives play a role in education, and though extrinsic rewards lose their appeal over time, nevertheless, a variety of
incentives are helpful to keep students interested in a classroom (Haywood, Kuespert, Madecky, & Nor, 2008). The lack of incentives and presence of disincentives can have a detrimental effect on efficacy and play a role in education. When students perceive academic challenges as a threat instead of an opportunity to learn, this can serve as an overall disincentive that affects an
individual’s efficacy within the classroom (Schweinle, Turner, & Meyer, 2006). This previous study shows that many students have the knowledge, skills, and tools they need to be successful, yet lack the motivation to act upon their ability.
Shukla, Tombari, Toland, and Danner (2015) conducted a study of over 1,500 ninth-grade students of diverse backgrounds and found that students’ perceptions of at-home support by the parent(s) was strongly associated with the student’s personal mastery. In other words, within the relationship between parent and student, internal motivation for success within a mathematics classroom exists. Furthermore, parents are capable of building an academic schema developed outside the school walls that promotes academic ambitions. Garg, Melanson, and Levin’s (2007) study on the effects of parenting on the educational aspirations of adolescents built a case that parental background, participation, and behavior provides an environment in which adolescents can develop an academic self-schema that influences educational aspirations. This is important because students do not come to school void of internal motivations and this impacts classroom engagement in problem solving activities.
Interestingly, concerning the dual impact on math and technology, parents surveyed in Kansas and Missouri were quick to say that the United States lags behind other countries in math, but they were complacent in their perceptions, saying that math and technology are fine as they are (Kadlec & Friedman, 2007). These parental perceptions are important because of the changing reality of graphing technologies and its impact on education. Additionally, at the
parental level, Ing (2014) collected data from a nationally represented longitudinal survey and noted that simply informing parents on their child’s progress is not enough to raise persistence and achievement levels. However, having students teach their parents the mathematics they are using in a project strikes closer to the goal of creating a situation that leads to greater
involvement in science, technology, engineering, and mathematics careers.
Two additional sources of internal motivation are the pleasure of getting praise from others and the satisfaction provided by the need to engage in activities that promote self-esteem (Bandura, 1998). For example, praise can come from both teachers and parents as a response to attainment of a high grade on a test. System wide, a school can promote activities concerning self-esteem by incorporating interventions that target perceptions of justice, because within the school environment justice is of particular importance to students’ global self-esteem (Morin, Marsh, Maiano, Nagengast, & Janosz, 2013). In adolescents, the perception of justice increases global self-esteem. Since classrooms make up the majority of the school’s environment, it is important for mathematics teachers to establish classrooms that are equitable and fair to enhance the student’s problem solving beliefs.
Both self-efficacy and self-esteem are important to academic success (Kandemir, 2014). In a study of seventh-grade students’ self-efficacy concerning mathematics, Chiu et al. (2008) found that students compared themselves most frequently to other students that performed similarly to themselves. The external act of comparison to others, whether perceived to be greater or lower than them, had an effect on their self-esteem; consequently, those in a high academic track exhibited higher self-concepts than those in lower tracks. The multiplicity of sources that influence self-esteem present problems in identifying confounding variables that
contribute to the problem of measuring esteem, making the independent nature of self-efficacy a desired measurement for perceived mathematics abilities.
Intrinsic and extrinsic motivation affect incentives to behaviors. Intrinsic motivation is a desire to carry out a behavior for its own sake and extrinsic motivation is a desire to carry out a behavior in order to receive a set reward or avoid a threatened punishment (Myers, 2014). Intrinsic motivational studies concerning math have shown that students with lower levels of motivation also experienced lower achievement levels and less math course accomplishments (Gottfried, Marcoulides, Gottfried, & Oliver, 2013). Threats to intrinsic motivation cause students to shut down and Thompson (2014) asserted that teachers who create anticipation and curiosity cause students to be in a receptive mode of learning.
Extrinsic motivators such as a paycheck, approval, privileges and penalties are socially arranged phenomena that encourage certain behaviors in individuals. Parents are an important source of motivation and Fan, Williams, and Wolters (2012) discussed a negative correlation across ethnic groups, stating that frequent school/parent communication resulted in less confidence in school engagement and academic problems. The probable explanation for this, according to Fan et al. (2012), is that the parents were most likely providing discouraging and punitive feedback for the students. Bissell-Havran and Loken (2007) found that among adolescents, the tendency was to view intrinsic motivation as lower among peers. Students under-perceived their friends’ actual value on academics.
The consequence of failing to establish a perception of justice in the school environment leads to lower levels of self-esteem. This has consequences that affect the outcomes of teaching because students who are not socially confident are more likely to avoid seeking help (Ryan & Pintrich, 1997). Therefore, internal motivation is important to consider. As a motivational
factor, students’ ability to seek assistance during their struggles with problem solving influences learning within a classroom.
External influences that motivate behavior can take the form of rewards and tangible benefits, praise, and other positive or negative reinforcers (Iben, 1991; Kitsantas, 2002).
Students who are slow in math computations may view the calculator as an external motivator to help them in their problem solving. In the mathematics classroom, external rewards can take the form of grades, report cards, praise from the teacher, status within the classroom, threats of punishment, and positive or negative phone calls home, among others. Concerning external rewards, Reeves and Taylor-Cox (2003) discussed a reward system that promoted good work habits among middle school students. The system worked when students did extra problems to earn stars for rewards.
External rewards are present in educational games that use badges to track progress, which are viewable to both the teacher and other students (Abramovich, Schunn, & Higashi, 2013). Steel and MacDonnell (2012) explained that the manner in which people receive rewards matters just as much as the reward itself, noting that effective rewards are transparent (without guile), clearly communicated, and easy to follow. One benefit is that extrinsic motivators have the capability to introduce intrinsic motivation, which causes the behavior to persist even after the removal of rewards. Teachers can use available online mathematics curricula, such as the Compass, Khan Academy, and Classzone.com curriculum, that has rewards systems built into the program and allows students to use their graphing technology to solve problems. In addition, Gasser (2011) encouraged teachers to use fun and interesting applications as a brain based approach to teaching because it spurs motivation.
Enactive Learning and the Graphing Calculator
Enactive learning is learning through the experiences or performances themselves (Bandura, 1986). Factors that govern how actions translate into learning include obtaining information from the actions that further guide individuals into achieving their purposes. For example, Hillman (2012) recorded the process of enactive learning using the graphing calculator as he observed a teacher providing time for students to complete an activity with the graphing calculator. Once the activity was completed, the teacher inquired of the students their solutions and the steps they took to arrive at their conclusion. The ensuing conversation allowed students to make connections between graphical (via the graphing calculator) and mathematical symbols (their equations).
A benefit to this approach to student learning and problem solving is that they can examine what went wrong and know what to fix in subsequent attempts. Likewise, a benefit to teachers in allowing the use of this enactive learning experience is that students can use the graphing calculators as a means to do arduous calculations, and they can verify their conjectures (Hillman, 2012).
Enactive learning with graphing calculators can be refined with immediate feedback that allows behavior patterns to adapt quickly (Bandura, 1998). Graphing calculators lend
themselves readily to the refinement process of enactive learning since the feedback is
immediate, predicative, and clear. The use of graphing calculators provides both predictable and clear observations in mathematics and allows students to draw conclusions. In McCulloch’s (2008) research, the graphing calculator aided student decision-making schemas in solving a calculus problem. Of particular interest was the way the refinement process was marked by changes in displayed emotions. When students interpret the graphing calculators, they can
experience a set of emotions (confusion, comfort, guilt, relief, and happiness) that is a visual display of where they are in the problem. The sequence of functions performed on a graphing calculator may need to be refined through trial and error so that students achieve their desired outcome via the clear observation of the data.
Examination, testing, and implementation of new concepts show enactive learning in problem-solving (Cozza & Oreshkina, 2013). Interestingly, students across the globe used these three cognitive skills to problem solve in math and used the results to see if they needed to start the process over again as they refined their work. This shows that enactive learning can occur via steps that students go through in their problem solving experience.
Problem Solving
Students’ perceptions of their problem-solving abilities are of great interest to educators, given the fact that social cognitive theory discusses how one’s schemas and expectations can interact with one’s environment to influence behavior (Myers, 2014). Heppner and Krauskopf (1987) described problem solving as the intricate weaving of cognitive, affective, and behavior processes with the aim of adapting to internal and external challenges. The National Council of Teachers (2015) views problem solving as mathematical tasks that potentially provide
intellectual challenges aimed to enhance student understanding and development.
Heppner and Baker (1997) further defined problem solving as self-assurance while engaged in a diverse range of problem-solving tasks. Liu (2011) likened problem solving not as a science, but rather an art; requiring practice and sustained effort for progress. This is very similar to self-efficacy. Self-efficacy is a personal reflection of the ability or capability a person holds to concerning the control of a specific task by use of sustained effort and resourceful use of their skills (Bandura, 1993, 1997). The mathematics classroom challenges students with daily
problem-solving demands that require constant monitoring. A fundamental element to the human experience is the desire to control the events that surround an individual or group.
Controlling the events surrounding the problematic nature of mathematics is not always easy, as the nature of mathematics involves a person searching for and finding patterns and relationships within concepts, which produces a natural state of uncertainty within the mind (Lovin et al., 2012). Cognitively speaking, uncertainty is a disagreeable state of mind that produces anxiety and numerous other negative feelings, including apprehension and apathy, among others (Bandura, 1997). To counter such uncertainty, technology literacy skills have increased and found their way into the mathematics classroom, reducing the anxiety students and teachers experience (Sun & Pyzdrowski, 2009; Tatar, Zengin, & Kagizmanh, 2015). Technology can ease the anxiety that students feel when searching for patterns and relationships within mathematical concepts.
There exists a strong correlation between problem-solving confidence and efficacy. In a study of preservice teachers, Memnun, Akkaya, and Haciomeroglu (2012) found that a
significant relationship existed between mathematical problem solving and self-efficacy. In other words, teachers’ beliefs concerning their grasp of mathematical reasoning skills required for problem solving affected their self-efficacy concepts.
The connection between problem-solving benefits and efficacy is relevant in that, according to Bandura (1997), efficacy is an effective tool for predicting the outcomes of behaviors of repetitive nature. This is central to the mathematics and graphing calculator experience because every student has both efficacy beliefs and mathematics performances; each of which can be positive or negative. Although efficacy was not the focus of this study, its effects on problem solving are relevant. When efficacy beliefs and outcome expectancies are
both positive, a person often experiences productive engagement, aspiration, and personal satisfaction. In the case of positive efficacy but negative outcomes of performance, the resulting experience can lead to grievance, protest, and even social activism. When both efficacy and outcomes are negative, the results can be resignation or apathy. Lastly, when the efficacy is negative and the outcome performance positive, it can produce despondency and self-devaluation.
Heppner and Baker (1997) stressed that educators should be interested in increasing both content knowledge and students’ problem-solving abilities. Educational technology influences problem-solving abilities and performance (Tajuddin, Tarmizi, Konting, & Ali, 2009). Heppner and Baker’s study found that increased availability and use of calculator technology in the mathematics classroom improved the ways students can efficiently solve math problems. Specifically, the graphing calculator decreased the number of steps it took to solve problems, thereby increasing the accuracy and precision by which students solved problems. This alone did not account for better problem-solving abilities, since the students’ meta-cognitive
awareness, as measured by student self-checking, was significantly higher than the control group. This implied that the graphing calculator, as it assisted students’ writing of linear
equations, helped with the problem-solving abilities of the students and increased their academic achievement. The framework of the Social Cognition theory encompasses the graphing
calculator, since it affects both a person’s cognitive and social environment.
Concerning confidence in problem solving, Huebner (2009) noted the difference in male and female involvement in the physical sciences. To counter the male dominated careers stemming from math and science, the author proposed that teachers remind their students that intellectual abilities are not rigid and that specific informational feedback is important in
building confidence. This includes formative feedback, which provides timely feedback to students by targeting desired academic goals and informing students of their progress towards it. To aid in the confidence building responsibility of the teacher, Ayodele (2011) recommended that teachers provide a collaborative environment in which male and female students work cooperatively so that they maintain mathematical equity in performance. Ayodele concluded that performance in mathematics moderately resulted from student self-concept and that teachers should pay more attention to problem-solving skills in order to produce better results in
mathematics. Better attention to the problem-solving approach improved the academic outcomes of girls in a study conducted by Perveen (2010). In Perveen’s problem-solving approach, versus the expository strategy, the girls who were taught using a problem-solving approach performed better on the posttest and led the author to believe that problem solving is a means to enhance the teaching of mathematics at the secondary level.
Literature Review
In math, a problem differs from an exercise in the following manner. According to Musser, Burger, and Peterson (2001), an exercise involves a routine procedure to arrive at a response, while a problem is one that requires thought, reflection, and ingenuity to derive the answer. There are several stages involved in problem solving, including general orientation, definition of the problem, production of alternatives, decision-making, and evaluation (Heppner & Peterson, 1981). According to Liu (2011), of the stages involved in problem solving, getting started (orientation) appears to be the most difficult step.
Polya (1957) posited that teachers who use only drills hamper the intellectual
development of mathematics students as problem solvers. He argued that independent thinking results from students solving problems that are proportionate to their knowledge base. In his
authoritative book on problem solving, Polya delineated four steps that educators can use, namely, (a) understanding the problem, (b) devising a plan, (c) carrying out the plan, and (d) looking back.
Understanding the problem involves the consideration of what is the unknown, and understanding the data and the conditions to the problem (Polya, 1957). A person demonstrates understanding of the problem when they can eliminate redundant information, accurately assess insufficient data, and understand the various parts of the conditions to the problem. Musser et al. (1957) added to the discussion by encouraging the problem solver to paraphrase the problem.
Devising a plan requires a strategy that purposefully makes a connection between the data and the unknown (Polya, 1957). The plan compares the problem with a previous solved example and seeks to either solve the problem at once or breaks it down to manageable chunks. Musser et al. (2001) listed strategies that are employed in this step. They include (a) use guess and check, (b) use a variable, (c) draw a picture, (d) use a pattern, (e) use a list, (f) reduce the problem, (g) use direct and indirect reasoning, (h) use properties of numbers, (i) work
backwards, (j) use cases, (k) use formulas or equations, (l) use a model, (m) use dimensional analysis, (n) use sub-goals, and (m) graph it. Examples of how the graphing calculator aids in these strategies are discussed in the following section.
After a problem solver makes a purposeful connection, s/he needs to carry out the plan and check the completed work at each stage (Polya, 1957). Sometimes a change of direction and strategy is required (Musser et al., 2001). Staying with a problem, or allocating an appropriate time to complete the problem, is necessary for success in problem solving.
Lastly, checking the results or the argument allows the problem solver to examine the correctness of the solution. One benefit of checking the solution is that it allows the solver a
chance to see if there was an easier or different way to solve the problem (Musser et al., 2001; Polya, 1957). An additional benefit is that extensions to the problem can be found that could aid in future problems.
Problem Solving Strategies Using the Graphing Calculator
The graphing calculator can aid students in taking a guess and testing the answer in various ways. For example, if a situation arises in which the student needs to find the answer to a system of equations, the student can graph the function and see the approximate location. The student can then take an educated guess on the location of the intersection and try to solve the equations in this manner. This method is useful for taking educated guesses, but other situations are present in which the student uses random answers. One goal in using this strategy is to improve and refine consecutive guesses until the correct answer is tested and found. This strategy has positive effects on test taking when there are a limited number of possibilities. This is because the student can systematically rule out answers such as the distracters (Hong, Sas, & Sas, 2006).
Graphing calculators are convenient for manipulating variables, expressions, and equations. In mathematics, students face situations for which they could guess an infinite number of times. When this is the case, it is better to use a variable and set up equations that solve the appropriate mathematics. This strategy is effective when the problem employs an unknown number or set of numbers. It is also useful when a person needs a general rule.
Draw a picture or diagram of the situation can be helpful in problem solving (Musser et al., 2001). When the problem involves a physical situation, drawing a picture usually leads to a better understanding of the problem. The TI-83 Plus graphing calculator can do this well in