Force Mix Analysis in the Context of the Canadian Armed Forces
Michel Couillard, Lise Arseneau, Cheryl Eisler, Ben Taylor Defence Research and Development Canada, Ottawa, Canada
Abstract
The Vice Chief of the Defence Staff and the Chief of Military Personnel are sponsors for the Canadian Armed Forces (CAF) Establishment Study reviewing the size and composition of the CAF establishment to ensure that it is affordable, sustainable and positioned to meet its operational requirements. A significant component of this study is a force mix analysis quantifying the ability of the CAF establishment to meet the requirements of six high priority missions outlined in the Canada First Defence Strategy (CFDS). This paper presents the methodology and some illustrative results of this force mix analysis. Two techniques are used to estimate the demand on the CAF establishment based on a set of the most likely concurrent CFDS missions. First, a constrained demand is obtained by using an approach based on historical missions. Then, a complementary unconstrained demand is estimated through an approach associating a set of desired force elements to each CFDS mission. By contrasting these demands to the CAF establishment, key shortfalls in personnel occupation groups can be identified.
Keywords: Force Mix Analysis, Occupation Groups, Military Establishment
1. Introduction
The Vice Chief of the Defence Staff and the Chief of Military Personnel are sponsors for the Canadian Armed Forces (CAF) Establishment Study reviewing the size and composition of the CAF establishment to ensure that it is affordable, sustainable and positioned to meet its operational requirements. A significant component of this study, conducted by Defence Research and Development Canada (DRDC), is a force mix analysis quantifying the ability of the CAF establishment to meet the requirements of six high priority missions outlined in the Canada First Defence Strategy (CFDS) [1]. Through this analysis, the CAF establishment is broken down into occupation groups and key personnel shortfalls are identified by comparing the available personnel supply to the personnel demands generated by various combinations of the CFDS missions.
Such a force mix analysis problem is similar to previous work related to workforce planning where the objective is to close any gaps between the resources an organization needs to carry out its mission (demand) and the resources it has (supply) [2]. Several papers discuss various types of approaches and their applications to organizations in the United Kingdom [3], the United States (US) public sector [4], Australia’s health workforce [5], and the US Department of Defense [6]. DRDC has also developed several models investigating various aspects of the military workforce. The Enhanced Risk Assessment Model (EnRAM) is a force structure tool trying to capture all tasks assigned to the Air Force and determine the best occupational mix required to meet them based on an assessment of risk [7]. Although it may have been possible to extend EnRAM to consider the CAF, this model is very data intensive and the anticipated work was not within the timelines for the CAF Establishment Study. Another simulation model was developed in [8] to address in broad terms the CAF personnel requirements to sustain up to three battle group-size operations continuously. Other work by DRDC includes the development of a proof-of-concept discrete-event simulation model for assessing the ability of the CAF to sustain operations from a human resources perspective and applied to a contingency analysis of sustaining Task Force Afghanistan [9], the development of a force readiness simulation tool called the Managed Readiness Simulator (MARS) that allows the user
32nd International Symposium on Military Operational Research June 23, 2015
DRDC-RDDC-2015-P045
© Her Majesty the Queen in Right of Canada, as represented by the Minister of National
Defence, 2015
© Sa Majesté la Reine (en droit du Canada), telle que représentée par le ministre de la
Défense nationale, 2015
to simulate a wide range of scenarios to forecast the extent to which the resources of an establishment are available to fulfill the requirements of a set of planned tasks over time [10], and finally, the development of the Tyche Fleet Mix Model that provides the most effective mix of maritime fleet assets to address multiple demand scenarios [11].
The force mix analysis presented in this paper refined some of the work conducted in [8] and differs from other previous work by using two techniques to estimate the demand on the CAF establishment based on a set of the most likely concurrent CFDS missions. First, a constrained demand is obtained by using an approach based on historical missions. Then, a complementary unconstrained demand is estimated through an approach associating a set of desired force elements to each CFDS mission. By contrasting the range of demands to the CAF establishment, key shortfalls in personnel occupation groups are identified.
The intent of this paper is to illustrate the methodology used to conduct the force mix analysis. To ensure that this paper remains at the unclassified level, the numbers used for the supplies and demands were randomized. The occupation groups identified as experiencing shortfalls are therefore illustrative only. The remainder of this paper is organized as follows. Section 2 describes the key CFDS missions and presents the results of a concurrency analysis defining which scenarios are to be considered in the force mix analysis. Section 3 breaks down the CAF establishment into various components to identify the supply of personnel available to meet the requirements of emerging CFDS missions. The estimation of the personnel demands created by each CFDS scenario is considered in Section 4. The personnel supplies and demands are then combined in Section 5 to identify the key shortfalls in occupation groups. Concluding remarks are made in Section 6.
2. Canada First Defence Strategy
The objective of the force mix analysis described in this paper is to assess if the current CAF establish-ment is able to meet its emerging operational requireestablish-ments. These operational requireestablish-ments are outlined in the white paper entitled the Canada First Defence Strategy [1]. This national strategy defines six core missions assigned to the CAF. These core missions are:
• Mission 1: Conduct daily domestic and continental operations;
• Mission 2: Support a major international event in Canada, such as the 2010 Olympics;
• Mission 3: Respond to a major terrorist attack in Canada;
• Mission 4: Support civilian authorities during a crisis in Canada, such as a natural disaster;
• Mission 5: Lead and/or conduct a major international operation for an extended period; and
• Mission 6: Deploy forces in response to crises elsewhere in the world for shorter periods.
To better represent the CAF operational requirements, it is important to consider that these six CFDS missions can occur concurrently. The likelihood of various CDFS missions happening simultaneously was previously assessed in [12, 13]. These concurrency analyses were based on historical CAF missions docu-mented in a database containing as complete as possible all the unclassified CAF operations from 1945 to 2012, including both domestic and international operations [14, 15]. A subset of this database containing missions conducted from 1990 to 2012 was used to assess the most likely concurrent CFDS missions. All the operations belonging to this subset were aligned to the six CFDS missions and each CFDS core mission was assigned a random frequency and a random duration based on the associated historical operations. The concurrency analysis was conducted with the DRDC stochastic scheduling model Tyche [11] which randomly generated events over a five year time period with no restriction on the number of concurrent events. By repeating the process 1000 times, average expectations for event occurrences were calculated. The number of repetitions was chosen arbitrarily, but was deemed sufficient to capture the random behavior of the process. In order to generate likely combinations of CFDS missions to quantify the operational requirements of the CAF, it was decided to exclude ongoing operational commitments such as Search and Rescue and
NORAD commitments, operations that occur almost 100% of the time such as the Standing NATO Maritime Group 1, certain long-running commitments such as the US Carrier Battle Group, and airlift operations. This decision was made as otherwise, the likely combinations obtained would mainly consist of ongoing operations and the percentage of the CFDS mission combinations of interest would occur in the simulation less than 1% of the time.
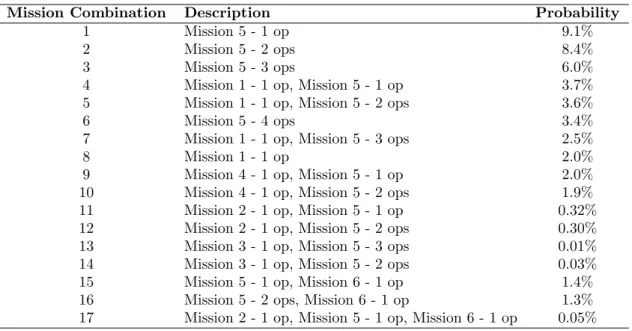
The set of concurrent CFDS missions obtained in [13] was used for this force mix analysis and is summa-rized in Table 1. The first 10 combinations of CFDS missions are those that occurred the most frequently in the Tyche simulation. In these top 10 combinations, none included CFDS mission 2, CFDS mission 3 and CFDS mission 6. Therefore, additional combinations were added to the 10 most likely for completeness. These added combinations were the two combinations that included a CFDS mission 2 that occurred the most frequently in the simulation, the two combinations that included a CFDS mission 3 that occurred the most frequently in the simulation and the two combinations that occurred the most frequently and included a CFDS mission 6. In addition, the last combination described in Table 1 represents the situation that occurred in 2010 when the CAF were simultaneously tasked to support the Vancouver Olympics (mission 2), were sent to Haiti to provide disaster relief (mission 6) and were still engaged in Afghanistan (mission 5).
Mission Combination Description Probability
1 Mission 5 - 1 op 9.1%
2 Mission 5 - 2 ops 8.4%
3 Mission 5 - 3 ops 6.0%
4 Mission 1 - 1 op, Mission 5 - 1 op 3.7%
5 Mission 1 - 1 op, Mission 5 - 2 ops 3.6%
6 Mission 5 - 4 ops 3.4%
7 Mission 1 - 1 op, Mission 5 - 3 ops 2.5%
8 Mission 1 - 1 op 2.0%
9 Mission 4 - 1 op, Mission 5 - 1 op 2.0%
10 Mission 4 - 1 op, Mission 5 - 2 ops 1.9%
11 Mission 2 - 1 op, Mission 5 - 1 op 0.32%
12 Mission 2 - 1 op, Mission 5 - 2 ops 0.30%
13 Mission 3 - 1 op, Mission 5 - 3 ops 0.01%
14 Mission 3 - 1 op, Mission 5 - 2 ops 0.03%
15 Mission 5 - 1 op, Mission 6 - 1 op 1.4%
16 Mission 5 - 2 ops, Mission 6 - 1 op 1.3%
17 Mission 2 - 1 op, Mission 5 - 1 op, Mission 6 - 1 op 0.05%
Table 1: CFDS mission combinations
3. Supply
To determine how well the CAF is able to meet the demands of the CFDS scenarios identified in Section 2, it is necessary to find out how many CAF members are available to deploy and support operations. A departmental mapping study was conducted in [16] to breakdown the CAF establishment in multiple components, including an emerging CFDS operations component identifying the number of CAF personnel available to meet any emerging requirements. This departmental mapping was used for the force mix analysis in this paper and is shown in Figure 1. The CAF establishment based on the Regular Force was first broken down into two groups: a non-effective group (personnel in training, on leave, etc...) and an effective group made of the personnel able to contribute to the CAF commitments. This effective group was then further broken down into personnel contributing to the institutional capabilities of the CAF (providing training, acquiring and servicing equipment, etc.) and personnel contributing to military operations. In line with Section 2 where the ongoing operations were considered separately from the emerging CFDS missions, the
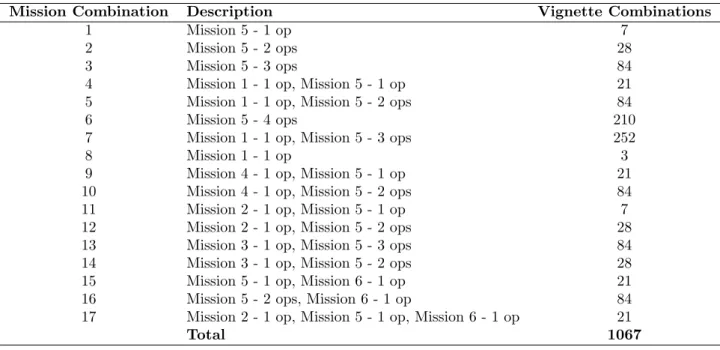
For each CFDS mission, the required sets of force elements were obtained from two sources: 1) the short term CAF readiness planning process of the Strategic Joint Staff; and 2) the long term force development process of the Director General Capability and Structure Integration. As some CFDS missions were assigned multiple courses of action, multiple vignettes containing different sets of force elements were obtained. The number of vignettes per CFDS mission is summarized in Table 5. By exhaustively combining these vignettes (with repetition) to build the scenarios outlined in Table 1, a large number of scenario variations were obtained. The number of scenario variations for each CFDS mission combination is presented in Table 6.
CFDS Mission Number of Force Element Vignettes
1 3 2 1 3 1 4 3 5 7 6 3
Table 5: Number of vignettes containing different sets of force elements for each CFDS mission.
Mission Combination Description Vignette Combinations
1 Mission 5 - 1 op 7
2 Mission 5 - 2 ops 28
3 Mission 5 - 3 ops 84
4 Mission 1 - 1 op, Mission 5 - 1 op 21
5 Mission 1 - 1 op, Mission 5 - 2 ops 84
6 Mission 5 - 4 ops 210
7 Mission 1 - 1 op, Mission 5 - 3 ops 252
8 Mission 1 - 1 op 3
9 Mission 4 - 1 op, Mission 5 - 1 op 21
10 Mission 4 - 1 op, Mission 5 - 2 ops 84
11 Mission 2 - 1 op, Mission 5 - 1 op 7
12 Mission 2 - 1 op, Mission 5 - 2 ops 28
13 Mission 3 - 1 op, Mission 5 - 3 ops 84
14 Mission 3 - 1 op, Mission 5 - 2 ops 28
15 Mission 5 - 1 op, Mission 6 - 1 op 21
16 Mission 5 - 2 ops, Mission 6 - 1 op 84
17 Mission 2 - 1 op, Mission 5 - 1 op, Mission 6 - 1 op 21
Total 1067
Table 6: Number of vignette combinations considered for each CFDS scenario.
After having created various sets of CFDS force elements, method two then maps each force element to its required personnel levels to create total personnel demands for each CFDS mission. The personnel mapping was done in terms of officers and NCMs, both grouped according to the occupation groups outlined in Table 2. To complete this mapping from force element to personnel, access to various human resources databases was made possible by the Directorate Capability and Structure Analysis Support. Most personnel estimations were based on the current staffing of each force element, but historical manning data had to be used in the case of some force elements that existed only during active expeditionary operations, such as during Canada’s commitment in Afghanistan. The total personnel demand related to the CFDS mission 4 force elements outlined in Table 4 is shown in Figure 4.
6. Conclusions and Future Work
This paper presented the methodology and some illustrative results of the force mix analysis component of the CAF Establishment Study assessing if the current occupation group structure of the CAF can meet the operational commitments outlined in the Canada First Defence Strategy. Two techniques were used to estimate the demand on the CAF establishment based on a set of the most likely concurrent CFDS missions. First, a constrained demand was obtained by using an approach based on historical missions. Then, a complementary unconstrained demand was estimated through an approach associating a set of desired force elements to each CFDS mission. By contrasting these demands to the CAF establishment personnel supply, key shortfalls in personnel occupation groups were identified.
To ensure that this paper remained at the unclassified level, the numbers used for the supplies and demands were randomized. The occupation groups identified as experiencing shortfalls are therefore illus-trative only. For the officers, both demand estimation methods identified shortfalls in the occupation groups NO, OTH (public affairs), NTS, ISR and HS. For the NCMs, shortfalls were identified by both techniques for the occupation group OTH (military police). Mitigating these personnel shortages can be done by reaching out to the institutional component of the CAF establishment and also by using Reserve Force personnel and civilians, or even by rebalancing the various occupation groups within the officers and NCMs populations.
The force mix analysis presented in this paper is currently being extended to account for the need to sustain CFDS mission 5, conduct a major international operation for an extended period of time. Although not completely realistic, the “no sustainment” assumption contained in this paper provided a way to test the methodology and gain meaningful insights into the force mix of the CAF. The “no sustainment” approach represents the lowest demand case and the occupation groups experiencing deficits under this assumption will have greater deficits in the “with sustainment” case and should be investigated as a priority.
References
[1] Department of National Defence, “Canada First Defence Strategy,” http://www.forces.gc.ca/en/about/canada-first-defence-strategy.page, 2006.
[2] G. Vernez, A. A. Robbert, H. G. Massey, and K. Driscoll, “Workforce planning and development processes, a practical guide,” RAND Corporation, Santa Monica, CA, USA, Tech. Rep. ISBN 978-0-8330-8597-9, 2007.
[3] J. S. Edwards, “A survey of manpower planning models,”Journal of Operational Research Society, no. 34, pp. 1031–1040, 1983.
[4] M. Anderson, “The metrics of workforce planning,”Public Personnel Management, no. 33, pp. 363–378, 2004.
[5] I. F. Crettenden, M. V. McCarty, B. J. Fenech, T. Heywood, M. C. Taitz, and S. Tudman, “How evidence-based workforce planning in Australia is informing policy development in the retention and distribution of the health workforce,”Human Resources for Health, no. 12, pp. 2–27, 2014.
[6] S. Nataraj, C. Guo, P. Hall-Partyka, S. M. Gates, and D. Yeung, “Options for Department of Defense total workforce supply and demand,” RAND Corporation, Santa Monica, CA, USA, Tech. Rep. ISBN 978-0-8330-4006-0, 2014.
[7] P. E. Desmier and D. C. Sexstone, “Force structure analysis: The EnRAM model,” Defence Research and Development Canada, Ottawa, ON, Canada, Tech. Rep. 2003/05, 2003.
[8] P. Bender, “Towards a sustainable CF: A risk analysis model,” Defence Research and Development Canada, Ottawa, ON, Canada, Tech. Rep. 2005/10, 2005.
[9] P. Moorhead, A. Wind, and M. Halbrohr, “A discrete event simulation model for examining future sustainability of Canadian Forces operations,” inProceedings of the 2008 Winter Simulation Conference, 2008, pp. 1164–1172.
[10] C. Scales, S. Okazawa, and M. Ormrod, “The managed readiness simulator: A force readiness model,” inProceedings of the 2011 Winter Simulation Conference, 2011, pp. 2519–2529.
[11] C. Eisler and D. Allen, “A strategic simulation tool for capability-based joint force structure analysis,” inProceedings of the 1st International Conference on Operations Research and Enterprise Systems, 2012, pp. 21–30.
[12] C. Eisler. and E. Pelletier, “Scenario frequency and concurrency analysis,” Defence Research and Development Canada -Centre for Operational Research and Analysis, Ottawa, ON, Canada, Tech. Rep. LR 2012-109, 2012.
[13] L. Arseneau and C. Eisler, “CAF Establishment Study Phase II, Fall 2014 Progress Update,” Defence Research and Development Canada - Director General Military Personnel Research and Analysis, Ottawa, ON, Canada, Tech. Rep. SL 2015-L157, 2015.
[14] D. W. Mason, “The Canadian Five-W database,” Defence Research and Development Canada - Operational Research Division, Ottawa, ON, Canada, Tech. Rep. RN 2004-10, 2006.
[15] K. Grant, “International Canadian Forces operations from 1990-2011: Supplemental update to the Five-W database,” Defence Research and Development Canada - Centre for Operational Research and Analysis, Ottawa, ON, Canada, Tech. Rep. CR 2012-270, 2012.
[16] L. Arseneau, “CAF Establishment Study Phase II, Determination of Supply,” Defence Research and Development Canada - Director General Military Personnel Research and Analysis, Ottawa, ON, Canada, Tech. Rep. SL 2014-L229, 2014. [17] C. Eisler, “Force structure evaluation for capability-based planning,” Defence Research and Development Canada - Centre
for Operational Research and Analysis, Ottawa, ON, Canada, Tech. Rep. SR 2015-R026, 2015.