UMass Metabolic Network Publications
UMass Metabolic Network
2017-01-25
Integrated genome-wide analysis of expression quantitative trait
Integrated genome-wide analysis of expression quantitative trait
loci aids interpretation of genomic association studies
loci aids interpretation of genomic association studies
Roby Joehanes
National Institutes of Health Et al.
Let us know how access to this document benefits you.
Follow this and additional works at: https://escholarship.umassmed.edu/metnet_pubsPart of the Biochemistry Commons, Cell Biology Commons, Cellular and Molecular Physiology
Commons, Genetics and Genomics Commons, and the Molecular Biology Commons
Repository Citation
Repository Citation
Joehanes R, Tanriverdi K, Freedman JE, Munson PJ. (2017). Integrated genome-wide analysis of expression quantitative trait loci aids interpretation of genomic association studies. UMass Metabolic Network Publications. https://doi.org/10.1186/s13059-016-1142-6. Retrieved from
https://escholarship.umassmed.edu/metnet_pubs/90
Creative Commons License
This work is licensed under a Creative Commons Attribution 4.0 License.
This material is brought to you by eScholarship@UMMS. It has been accepted for inclusion in UMass Metabolic Network Publications by an authorized administrator of eScholarship@UMMS. For more information, please contact
R E S E A R C H
Open Access
Integrated genome-wide analysis of
expression quantitative trait loci aids
interpretation of genomic association
studies
Roby Joehanes
1,2,3†, Xiaoling Zhang
1,10,12†, Tianxiao Huan
1, Chen Yao
1, Sai-xia Ying
2, Quang Tri Nguyen
2,
Cumhur Yusuf Demirkale
2, Michael L. Feolo
4, Nataliya R. Sharopova
4, Anne Sturcke
4, Alejandro A. Schäffer
4,
Nancy Heard-Costa
5, Han Chen
6,10, Po-ching Liu
7, Richard Wang
7, Kimberly A. Woodhouse
7, Kahraman Tanriverdi
8,
Jane E. Freedman
8, Nalini Raghavachari
9, Josée Dupuis
1,10, Andrew D. Johnson
1, Christopher J. O
’
Donnell
1,11,
Daniel Levy
1*†and Peter J. Munson
2,13*†Abstract
Background:Identification of single nucleotide polymorphisms (SNPs) associated with gene expression levels, known as expression quantitative trait loci (eQTLs), may improve understanding of the functional role of phenotype-associated SNPs in genome-wide association studies (GWAS). The small sample sizes of some previous eQTL studies have limited their statistical power. We conducted an eQTL investigation of microarray-based gene and exon expression levels in whole blood in a cohort of 5257 individuals, exceeding the single cohort size of previous studies by more than a factor of 2.
Results:We detected over 19,000 independent leadcis-eQTLs and over 6000 independent leadtrans-eQTLs, targeting over 10,000 gene targets (eGenes), with a false discovery rate (FDR) < 5%. Of previously published significant GWAS SNPs, 48% are identified to be significant eQTLs in our study. Sometrans-eQTLs point toward novel mechanistic explanations for the association of the SNP with the GWAS-related phenotype. We also identify 59 distinct blocks or clusters oftrans-eQTLs, each targeting the expression of sets of six to 229 distincttrans-eGenes. Ten of these sets of target genes are significantly enriched for microRNA targets (FDR < 5%). Many of these clusters are associated in GWAS with multiple phenotypes.
Conclusions:These findings provide insights into the molecular regulatory patterns involved in human physiology and pathophysiology. We illustrate the value of our eQTL database in the context of a recent GWAS meta-analysis of coronary artery disease and provide a list of targeted eGenes for 21 of 58 GWAS loci.
Background
Implementation of high-resolution genotyping has led to a wave of genome-wide association studies (GWAS) of hundreds of phenotypes relevant to human health and disease [1]. Yet, the vast majority of the single nucleotide
polymorphisms (SNPs) from GWAS that are associated with clinical traits and diseases reside in non-coding re-gions [2, 3]. This means that most disease-associated SNPs do not directly influence protein structure or func-tion, but instead may act on phenotypes by affecting ex-pression of local (cis) or distant (trans) gene targets (eGenes). Thus, characterizing the relations of DNA se-quence to RNA expression is a critical step toward a better mechanistic understanding of disease, and ultim-ately toward improvements in diagnosis, prevention, and treatment. This endeavor begins with analysis of variation in messenger RNA (mRNA) expression levels associated
* Correspondence:[email protected];[email protected]
†Equal contributors
1The Framingham Heart Study and the Division of Intramural Research,
National Heart, Lung and Blood Institute, National Institutes of Health, 73 Mt. Wayte Avenue, Suite 2, Framingham, MA 01702, USA
2Mathematical and Statistical Computing Laboratory, Center for Information
Technology, National Institutes of Health, Bethesda, MD, USA Full list of author information is available at the end of the article
© The Author(s). 2017Open AccessThis article is distributed under the terms of the Creative Commons Attribution 4.0 International License (http://creativecommons.org/licenses/by/4.0/), which permits unrestricted use, distribution, and reproduction in any medium, provided you give appropriate credit to the original author(s) and the source, provide a link to the Creative Commons license, and indicate if changes were made. The Creative Commons Public Domain Dedication waiver (http://creativecommons.org/publicdomain/zero/1.0/) applies to the data made available in this article, unless otherwise stated.
with genotypic variation to identify expression quantita-tive trait loci (eQTLs) across the human genome [4].
The measurement of transcriptome-wide expression levels has facilitated several genome-wide eQTL studies [1, 4–8]. The sample sizes of some earlier eQTL studies, however, may have limited their statistical power [9], al-though a recent study [8] utilized a cohort of more than 2000 individuals and a previous study [5] used multiple cohorts totaling over 5000 individuals in meta-analysis. Of note, prior studies did not report resultstrans-eQTLs genome-wide. We report results of a microarray-based genome-wide eQTL study, considering both cis and trans elements, in whole blood samples from over 5000 participants in the Framingham Heart Study (FHS) [10, 11], a multi-generational community-based prospective study. To our knowledge, our study utilizes the largest, single-site study to date, and reports both gene-level and exon-level cis-eQTLs andtrans-eQTLs genome wide.
Results
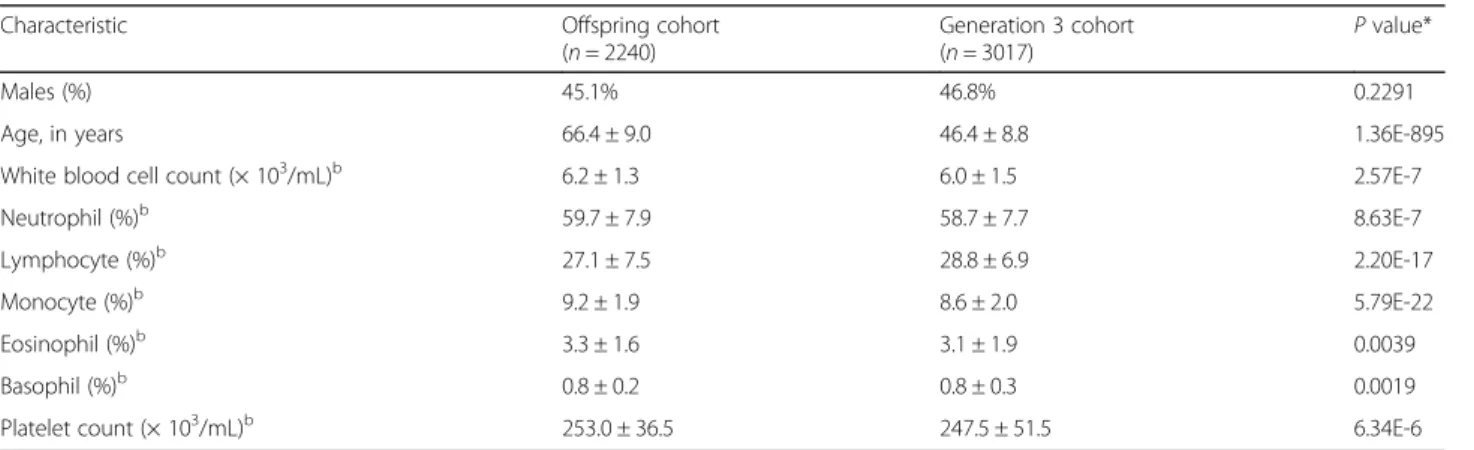
Characteristics of the study sample [10, 11] are provided in Table 1. Participants in the FHS Third Generation co-hort were about 20 years younger than those of the FHS Offspring cohort at the time of blood collection for RNA isolation. White blood cell counts and their pro-portions also differed between the cohorts.
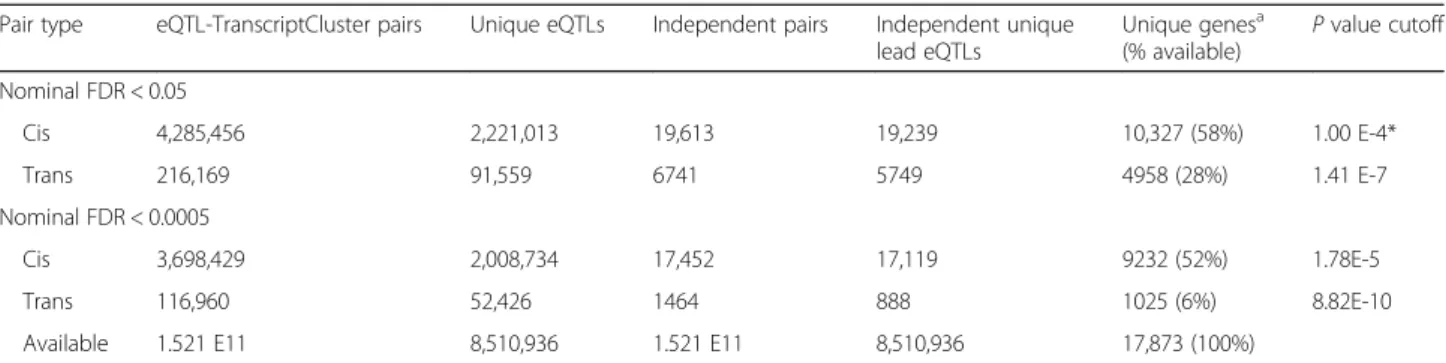
Out of 39 million imputed SNPs, we found 8.5 million with a minor allele frequency (MAF)≥0.01 and imput-ation quality R2≥0.3 (See“Methods”for further details). Of these, we identified 2.2 million cis-eQTLs and 160 thousandtrans-eQTLs at a nominal false discovery rate (FDR) < 0.05 (Table 2). We observed no inflation of the genomic control factor [12] (λ= 0.986). The quantile-quantile plot can be found in Additional file 1: Figure S1. We determined that polymorphism-in-probe effects [13], which occur when the variable position of a poly-morphism overlaps an expression probe (Additional file 1: Figure S2), were generally minor, possibly affecting
up to about 9.5% of the detected eGenes (see Additional file 1: Supplementary Methods for details). Moreover, these potential artifacts generally could be recognized by inspection of the individual exon-level results corre-sponding to that gene. Only one of the top 25 cis-eQTL-transcript cluster pairs (C9orf78, Table 4) was flagged for this artifact and that pair was not replicated in external datasets.
Recognizing that many of the significant eQTLs were in linkage disequilibrium (LD) with stronger, nearby eQTLs, we pruned our result using a stepwise linear re-gression procedure that identified a subset of the stron-gest, independent “lead-eQTLs” for each genetic region (see “Methods”). We found over 19,000 independent, lead cis-eQTLs and almost 6000 independent, lead trans-eQTLs, targeting over 10,000 cis-and almost 6000 thousandtrans-eGenes. We found an eQTL for over half of the 17,873 measured transcript clusters (Table 2, Fig. 1, and Additional file 1: Figure S3). Use of a stricter nominal cutoff of FDR < 0.0005 reduced the number of independent cis-eQTLs and the number of targeted cis-eGenes by about 8% (Table 2). The stricter cutoff had a much larger effect on the number oftrans-eGenes, redu-cing them by almost fivefold.
Cis-eQTLs are frequently defined as targeting expres-sion of genes within 1 megabase (Mb) of the transcrip-tion start site (TSS). Others have noted that cis-eQTLs may be detected beyond the 1 Mb threshold [8]. We modified our definition of cis-eQTLs to include all eQTLs falling in an uninterrupted block around the TSS, provided there are no included gaps greater than 1 Mb in size. Trans-eQTLs were defined as those that target genes on other chromosomes or genes outside the con-tiguouscis-blocks (see“Methods”for details). We found long-range cis-eQTL blocks up to 10 Mb in width, e.g. for gene BTN3A2 on chromosome 6. Such long-range cis-eQTLs were found for 255 transcript clusters, 75 of which, including BTN3A2, were located in the HLA Table 1Demographic characteristics
Characteristic Offspring cohort (n= 2240)
Generation 3 cohort
(n= 3017) P value*
Males (%) 45.1% 46.8% 0.2291
Age, in years 66.4 ± 9.0 46.4 ± 8.8 1.36E-895 White blood cell count (× 103/mL)b 6.2 ± 1.3 6.0 ± 1.5 2.57E-7
Neutrophil (%)b 59.7 ± 7.9 58.7 ± 7.7 8.63E-7
Lymphocyte (%)b 27.1 ± 7.5 28.8 ± 6.9 2.20E-17
Monocyte (%)b 9.2 ± 1.9 8.6 ± 2.0 5.79E-22
Eosinophil (%)b 3.3 ± 1.6 3.1 ± 1.9 0.0039
Basophil (%)b 0.8 ± 0.2 0.8 ± 0.3 0.0019
Platelet count (× 103/mL)b 253.0 ± 36.5 247.5 ± 51.5 6.34E-6
*Pvalues are from two-sample t-tests. For sex phenotype, thePvalue is from Fisher’s exact test
b
region of chromosome 6; 22 were identified on chromo-some X including gene ITM2A (8.7 Mb width), and 18 were found on chromosome 3 including gene UBA7 (7 Mb width). While some blocks may result from ex-tended LD structure in the genome, others may point to extended patterns of regulatory sites. Our results sup-port the conclusions of Kirsten et al. [8] who observed cis- associations extending to up to 5 Mb. In each
contiguous region of eQTLs, we defined the “lead” eQTL as that which displayed the strongest association with its target transcript cluster, as defined by P value. The lead eQTL is the most likely causal eQTL, and for cis-eQTLs, its position relative to the TSS could be read-ily studied. For some eQTL blocks, we found that not all significant eQTLs were in LD with the primary lead eQTL but that secondary, independent lead eQTLs also Table 2Number of independent, significant eQTL-gene pairs with number of unique eQTLs or unique genes withPvalue corresponding to indicated FDR cutoff
Pair type eQTL-TranscriptCluster pairs Unique eQTLs Independent pairs Independent unique lead eQTLs Unique genesa (% available) Pvalue cutoff Nominal FDR < 0.05 Cis 4,285,456 2,221,013 19,613 19,239 10,327 (58%) 1.00 E-4* Trans 216,169 91,559 6741 5749 4958 (28%) 1.41 E-7 Nominal FDR < 0.0005 Cis 3,698,429 2,008,734 17,452 17,119 9232 (52%) 1.78E-5 Trans 116,960 52,426 1464 888 1025 (6%) 8.82E-10 Available 1.521 E11 8,510,936 1.521 E11 8,510,936 17,873 (100%)
*Pvalue cutoff corresponding to FDR. Upper boundPvalue for pairs retained in computation was 1E-4, therefore highest attained FDR forcis-eQTLs was 0.0024
a
Transcript cluster ID is used as a proxy for genes. Only 244 genes were represented by more than one Transcript cluster IDs. Approximately 270 Transcript cluster IDs could not be assigned to an Entrez Gene entry
Fig. 1Genomic eQTL location vs. transcript cluster location for highly significant eQTL-gene pairs (FDR < 1E-8). Bubble size is inversely proportional to the FDR. The largest bubble indicates FDR < 1E-100
could be found after accounting for the primary lead eQTL. Stepwise regression, including primary and suc-cessive independent lead eQTLs, determined a set of mutually independent lead eQTLs for each block (see
“Methods”for details). Benefits of a large cohort
Use of a very large cohort size for eQTL analysis pro-vided obvious benefits in terms of greater statistical power for discovery. To better quantify the value of co-hort size, we considered whether the number of eGenes detected in our study would be detected with a smaller cohort. We repeated the full analysis using only the FHS Offspring cohort subset (n= 2240) and separately, only the FHS Third Generation cohort subset (n= 3017). Overall (Additional file 1: Table S1), we found that as the sample size dropped by roughly half, the number of uniquecis-eGenes fell roughly proportionately, while the number of trans-eGenes declined to a much greater de-gree. Conversely, we concluded that our large sample size allowed for detection of many novel cis- and trans-eGenes. We found that our full cohort allowed detection of roughly 60% more cis-eGenes than did either smaller cohort. The full cohort detected three times to five times more trans-eGenes than did the smaller cohorts. It is clear that even with the current large cohort size, we have not yet detected all cis-eQTLs. We also found that the number of lead eQTLs (primary and secondary) per detected eGene increased using the full cohort (Addi-tional file 1: Table S1). This demonstrates the power of the larger cohort to detect possible multiple SNPs on the pathways affecting expression.
As an example of the biological relevance of increasing the number of detected eGenes, consider the SNP rs1354034, a very strong GWAS hit for platelet count and platelet volume [14]. Using the full cohort, we detected 136 trans-eGenes that are targeted by variation at this locus. At least 27 of these genes are indeed known to be platelet-specific [15]. Analysis restricted to the smaller FHS Offspring cohort alone detected only 30 transcript clusters, 11 of which are platelet specific. Thus, increasing the sample size to include both FHS cohorts more than doubled the list of platelet-related genes. Further, when we consider the overlap of detected eQTLs with the GWAS catalog (see “Clinical relevance,” below), we found that restricting the analysis to the smaller cohort reduced the overlap by 33%. Thus, the full, large cohort clearly has greater power to annotate clinically relevant SNPs. Replication and validation
We assessed our results by three methods: (1) internal validation; (2) replication of previously published results (replication rate); and (3) the proportion of our results seen in earlier published studies (validation rate). Splitting
our large sample into two roughly equally sized cohorts demonstrated an internal replication rate of 75% for cis-eQTL-transcript cluster pairs and 41% for trans-eQTL-transcript cluster pairs at the gene level, with 100% of the replicated pairs showing the same direction of change in expression (Additional file 1: Table S2).
We were able to replicate high proportions of eQTLs published in two previous eQTL studies even though they used different expression platforms. We replicated 69% of eligible cis-eQTL and 62% of trans- eQTL-tran-script cluster pairs reported by Westra et al. [5] and 66% of cis-eQTL and 29% of trans-eQTL-transcript cluster pairs reported by Liang et al. [6]. We were able to repli-cate 59% of cis- and 56% of trans- results from a more recent study that used RNA-sequencing (RNAseq) methodology to report lead eQTLs [7]. These rates are 13 and 300,000 times the expected rates, for cis- and trans-eQTLs, respectively. The P values for these rates are <1E-200. We were able to replicate 36% of eligible cis-eQTL-transcript cluster pairs and 5.2% of trans-eQTL pairs from the largest, homogenous trans-eQTL study available to date [8]. The replication rates are 78 and 30,000 times the expected rates, for cis-eQTLs and trans-eQTLs, respectively. The replication rates for the lat-ter study might have been attenuated because of differences in RNA source (peripheral blood mononuclear cells versus whole blood) and use of different expression platforms (Illumina HT array versus the Affymetrix Exon array).
We explored external validation of our independent eQTL-transcript cluster pairs in two published studies and in seven datasets across multiple tissues in the NCBI Molecular QTL Repository [2, 4–6] (referred to as
“Multiple studies” in Table 3) and in two more recent studies [7, 8] (see “Methods” for details). As expected, the cis external validation rates (Table 3) were lower than our internal validation rates. For Multiple Studies, we validated 54% of eligible lead cis-eQTL-transcript cluster pairs from our study, but only validated 2% of leadtrans-eQTL results. The direction of effect matched in 89% of validated pairs. The RNAseq-based eQTL study of Battle et al. [7] reported only the lead variant for each targeted transcript. Since we did not expect per-fect alignment with our lead eQTLs, we relaxed our matching criteria to count situations where our lead eQTL was in strong LD (R2> 0.8) with their lead variant. Using this approach, we achieved external validation for 25% of our leadcis-eQTL-eGenes pairs but only for 4% of our lead trans pairs. When comparing our results with those of Kirsten et al. [8] using the same approach, we validated 58% of our eligible, independent lead cis-eQTLs and 6% of our trans-eQTLs. We observed that 85% of lead cis-eQTLs and 93% of lead trans-eQTLs validated by Kirsten et al. [8] also showed the same direction of effect as did our study. The detection rate
and validated detection rate is dependent on the number of available probesets for the transcript, rising to a plat-eau when more than about 20 probesets are available (Additional file 1: Figure S4). Imperfect validation rates reflect a combination of factors: the potentially novel discoveries in our dataset as a result of the larger homo-geneous sample size, the use of multiple genotyping chips of lower density in the comparison studies, the lack of imputation in one other study, differences among populations, and difficulties in accurately comparing transcript expression levels measured with different platforms.
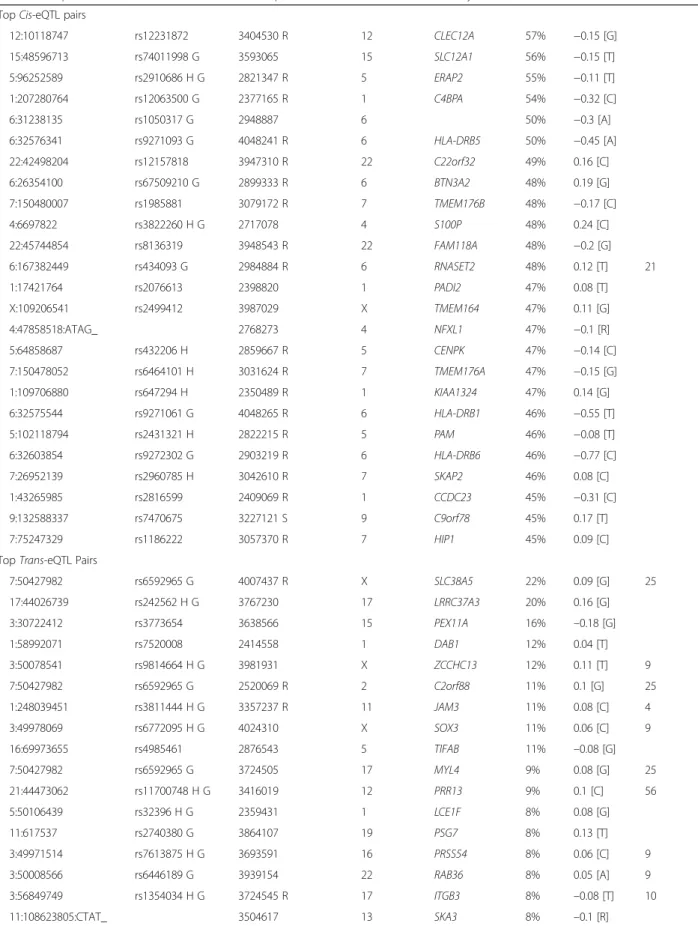
The top 25 lead cis-eQTL and trans-eQTL transcript cluster pairs, ranked by percent of variance explained (R2), are presented in Table 4. Illustrative box-plots for a cis-eQTL and a trans-eQTL are given in Fig. 2. For the top cis-eQTL gene pair (rs12231872 with CLEC12A) more than half of the variation in expression of the eGene was explained by thecis-eQTL. Likewise, the top trans-eQTL (rs6592965) explained over 22% of the vari-ation in expression of the corresponding trans-eGene (SLC38A5). Interestingly, ten of the 25 (or 40%) top cis-eQTLs were in significant LD with or were themselves GWAS hits (atP< 5E-8), providing support for the idea that genetically determined effects on gene expression have phenotypic consequences. Perhaps more note-worthy is the finding that 17 of the 25 (68%) top trans-eQTLs were also either GWAS hits or in significant LD with GWAS hits. Again, this supports the notion that not just cis-eQTL but also trans-eQTL effects may ex-plain the mechanism of action of these genetic variants. We found external validation for 18 of 25 (72%) top cis-eQTL-eGene pairs in at least one of four published data-sets [5–8], a high rate that perhaps should be expected for such prominent associations. We found evidence of external validation for only six of 25 (24%) top trans-eQTL pairs, perhaps because few published studies have reported full genome-widetrans-eQTL results.
The Affymetrix Exon Array provides expression mea-surements at the transcript cluster level, but also for in-dividual exons within the transcript cluster. At the exon level (Additional file 1: Table S3), we detected many of
the samecis-eQTLs for individual probesets of the same genes identified at the gene-level. The top exon-level trans-eQTLs also duplicated many of the results seen at the gene-level, including manytrans-eQTLs found to be part oftrans-eQTL blocks or clusters (discussed in detail below). However, the percentage of variance of expression levels of these exons explained by their trans-eQTLs is generally much higher than that for the corresponding gene-level results, probably because the gene-level analysis averages over multiple exons that demonstrate consider-able variation.
Enrichment of lead eQTL location relative to gene structure and neighborhood
A major goal of eQTL studies is to identify true gene transcription regulatory elements. Previous analyses [5, 7, 8] have shown a strong dependence of eQTL position relative to the TSS and transcription end sites (TES) of each gene. We analyzed 8475 protein-coding eGenes with identifiable gene structure and without suspicion of polymorphism-in-probe effects, to iden-tify preferences for locations of all significant eQTLs and of the lead eQTL. We found that lead eQTLs are frequently (for 35% of eGenes) found in the tran-scribed region of the gene, a ninefold enrichment compared to elsewhere in the 2 Mb region centered on the TSS (Additional file 1: Table S4). The lead eQTL is also frequently (38%) in the upstream cis-intergenic region, but less often than expected. The lead eQTL is less frequently (28%) in the downstream cis-intergenic region (Additional file 1: Table S4). The distance from upstream lead eQTLs to the TSS follows a multi-exponential decay curve with a median dis-tance of about 27 kb. The disdis-tance downstream from the TES to the lead eQTLs follows a similar multi-exponential distribution with a slightly longer median distance of about 31 kb. A graphical representation of the observed distribution of lead eQTL locations is given in Additional file 1: Figure S5. Within the tran-scribed region, exonic locations are highly enriched (25 fold) for lead eQTLs, more so than for intronic lo-cations (12-fold). The first exon and the 5’- UTR are Table 3Number of independent, significant pairs validated in previous studies
Pair type Comparison study Eligible lead eQTL-gene pairsa Validated pairsa(rate) Expected pairs (rate) Cis Multiple studies [2,4–6] 10,584 5700 (54%) 90 (0.8%)
Battle et al. [7] 11,466 2911 (25%) 10 (0.08%) Kirsten et al. [8] 11,179 6503 (58%) 919 (8%) Trans Multiple studies [2,4–6] 1777 40 (2%) 0.0007 (0%)
Battle et al. [7] 2596 102 (4%) 0.0001 (0%) Kirsten et al. [8] 2337 135 (6%) 0.03 (0%)
a
See“Methods”and Additional file1: Supplementary Methods for details
Table 4Top 25 non-redundant gene levelcis-eQTL and top 25trans-eQTL-transcript cluster pairs
eQTL marker position Rs ID Transcript cluster ID Trans Chr Gene symbol R2 Beta Cluster number TopCis-eQTL pairs
12:10118747 rs12231872 3404530 R 12 CLEC12A 57% −0.15 [G] 15:48596713 rs74011998 G 3593065 15 SLC12A1 56% −0.15 [T] 5:96252589 rs2910686 H G 2821347 R 5 ERAP2 55% −0.11 [T] 1:207280764 rs12063500 G 2377165 R 1 C4BPA 54% −0.32 [C] 6:31238135 rs1050317 G 2948887 6 50% −0.3 [A] 6:32576341 rs9271093 G 4048241 R 6 HLA-DRB5 50% −0.45 [A] 22:42498204 rs12157818 3947310 R 22 C22orf32 49% 0.16 [C] 6:26354100 rs67509210 G 2899333 R 6 BTN3A2 48% 0.19 [G] 7:150480007 rs1985881 3079172 R 7 TMEM176B 48% −0.17 [C] 4:6697822 rs3822260 H G 2717078 4 S100P 48% 0.24 [C] 22:45744854 rs8136319 3948543 R 22 FAM118A 48% −0.2 [G] 6:167382449 rs434093 G 2984884 R 6 RNASET2 48% 0.12 [T] 21 1:17421764 rs2076613 2398820 1 PADI2 47% 0.08 [T] X:109206541 rs2499412 3987029 X TMEM164 47% 0.11 [G] 4:47858518:ATAG_ 2768273 4 NFXL1 47% −0.1 [R] 5:64858687 rs432206 H 2859667 R 5 CENPK 47% −0.14 [C] 7:150478052 rs6464101 H 3031624 R 7 TMEM176A 47% −0.15 [G] 1:109706880 rs647294 H 2350489 R 1 KIAA1324 47% 0.14 [G] 6:32575544 rs9271061 G 4048265 R 6 HLA-DRB1 46% −0.55 [T] 5:102118794 rs2431321 H 2822215 R 5 PAM 46% −0.08 [T] 6:32603854 rs9272302 G 2903219 R 6 HLA-DRB6 46% −0.77 [C] 7:26952139 rs2960785 H 3042610 R 7 SKAP2 46% 0.08 [C] 1:43265985 rs2816599 2409069 R 1 CCDC23 45% −0.31 [C] 9:132588337 rs7470675 3227121 S 9 C9orf78 45% 0.17 [T] 7:75247329 rs1186222 3057370 R 7 HIP1 45% 0.09 [C] TopTrans-eQTL Pairs
7:50427982 rs6592965 G 4007437 R X SLC38A5 22% 0.09 [G] 25 17:44026739 rs242562 H G 3767230 17 LRRC37A3 20% 0.16 [G] 3:30722412 rs3773654 3638566 15 PEX11A 16% –0.18 [G] 1:58992071 rs7520008 2414558 1 DAB1 12% 0.04 [T] 3:50078541 rs9814664 H G 3981931 X ZCCHC13 12% 0.11 [T] 9 7:50427982 rs6592965 G 2520069 R 2 C2orf88 11% 0.1 [G] 25 1:248039451 rs3811444 H G 3357237 R 11 JAM3 11% 0.08 [C] 4 3:49978069 rs6772095 H G 4024310 X SOX3 11% 0.06 [C] 9 16:69973655 rs4985461 2876543 5 TIFAB 11% –0.08 [G] 7:50427982 rs6592965 G 3724505 17 MYL4 9% 0.08 [G] 25 21:44473062 rs11700748 H G 3416019 12 PRR13 9% 0.1 [C] 56 5:50106439 rs32396 H G 2359431 1 LCE1F 8% 0.08 [G] 11:617537 rs2740380 G 3864107 19 PSG7 8% 0.13 [T] 3:49971514 rs7613875 H G 3693591 16 PRSS54 8% 0.06 [C] 9 3:50008566 rs6446189 G 3939154 22 RAB36 8% 0.05 [A] 9 3:56849749 rs1354034 H G 3724545 R 17 ITGB3 8% –0.08 [T] 10 11:108623805:CTAT_ 3504617 13 SKA3 8% –0.1 [R]
especially enriched for lead eQTLs (45-fold) while other exons, the 3’-UTR, the first intron and subse-quent introns (21-fold, 20-fold, 11-fold, and 8-fold, re-spectively) show lesser degrees of enrichment (Additional file 1: Table S4). Thus, it is clear that lead cis-eQTLs act preferentially through regulatory ele-ments within the first exon, within the 5’-UTR or near the TSS. We also analyzed just the secondary lead eQTLs which show independent significant associa-tions with about half of the targeted transcript clus-ters. Again, the 5’-UTR again was maximally enriched (30-fold) in these lead eQTLs. The pattern of enrich-ment was nearly identical but somewhat weaker than that for the primary lead eQTLs, This shows that sec-ondary lead eQTLs also convey important information re-garding functional sites.
Enrichment of lead eQTLs at regulator sites
To further explore the regulatory sites, we compared our results to RegulomeDB [16], a summary of evidence for a regulatory role for each SNP, based on DNAase hypersensitivity, transcription factor binding sites, and biochemically characterized regulatory promoter regions. Specifically, we tested whether our leadcis-eQTLs exclud-ing those targetexclud-ing polymorphism-in-probe transcripts) were enriched for regulatory roles (i.e. low RegulomeDB scores) compared to othercis-SNPs within 1 Mb of each transcript start site, having no such evidence. Results, summarized in Additional file 1: Table S5, show strong enrichment of regulatory evidence for all (primary and secondary) lead cis-eQTLs (sevenfold enrich-ment, P< 1E-89). The primary lead cis-eQTLs alone showed a stronger enrichment (eightfold, P< 1E-69), but with a minor attenuation in significance level. This result suggests that lead eQTLs are indeed identifying regulatory sites and that the primary lead
eQTLs are the most likely regulatory position in a given neighborhood. Only a barely significant, two-fold excess of lead trans-eQTLs were found with low RegulomeDB scores, suggesting that at most a modest fraction of trans-eQTLs are acting at known regulatory sites.
Clusters oftrans-eQTLs
Some trans-eQTLs are associated with multiple distant transcripts and can be grouped into compact genomic blocks or clusters (see“Methods”). Although such“ regu-latory hotspots”can arise from confounding factors such as batch effects [17], we used methods that reduce or avoid such spurious associations (see“Methods”). At the gene level, we identified 59 distinct clusters of trans-eQTLs, each targeting a set of six to 141 distant tran-scripts (Table 5, Fig. 3). Studying the targets of these clusters may illuminate the functional roles of these eQTLs. For example, suchtrans-eQTL clusters may be a result of downstream consequences of a variant within a haplotype block [18]. The most prominent trans-eQTL clusters are on chromosomes 3 and 17 (Clusters 10, 51, and 52) and are associated with expression of platelet-specific genes, such as CTTN, HIST1H3H, and MMD [15, 19, 20]. SNPs in these clusters were reported to be associated in GWAS [4] with platelet count and mean platelet volume (e.g. rs1354034 and rs12485738 on chromosome 3; rs10512472 and rs16971217 on chromo-some 17) [21]. Variation in platelet count or volume would likely cause changes in the proportion of RNA de-rived from platelets in the whole blood sample and thus, variation in the apparent expression levels of platelet as-sociated genes. We found 13 platelet-related GWAS clusters (Table 5, Additional file 1: Table S6), many of which also had target gene sets enriched with platelet-Table 4Top 25 non-redundant gene levelcis-eQTL and top 25trans-eQTL-transcript cluster pairs(Continued)
17:33875262 rs8073060 H 3089102 R 8 EPB49 7% –0.05 [T] 51 3:56849749 rs1354034 H G 2735759 4 MMRN1 7% –0.07 [T] 10 11:55113534 rs75905900 G 3329983 11 PTPRJ 7% –0.05 [A] 6:170847101 rs75159687 2390976 1 LINC00115 7% –0.13 [T] 22:50027210 rs5769712 3581090 14 TMEM179 7% 0.06 [C] 58 7:50427982 rs6592965 G 3714729 R 17 MAP2K3 7% –0.05 [G] 25 22:50027210 rs5769712 3203199 9 TAF1L 6% 0.07 [C] 58 3:56849749 rs1354034 H G 2476510 2 LTBP1 6% –0.06 [T] 10 R2
- Percentage variance explained
Marker position is annotated as chromosome number:location in hg19 coordinate
Beta is regression estimate (log base 2 expression difference per dosage of effect allele), with effect allele in brackets. [R] refers to the reference allele for an indel polymorphism
H = HapMap SNPs
G = in LD with GWAS SNPs as recorded in the NHGRI GWAS catalog
R = In LD with SNP replicated in at least one of the databases associated with references GTEx [1], Westra et al. [5], Liang et al. [6], Kirsten et al. [8]
All 25cis-eQLTs and 25trans-eQLTs are internally validated and have consistent sign of expression change
specific genes. In addition, Cluster 1 may contain an un-discovered platelet-associated variant, as it is associated with enrichment for platelet-related genes.
We also identified several trans-eQTL clusters that targettrans-eGenes related to other blood cell types. For example, seven clusters (17, 18, 25, 49, 51, 54, and 59; Table 5) appear to target expression of six to 27 genes specific to CD71+ early erythrocytes or reticulocytes [21] (significantly enriched, Fisher’s exact test P values 1.8E-33 to 1.2E-7). Of these, three (Clusters 17, 18, and 25 on chromosomes 6 and 7) contain SNPs with known associations in GWAS with red blood cell traits, including hematocrit and hemoglobin (e.g. rs668459 on chromo-some 6 [22] and rs12718597 on chromochromo-some 7 [23]). Thus, these clusters may arise from effects of the genetic variant on hematopoiesis or related pathways.
Fourteen of the clusters include eQTL-gene pairs that have been observed in previous studies [5–8] of whole blood or the peripheral blood mononuclear cells (PBMC) fraction (Table 5, Column 8), including Clusters 4, 6, 10, 11, 17, 18, 25, 29, 33, 34, 35, 38, 39, and 51. Eight of the 13 previously mentioned GWAS platelet-related clusters are among these. Another, Cluster 6, targets 18trans-eGenes (seven previously validated) and contains GWAS hits for blood-related diseases and traits. Two more (Clusters 11 and 29) show enrichment of neutrophil-specific target genes. Clusters 18 and 25 include GWAS SNPs for mean corpuscular volume (e.g. rs668459 and rs12718597, respectively) and are enriched in reticulocyte specific target genes. Finally Cluster 35 with eight trans-eGenes, of which three are validated (Table 5, Additional file 1: Table S7), includes GWAS hits for melanoma and response to metformin, but the relationship of these eight genes to either phenotype is unclear.
Target genes of trans-eQTL clusters may suggest mechanism of action
Clusters might arise as a result of factors other than changes in proportion of blood cell types. Examination of the sets of target genes of trans-eQTL clusters (Additional file 1: Table S7) may suggest a functional mechanism at play in the regulation of trans-eGenes. We found examples of enrichment of genes annotated as targets of transcription factors, as targets of micro-RNAs (mimicro-RNAs), and for several signaling pathways (Table 5, Gene set enrichment analysis (GSEA)). Some trans-eQTL clusters target transcripts [24] sharing a common promoter binding site motif [24], suggesting that certain transcription factor pathways are modified by genetic variants within the cluster (Additional file 1: Table S8). For example, Clusters 10 and 51 target an over-abundance of genes with promoter regions con-taining motifs specific to transcription factorsSP1 and NRF1. Indeed, transcription factor SP1 has recently been shown to regulate platelet formation in mouse [25]. Changes in activities of these transcription factors may mediate the effect of genetic variants in these clusters on platelet formation and dynamics.
miRNAs may mediate effects of trans-eQTLs
miRNAs that are encoded near an eQTL and bind to a trans-eGene might be a part of the mechanism under-lying trans-eQTLs, as miRNAs are known to modify the expression or degradation of their target mRNAs. GSEA [26] of the genes targeted by each cluster revealed that variants in several clusters target a significant number of genes that are themselves targets of specific sets of miRNAs (at FDR < 0.05; Additional file 1: Table S9). For example, Cluster 51 targets the expression of 141 genes
Fig. 2Box plotsof very strongcis-eQTL ortrans-eQTL-transcript cluster pairs.ars2499412–TMEM164 (cis, R2= 47%).brs3773654–PEX11A (trans, R2= 16%).
y-axis: expression level in RMA units;x-axis: imputed major allele count
Table 5 Clusters of tr ans-eQTLs with many targets Cluster Clust er addres s (hg 19) Wi dth N N g Tr Tr-max Tr-Ext Ret GWAS trait s Top GSEA categories 1 chr1:1 18158 079-11 81742 22 16 ,144 8 0 10 8 0 1 Pla telet 2 chr1:1 58810 312-15 88273 65 17 ,054 2 0 7 7 0 0 3 chr1:2 05040 943-20 52688 03 22 7,861 114 4 14 11 0 5 Mean platele t volu me, Platelet counts . 4 chr1:2 48038 210-24 80476 88 94 79 4 3 15 12 2 1 Mean corpus cular vo lume, Platelet counts , Red blood cell trait s . 5 chr2:8 74072 2-8766 192 25 ,471 23 0 24 21 0 2 Cat abolic proc ess 6 chr2:6 07085 97-607 27629 19 ,033 19 24 18 15 7 1 Beta thal assemia/ hemo globin E disea se, F-cell dis tribution, Feta l hem oglob in le vels, Sickle cell anemia (hemol ysis) . 7 chr2:8 57153 15-858 09703 94 ,389 51 1 1 5 1 2 0 0 Prostate cancer Ne utrophil 8 chr2:1 60326 049-16 06746 56 34 8,608 381 0 2 6 2 1 1 0 Live r cance r progr ession, fibroblast cell res ponse, Neutrophi l, Micr oRNA targets 9 chr3:4 97340 40-503 08718 57 4,679 435 2 38 34 0 0 HDL choles terol, Menarc he (age at onset) D endritic cell s respon se 10 chr3:5 68298 92-569 53738 12 3,847 185 9 128 127 85 3 Mean platele t volu me, Plate let coun ts Pla telet, hemo stasis, Neut rophil 11 chr3:1 00905 910-10 15500 22 64 4,113 544 0 37 33 17 0 Gen es in band chr19 q13, trans cription path way 12 chr3:1 21350 573-12 14713 67 12 0,795 35 0 8 8 0 1 13 chr3:1 76869 498-17 69286 57 59 ,160 104 0 9 8 0 0 14 chr4:1 03391 275-10 35407 62 14 9,488 77 1 7 7 0 0 Ulcer ative colit is . 15 chr5:1 48198 999-14 82135 06 14 ,508 42 0 3 5 3 2 0 0 N e utrophil, kidne y glome ruli ce ll response 16 chr5:1 73287 763-17 33638 89 76 ,127 9 2 14 13 0 5 Crohn ’ s dis ease, Waist – hip rati o . 17 chr6:1 35402 339-13 54598 37 57 ,499 27 24 26 23 7 6 Beta thal assemia/ hemo globin E disea se, Cholest erol, tot al, F-cell distr ibutio n, HbA2 levels, Hem atocrit, Hem atological parame ters, Hemat ology trait s, H odgkin's lymph oma, Mean corpus cular hem oglob in, Mean corpus cular hem oglob in conc entrat ion, Mean corpus cular vo lume, Mean platele t volume , Other eryth rocyte phenoty pes, Pla telet cou nts, Red blood cell trait s, White blood cell coun t, White blood cell types CD7 1+, Mi croRN A targets 18 chr6:1 39764 573-13 98444 29 79 ,857 48 9 73 50 13 17 Adipone ctin levels, HDL chol esterol, Mean corpus cular hem oglob in, Mean corpus cular vo lume CD7 1+, Ne utrophil, MicroRNA targets 19 chr6:1 44190 433-14 46746 57 48 4,225 172 0 4 3 3 4 1 0 N e utrophil, MicroRNA targets 20 chr6:1 59498 130-15 95392 13 41 ,084 14 0 10 9 0 0 H em at o p o et ic ce lls re sp o n se ,N eu tr o p h il 21 chr6:1 67362 976-16 74034 00 40 ,425 6 3 7 6 0 0 Crohn ’ s dis ease, Graves ’ disea se, Inflammatory bowe l disea se Hem atopo etic cells res ponse
Table 5 Clusters of tr ans-eQTLs with many targets (Continued) 22 chr7:28 71615 4-2887 4761 158,60 8 11 0 19 17 0 0 Neutro phil 23 chr7:33 03534 2-3309 6644 61,303 5 0 12 11 0 5 . 24 a chr7:50 36663 7-5041 7632 50,996 3 0 40 40 2 2 Dend ritic cell vs mono cyte respon se, Neut rophil 25 a chr7:50 36765 6-5067 1350 303,69 5 29 2 6 93 82 19 17 Ac ute lymp hoblas tic leukem ia (B-c ell pre cursor), Acute ly mpho blastic le ukemia (chil dhood) , Mean corpus cular vo lume, Re d blood cell trait s CD7 1+, Micr oRNA targets 26 chr7:10 63676 04-106 37371 8 6115 8 6 6 6 0 1 Mean pla telet vo lume . 27 chr8:61 59567 1-6165 8073 62,403 10 0 6 6 0 0 28 chr9:99 08721 7-9919 2919 105,70 3 12 1 7 7 0 0 Hei ght B o n e m ar ro w p ro g en ito r ce lls re sp o n se 29 chr9:12 69712 04-127 00241 4 31,211 20 0 20 16 1 0 Kidney glome ruli cell s res ponse, Neutro phil, Mi croRN A targets 30 chr9:13 15611 10-131 64565 9 84,550 58 0 10 10 0 0 Hemat opoeti c cell s respon se, Neutro phil 31 chr9:14 06555 51-140 69652 4 40,974 14 0 7 6 0 0 . 32 chr10 :379769 90-386 92432 715,44 3 22 1 0 9 7 0 0 . 33 chr10 :650161 74-651 04500 88,327 18 6 6 6 1 0 Mean pla telet vo lume, Platelet cou nts, Tri glycerides Platele t 34 chr11 :212408 -24702 8 34,621 15 1 6 6 1 0 Pla telet cou nts Coagu lation, Pla telet 35 chr11 :108021 205-10 83674 53 346,24 9 24 8 3 8 7 3 0 Melano ma, Respo nse to me tformin, Re sponse to metform in in type 2 dia betes (glycem ic) Neutro phil 36 chr12 :545843 30-545 84330 1 1 0 7 7 0 0 Genes with cert ain promo ter mot if 37 a chr12 :546223 28-547 33728 111,40 1 6 2 7 6 0 0 Mean pla telet vo lume, Platelet counts Genes in band chr14q2 4 38 a chr12 :546684 71-547 61931 93,461 27 3 29 14 2 0 Mean pla telet vo lume, Platelet counts Platele t 39 chr12 :111833 788-11 28968 39 1,063,0 52 25 35 17 15 7 0 Be ta-2 mi croglobulin pla sma levels, Blood pre ssure, Celiac disease, Celiac disea se and Rhe umatoi d arthr itis, Cholest erol, tot al, Chronic kidne y disea se, Coronary artery dis ease or ische mic stroke, Coro nary artery disea se or larg e artery stro ke, Coron ary heart disease, Dias tolic blood pressure , Eosino phil coun ts, Hem atocrit, Hem atological parameters , Hem oglob in, Hypothy roidism, Ischemi c stroke, LDL chol esterol, Me an pla telet volume , Platele t cou nts, Re d blood cell traits, Re tinal vascular calib er, Rheum atoid arthritis, Systo lic blood pre ssure, Tetralogy o f Fal lot, Type 1 diabetes, Type 1 diabetes autoan tibodi es, Upp er aerod igestive tract cance rs, Urat e levels, Vitil igo Interfe ron sign aling, Cy tokine signali ng, Immu ne sy stem
Table 5 Clusters of tr ans-eQTLs with many targets (Continued) 40 chr12 :12221 6910-1 22366 612 14 9,703 3 5 12 12 0 0 Mean platele t volu me, Plate let coun ts Pla telet, Neutro phil 41 chr12 :12927 7164-1 29305 613 28 ,450 56 1 17 16 0 0 Syste mic lupus eryt hem atosus . 42 chr14 :24888 248-24 90460 2 16 ,355 19 0 13 13 0 3 43 chr14 :35372 518-35 84778 4 4 7 5,267 360 2 1 8 1 7 1 0 Psoriasis Panc reatic cancer cell respo nse, Ne utrophil, MicroRNA targets 44 chr16 :57045 349-57 07061 7 25 ,269 31 0 11 11 1 0 IF NG res ponsive 45 chr16 :87749 634-87 77046 9 20 ,836 6 0 9 9 0 0 46 a chr16 :89802 396-89 99223 8 1 8 9,843 4 1 4 1 1 8 0 0 Freckling, Hair color, Homocy stein e level s, Vitil igo . 47 a chr16 :89919 081-89 99320 6 7 4 ,126 102 9 9 8 0 0 Basal cell carcinoma, Blond vs. brown hair col or, Frec kles, Hair colo r, Non-m elanoma skin canc er, Re d vs non-red ha ir colo r, Skin sensitivity to sun, Sunburns, Tanni ng . 48 chr17 :15899 871-16 23983 2 33 9,962 137 0 9 7 1 0 B et a ca te n in si g n al in g ,N eu tr o p h il 49 chr17 :26887 271-27 32332 2 4 3 6,052 252 0 4 4 4 1 0 11 PB MC response, CD7 1+, Ne utrophil, MicroRNA targets 50 chr17 :33763 678-33 81940 1 55 ,724 22 0 23 21 0 1 P B M C re sp o n se ,M ic ro R N A ta rg et s 51 a chr17 :33823 254-34 06789 2 24 4,639 360 2 141 95 8 26 Platelet counts , Mean plate let volu me PB MC response, CD7 1+, Pla telet, Micr oRNA targets 52 a chr17 :33885 467-33 89984 6 14 ,380 3 2 11 9 0 0 Platelet counts , Mean plate let volu me Pla telet, PBMC vs. Tce lls 53 chr18 :43716 475-43 85635 4 13 9,880 121 0 10 9 0 2 54 chr20 :41397 57-418 8267 48 ,511 70 0 4 0 3 3 0 8 P B M C response, CD7 1+ 55 chr20 :62529 985-62 56583 3 35 ,849 54 0 9 9 0 1 Gl ioma cell respon se 56 chr21 :44471 469-44 49284 3 21 ,375 7 3 6 6 1 0 Blood trace el ement (Se level s), Homocy stein e level s, Obesity -related trai ts . 57 chr22 :32311 619-32 32602 1 14 ,403 17 0 8 8 0 0 Hem atopo etic cell res ponse, Neutrophi l 58 chr22 :49967 868-50 06953 9 10 1,672 128 0 18 16 0 0 59 chrX :408029 81-4 08478 52 44 ,872 52 0 31 30 0 7 CD7 1+ aOverlapping clusters N nu m b er o f si gni fic a nt eQ TL s in clu st e r, Ng n um b e r o f GW A S S N P s in cl us te r, Tr n u mb e r o f tra n sc ri p t cl us te rs ta rg e te d b y a n y trans-eQ T L in cl u st e r, Tr-m ax m a x n u mb e r o f tra n sc ri p t cl us te rs ta rg e te d b y si n g le trans-eQ TL in clust e r, Tr-Ex t m axim u m n umbe r o f transcripts validat e d in o n e o r m o re o f five p revious re su lt s [ 5 – 8 , 59 – 62 ], Re t n u m b er of e a rl y re ti cu lo cyt e sp e ci fi c tr a n sc ri p ts ta rg e te d b y tra ns -e QT Ls in cl u st e r, GSE A Categ ory se le cted G S EA them e s over -r e p res e nted in clus te r ta rg e ts , GS EA g e n e se t e nr ic hm ent a n a ly sis
(Additional file 1: Tables S6 and S7) including 13 genes (PPM1A,TSPAN5,APP,PIM1,COPS2,CSDE1,WDTC1, AP2A1, CARM1, FURIN, EPB49, FAM134A, and SH3BGRL2) known [26] to be targets of a small set of miRNAs (miR-15A, miR-16, miR-15B, miR-195, miR-424, miR-497), a highly significant enrichment (FDR < 0.0001). Access to the measured miRNA expression data from the same whole blood samples [27] allowed us to compare the expression levels of five of these six miRNAs (miR-497 was not measured) with expression levels of the 13 genes. We found that all of these gene expression levels, except CSDE1, were correlated with expression levels of each of the five measured miRNAs (genome-wide FDR < 0.001). In addition, 119 of the 141 mRNA levels targeted by Cluster 51 were correlated with measured levels of at least one of these miRNAs at FDR < 0.001 (Additional file 1: Table S9). This provides suggestive evidence that one or more of these miRNAs may be involved in the mechanism of action of the corresponding genetic variants.
Cluster 39 contains SNPs associated in GWAS with almost two dozen traits or diseases (Additional file 2: Table S10) andtrans-eQTLs targeting a similar number of distinct genes. The variant rs3184504 within SH2B3 on chromosome 12 and its proxy rs653178 lie within this cluster and were previously observed to be cis-eQTLs for SH2B3 and trans-eQTLs for six interferon-γ signaling transcripts and nine toll-like receptor signaling genes [5]. In our study, these two SNPs are associated with the transexpression levels of four of six previously reported [28] interferon-γ signaling genes and with five
additional genes (GBP3, GBP5, GBP7, FCGR1A, and FCGR1B). We confirmed only one of nine previously re-ported toll-like receptor signaling genes, possibly a result of differences in the expression measurement platforms employed. Also, we found a much stronger cis associ-ation of rs3184504 withALDH2andOAS2compared to SH2B3, although the latter harbors this eQTL in its coding region.
Comparison to published trans-eQTL blocks or clusters A recent study of human eQTLs in blood-derived RNA also noted extensive clusters of trans-eQTLs. Kirsten et al. [8] reported finding almost 849 unique trans-eQTLs with two or more targets, corresponding to about 175 loci. Our more restrictive definition of atrans-cluster re-quiring six or more trans-targets identified 753 trans-eQTLs in 59 loci ortrans-clusters. However, the overlap of these two approaches was not extensive. Among our 59 trans-clusters of eQTLs, we found 14 harboring eQTLs also found by Kirsten et al. [8], with one or more of the identical targets (Table 5, Additional file 1: Figure S6). Of these, 12 could be readily identified as related to platelets or red blood cell components by the GWAS hits they contained. Of the remaining two clusters, Clus-ter 29 contains no GWAS related traits, but includes tar-gets related to neutrophils. Cluster 35 includes GWAS hits for melanoma and response to metformin but is otherwise cryptic.
Kirsten et al. [8] highlighted ten eQTLs, each in LD with one or more GWAS hits and each with at least 10 20 30 40 50 60 70 80 90 100 110 120 130 5 10 15 20 25 12 34 5 6 7 8 9 10 11 1213 14 15 16 17 18 19 20 21 22 23 24 25 26 27 28 29 30 313233 34 35 3637 38394041 4243 44 45474746 48 49 50 51 52 53 54 55 5657 58 59 2 4 7 9 10 111213 17 18 19 202224 25 29 33 36 383941 42 43 474746 48 49 51 52 5455 58 1 2 3 4 5 6 7 8 9 10 11 12 13 14 15 16 17 18 19 20 21 22 X
a
b
Number T
ranscripts
CHROMOSOME
Fig. 3Number of transcript clusters targeted by eachtrans-eQTL. eQTLs targeting six or more extrachromosomal transcript clusters fall into color-coded clusters.aNumber of extra-chromosomaltranstargets.bNumber of intrachromosomaltranstargets. Note presence of unlabeled clusters on Chr 6, the HLA region, and on Chr 8
three, mostly novel, associated trans-eGenes. Of these, one (rs10512472) falls into our Cluster 51, the second strongest platelet-related cluster, for which we found 141 trans-eGenes including five of the nine target genes found in their study. Overall, we provide strong support for only one of their ten highlightedtrans-clusters. This modest level of replication might be attributable to dif-ferences in the underlying cohorts, difdif-ferences in the tis-sue RNA source, or other technical factors, or may point to platform-specific limitations in definingtrans-clusters themselves.
Trans-eQTLs not in clusters
Some of the trans-clusters, e.g. clusters 18 and 25, may be the direct result of variation of cell type in the whole blood samples, such as reticulocyte content, for which inadequate data were available to compensate. However, of the 5749 lead trans-eQTLs (Table 2), 90% (5212) are not found in any of our trans-clusters, suggesting that the majority of detectedtrans-eQTLs are not simply the result of uncompensated cell type variation. Rather, other mechanistic explanations should be sought, includ-ingcis-expression of transcription factors or miRNAs not measured in our assay, or other rarer transcribed mole-cules such as long non-coding RNAs having as yet un-identified effects elsewhere in the genome. Of the 5212 trans-eQTLs not found in clusters, 15 are found in the GWAS catalog [14] (Additional file 2: Table S10) but only a small fraction (15 of 5212 or 0.2%) were validated in earlier studies, although many were internally validated. Clinical relevance
Among 7057 SNPs that were associated (at P< 5E-8) with 942 phenotypes in the NHGRI-EBI GWAS Catalog [14], 3381 or 48% were significant eQTLs, related to 654 distinct phenotypes. This coverage represents two times the number expected by chance (1696, P< 2E-16, Fish-er’s exact test). Limiting our results to only the lead eQTLs and variants with > 80% LD, we saw smaller but more significant coverage of 15% (observed 1028, ex-pected 367,P< 2E-277). Of these 1028 lead eQTLs, 922 (or 13%), were cis-eQTLs; 200 (or 3%) were trans-eQTLs. The full list of eQTL GWAS hits is provided in Additional file 2: Table S10. The significant coverage of the GWAS Catalog makes our eQTL library valuable for exploring hypotheses regarding putative functional mechanisms.
The CARDIoGRAMplusC4D consortium completed a GWAS meta-analysis of 60,801 coronary artery disease or myocardial infarction (CAD/MI) cases and 123,504 con-trols and identified 58 genomic loci associated with CAD/ MI [29]. Solid explanations for individual mechanisms of effect, however, were provided for only a handful of these loci. When the risk variant lies in the exon of a gene or its
UTR, it is likely that the host gene is in the effect pathway. However, only four of the 58 CAD/MI GWAS SNPs reside in the exons or UTRs of genes (Additional file 1: Table S11). Two of these are missense variants (rs3184504 inSH2B3and rs11556924 inZC3HC1). The polymorphism rs964184 lies in the 3’UTR ofZPR1and rs7528419 lies in the 3’ UTR of CELSR2 and downstream of SORT1. Musunuru et al. [30] demonstrated that rs12740374, a per-fect proxy for the risk variant rs7528419, is responsible for changes in SORT1 expression in liver and alters plasma LDL-cholesterol levels in mouse. For 36 CAD/MI associ-ated loci, the lead risk variants reside in intronic regions of genes, making their contribution to the effect pathways less clear, though expression level or transcript splicing vari-ation might play a role. For the remaining 18 loci, the lead risk variants fall tens to hundreds of kilobases from the nearest gene. Several of the nearest genes, such asLDLRat the 19p13.2 locus,encode proteins with known roles in the biology of CAD/MI, such as lipid metabolism or regulation. Others, such as the lead risk variant for the PMAIP1-MC4R locus are close to known obesity risk variants. Nikpay et al. [29] also noted that a cluster of such genes with documented roles in vessel wall biology can be identi-fied among their CAD/MI GWAS results.
We posit that eQTLs can aid in identifying causal genes or pathways represented by “risk SNPs” from GWAS. Indeed, 19 of the 58 CAD/MI risk loci were pre-viously reported by Nikpay et al. [29], Schunkert et al. [31], and the CARDIoGRAMplusC4D Consortium [32] to contain cis-eQTLs for nearby eGenes. The roles of several of the targeted eGenes have been confirmed in animal or in vitro experiments. For example, rs264 at 8p21.3, intronic to LPL (lipoprotein lipase), correlates with LPL expression in monocytes [32]. Mutations in LPL cause LPL protein deficiency resulting in type 1 hyperlipoproteinemia [33]. rs264 is also strongly associ-ated with circulating triglyceride and HDL cholesterol levels [34].
We performed a comprehensive eQTL analysis of these 58 CAD/MI risk loci by intersecting the published GWAS SNPs with the significant eQTLs in our study and identified candidate causal genes for 21 (36%) of the risk SNPs. Eleven CAD/MI risk SNPs or a SNP in strong LD with them, were also lead eQTLs in our study. An-other ten CAD/MI risk SNPs were found to be signifi-cant eQTLs, but not the lead eQTL at that locus (see
“Methods”). We confirmed that ten genes at nine loci mentioned in Nikpay et al. [29] were targeted by cis-eQTLs, specifically at the ABO, IL6R, LDLR, LPL, REST-NOA1, SORT1, SWAP70, UBE2Z, and VAMP5-VAMP8-GGCXloci (Additional file 1: Table S12). Thesecis-eQTLs were highly significant, with P values ranging from 4 × 10⁻⁵ to <10−300 and often coincided with or were in extremely strong LD with a lead eQTL in our
study. However, since our study was based on RNA derived from whole blood, failure to confirm previously observed eQTLs may stem from the tissue specificity of expression control [1].
Among the 58 GWAS SNPs for CAD/MI, we found 24 morecis-eQTL-eGene pairs (Additional file 1: Table S12) not mentioned by Nikpay et al. [29]. The strongest (P< 1E-455) eQTL, rs1412445, is in the third intron of LIPA (lipase A) transcript variant 1 and was a cis-eQTL for LIPAexpression. This eQTL was described by Wild et al. [35] who attributed its effect on CAD through endothelial dysfunction. Lipase A catalyzes the hydrolysis of choles-teryl esters and triglycerides. Mutations can result in LAL deficiency, a disease leading to dyslipidemia and choles-teryl ester storage disease [33]. A link of LAL deficiency to premature heart disease and stroke has also been reported [36]. The second strongest of these eQTLs is rs149268645 in the WDR12 locus, a perfect proxy of the risk lead vari-ant for the CAD/MI risk varivari-ant rs6725887. This eQTL targets FAM117B (P< 1E-80), although it is not a lead eQTL for this gene. Another perfect proxy cis-eQTL at this locus (rs149846585) targets expression of CARF (or ALS2CR8,P< 1E-40) and is the lead eQTL for that gene. The third strongest (P< 1E-53) eQTL, rs11191582, is in strong LD with the risk variant rs11191416 in the CYP17A1-CNNM2-NT5C2 locus and targets the expres-sion ofNT5C2, although the eQTL is not the lead eQTL for that gene. NT5C2 was recently described as a cis-eQTL target in the context of aneurysm susceptibility [37].At this same locus, ourcis-eQTL, rs4409766 target-ing AS3MT was also found by Pierce et al. [38] in the con-text of arsenic metabolism. Our cis-eQTL rs17115100 targetingWBP1Lwas also found for this locus (Additional file 1: Table S12). We also identified potentially novel, strong cis-eQTLs for SNF8 and ATP5G1 at the UBE2Z locus, andOAS2at the SH2B3locus where the CAD/MI GWAS risk SNP was in very strong LD with our lead eQTL (Additional file 1: Table S12).
Two very strong cis-eQTLs were confirmed at the VAMP5-VAMP8-GGCX locus, targeting cis-eGenes VAMP8 and GGCX. The CAD/MI risk SNP rs7568458 was in tight LD with our lead eQTL forVAMP8and for GGCX. The gene GGCX codes for a protein that carboxylates glutamate residues of vitamin K-dependent proteins and in turn can affect coagulation and may pre-vent of vascular calcification and inflammation [33]. Thus, a hypothetical causal pathway leading to inflam-mation may be triggered by variants at this locus, in particular through variation in one or both cis-eGenes. The lead CAD/MI risk SNP at the VAMP5-VAMP8-GGCX locus (rs7568458) was also in tight LD with trans-eQTLs targeting five eGenes (CASP5, DPEP3, CRISPLD2,SLC26A8,PKN2; Additional file 1: Table S12). Thetrans-eGene,CASP5, expression level was previously
shown to be associated with blood pressure [39]. The VAMP5-VAMP8-GGCX locus itself coincides with our trans Cluster 7 (Table 5). The top GSEA term for the eGenes in this cluster was“neutrophils”(Table 5) suggest-ing that thetrans-eGenes associated with this cluster are associated with altered neutrophil concentration or activ-ity. Thus, possibly multiple causal pathways may operate here, one through cis-eQTL activity on VAMP8 and GGCX, and another through one or more of the trans-eGenes such asCASP5.
The CAD/MI GWAS risk SNP rs3184504 at the SH2B3locus is in tight LD with acis-eQTL targeting the expression of OAS2 andSH2B3, and also is in tight LD withtrans-eQTLs targeting 16trans-eGenes (Additional file 1: Table S12). The SH2B3 locus coincides with our transCluster 39 (Table 5). The Top GSEA categories for the 17trans-eGenes in Cluster 39 include interferon sig-naling, cytokine sigsig-naling, and immune system (Table 5). The SH2B3 CAD/MI GWAS risk SNP resides in a GWAS hot spot, showing strong associations with nu-merous diseases and phenotypes including red blood cell traits, platelet volume, and eosinophil counts, as well as CAD, blood pressure, and stroke [14]. Using the same eQTL data, Huan et al. [39] extensively studied lead variant rs3184504 in the context of blood pressure and foundSH2B3 to be a“key driver”gene of a blood pres-sure gene regulatory network. They found that many of the trans-eGenes for rs3184504 were themselves signifi-cantly related to blood pressure. It is interesting to note that one of these hypertension-related trans-eGenes, ATP2B1, is also a cis-eGene of the lead CAD/MI GWAS risk SNP at theATP2B1locus (Additional file 1: Table S12). Thus, the pathways implicated in hypertension at the SH2B3 locus may intersect with pathways at the ATP2B1 locus.
We were able to confirm thatRESTis a target of a cis-eQTL in theREST-NOA1locus on chromosome 4. How-ever, we also observed that the CAD/MI GWAS SNP at this locus, rs17087335, is in tight LD with lead trans-eQTLs targeting expression of trans-eGenes GDAP1 (ganglioside induced differentiation associated protein 1 on chr 8;P< 1E-20) andCACNA1E. (calcium voltage-gated channel subunit alpha1 E on chr 1; P< 1E-7, Additional file 1: Table S12). We speculate that these trans-eQTLs may point to a molecular mechanism underlying this CAD/MI risk locus.
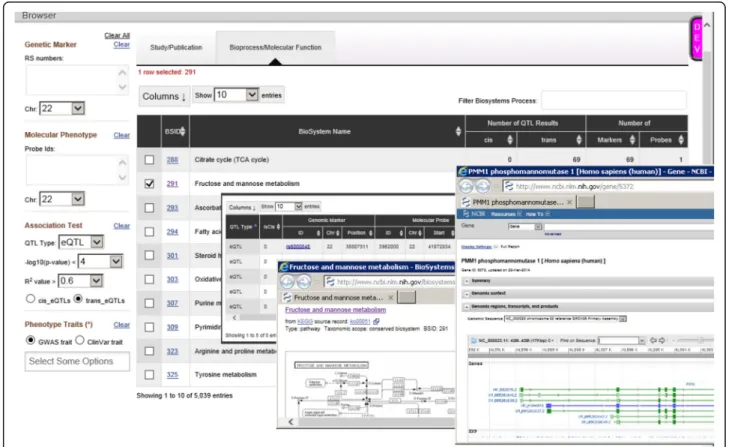
Molecular QTL browser
To make our results more user-friendly and accessible, we have made them freely available via the NCBI Mo-lecular QTL Browser (https://preview.ncbi.nlm.nih.gov/ gap/eqtl/studies/), which serves as a resource for data on association between genetic variation and molecular phenotypes. The browser links our results to multiple
resources including eQTLs identified in other studies. Importantly, users may specifyP value cutoffs and other filtering criteria. Users of the Molecular QTL Browser may conduct targeted studies of specific genes based on prior evidence or may wish to do meta-analysis of mul-tiple eQTL studies, where more permissiveP value cut-offs may be appropriate. To support meta-analysis and other comparisons across primary studies, the integrated data resource allows for cross-dataset searches and filtering based on genome location or functional an-notation (Fig. 4).
Discussion
We provide the largest, single study and database ofcis -eQTLs andtrans-eQTLs to date. We considered several examples of the potential implications of our results for interpreting GWAS findings. Our results also can be used to guide functional studies such as targeted gene knockout experiments and studies of miRNA expression in follow-up of GWAS results. We have illustrated how extensivecis-eQTL andtrans-eQTL data can be used to augment GWAS analysis of a complex disease (CAD/ MI). Of the 58 recently reported lead risk variants for CAD/MI [29], we show that 21 contain cis-eQTLs tar-geting 34 genes. Four additional risk variants are trans-eQTLs targeting 24 eGenes. Thus, eQTL analysis can
provide a rich resource for defining putative causal path-ways of risk variants determined in GWAS.
Our genome-wide trans-eQTL results provide a new richness of detail regarding trans-eQTL clusters and their putative relations to various transcription factors and miRNA targets. Another group [8] recently also car-ried out a genome-wide trans-eQTL analysis, providing a basis for comparison of our complete trans-eQTL results. However, their use of a different tissue (PBMC-derived RNA rather than whole blood), use of a different expression platform (an Illumina array rather than the Affymetrix Human Exon Array), and imputation to a dif-ferent SNP set (HapMap II rather than 1000 Genomes), limit the value of comparisons and explain the low rate of validation (6%).
Although many of the trans clusters may have resulted from uncompensated variation in cell type in the whole blood samples, some clusters could not be so easily ex-plained. Moreover, a large majority (90%) of the lead trans-eQTLs did not appear in any cluster, including nine of our top 25 lead trans-eQTLs. Thus, we have identified a large number oftrans-eQTL whose mechan-ism of action is likely not simply due to cell proportion, but through other mechanisms possibly involving miR-NAs, transcription factors, long non-coding RmiR-NAs, or as yet unidentified transcribed molecules.
The exon-level expression data permitted us to iden-tify more precisely cases of polymorphism-in-probe, where the genetic variant is directly detected by the ex-pression array and might easily be interpreted as an as-sociated change in overall gene expression. The same exon-level expression data facilitated a search for spli-cing variants influenced by genetic sequence (sQTLs) [40]. However, the additional noise inherent in the exon-level analysis offsets to some degree the benefits of the additional resolution offered by measuring exon-specific expression.
Our findings on cis-eQTL patterns are generally con-sistent with previous findings. We were able to validate 54–58% of our leadcis-eQTL results compared to other studies using microarrays. For a study using next-generation sequencing, the validation rate dropped to 25%. Only about 3–6% of our lead trans-eQTL results could be found in previous studies, possibly reflecting the need for very large sample size when generating trans results or the dependence on the specific expres-sion platform and tissue being studied. Conversely, we were able to replicate a substantial proportion of previ-ously published eQTL results (up to 69% forcis and up to 10% fortrans-eQTL-gene pairs). Two previous studies [5, 6] have the limitation of combining, via imputation, genotypes from multiple platforms, which might lead to variation in imputation quality across SNPs. We used a single platform with approximately 550 K markers and successfully imputed 8.5 million SNPs. The study of Liang et al. [6] used two less dense genotyping platforms having approximately 100 K and 300 K markers; thus, it is not surprising that we found many more eQTLs espe-cially in regions where our denser genotyping array pro-vided better marker coverage. The genotype array used in the RNAseq-based study [7] was denser than our genotyping array, but the authors did not impute results to the denser 1000 Genomes SNP set. We were able both to replicate and extend the impressive findings of Westra et al. [5]. In our Cluster 39, which contains the highly pleiotropic GWAS SNP rs3184504, Westra et al. [5] observed multiple gamma interferon signaling genes and multiple toll-like receptor signaling genes as tar-gets of this trans-eQTL. We were also able to identify this strong trans-eQTL and extend its associated transcript list to five additional interferon signaling genes.
The strengths of our study include its large sample size, expression measurement carried out in a single laboratory with rigorous quality control, use of imput-ation to a dense set of 1000 Genomes SNPs, and extensive attention to controlling for artifacts in the expression data. As a consequence, we found that a substantial proportion of published GWAS SNPs associated with traits or diseases are themselves lead eQTLs for nearby (13%)
or distant (3%) genes. We determined that our full sample size detected 60% more target genes than did a subset of about half the original size, showing that many previously undetected eQTLs and target tran-scripts are probably newly detected with our study and that even more eQTL-eGene pairs remain to be discovered.
The very large proportion of variance explained (R2) values for the strongest eQTLs (up to 57% for cis and up to 22% for trans, Table 4), pointing to the very large influence that these variants can have on expression levels. Such high R2 values may also arise due to polymorphism-in-probe instances, but we used an ef-fective procedure for detecting such cases. Of course, it is possible that as yet undiscovered SNPs exist on probes and are responsible for some of these extreme R2values.
A further strength of our study is that the expression array contains far more probes and probesets than the arrays used in some other eQTL studies. For example, the array used in the meta-analysis of Westra et al. [5] (Illumina Human HT12) contains about 49,000 probe-sets, whereas the gene expression platform of this study, the Affymetrix Human Exon Array, contains almost six times more probesets. The additional probesets allow for the detection of expression changes along the entire length of the transcript, rather than primarily near its 3’end. These extra probesets also give added protection against polymorphism-in-probe artifact by averaging across the many probes for each transcript.
In addition to conducting this large genome-wide eQTL study, we have created a public resource of cis-eQTLs andtrans-eQTLs at the gene and exon level. Our results are based on a much larger cohort than any pre-vious public eQTL resource, and therefore reflects a higher degree of precision and specificity of eQTLs, eGenes, and eQTL-eGene pairs.
We acknowledge several limitations of our study. The homogeneity of the FHS population may limit the applicability of our results to populations of different ancestries. Lack of population diversity might also in-crease the size of LD blocks and thereby limit the reso-lution with which true regulatory sites can be identified. Despite statistical adjustments for imputed blood cell counts, our eQTLs might still reflect cell type admixture effects and might not be comparable to results obtained in other tissues. RNAseq-based methods for determining gene expression offer even higher resolution and may not be subject to the same biases accompanying microarray measurements. However, agreement of our study with a recent RNAseq-based study [7] was comparable to the level of agreement seen with several other microarray-based studies.
Conclusions
Despite these limitations, our results provide an exten-sive resource of cis-eQTLs andtrans-eQTLs at the gene and exon level and this information may be useful for elucidating the biological underpinnings of many GWAS SNP associations with disease traits. Our eQTL database will facilitate better understanding of novel pathways and associations across the human genome, which may contribute to new approaches for the detection, treat-ment, and prevention of diseases.
Methods Study participants
Recruitment procedures and clinical characteristics of participants from the FHS Offspring [10] and Third Generation cohorts [11] have been reported previously. Samples for this study came from 2770 individuals who attended the eighth Offspring cohort examination cycle (2005–2008) and 3341 individuals who attended the second examination cycle (2006–2009) of the Third Generation cohort. Protocols for participant examina-tions and collection of genetic materials were approved by the Boston Medical Center Institutional Review Board. All participants gave written, informed consent.
Isolation of RNA from whole blood, preparation, and hybridization
Fasting peripheral whole blood samples (2.5 mL) from FHS participants were collected during examination in PAXgene™ tubes (PreAnalytiX, Hombrechtikon, Switzerland), incubated at room temperature for 4 h for RNA stabilization, and then stored at −80 °C. Total RNA enriched with miRNA was isolated from fro-zen PAXgene blood tubes by Asuragen, Inc., according to the company’s standard operating procedures for auto-mated isolation of RNA from 96 samples in a single batch on a KingFisher® 96 robot. Tubes were allowed to thaw for 16 h at room temperature. After centrifugation and wash-ing to collect white blood cell pellets, cells were lysed in guanidinium-containing buffer. Organic extraction was performed prior to adding binding buffer and magnetic beads in preparation for the KingFisher run. The purity and quantity of total RNA samples were determined by absorbance readings at 260 and 280 nm using a Nano-Drop ND-1000 UV spectrophotometer. The integrity of total RNA was qualified by Agilent Bioanalyzer 2100 microfluidic electrophoresis, using the Nano Assay and the Caliper LabChip system.
Preparation of complementary DNA from RNA
RNA samples of 50 ng were amplified using the WT-Ovation Pico RNA Amplification System (NuGEN, San Carlos, CA, USA) as recommended by the manufac-turer in an automated manner using the genechip
array station (GCAS). In brief, first strand complemen-tary DNA (cDNA) was prepared using a unique first strand DNA/RNA chimeric primer mix and reverse transcriptase. In the second step, DNA/RNA Hetero-duplex Double Stranded cDNA was generated which served as the substrate for SPIA amplification – a lin-ear isothermal DNA amplification process developed by NuGEN. In the third step, amplified DNA along with RNA was treated with RNase H to degrade the RNA in the DNA/RNA heteroduplex at the 5’ end of the first cDNA strand which then served as the initi-ation site for the next round of cDNA synthesis. The process of SPIA DNA/RNA primer binding, DNA rep-lication, strand displacement, and RNA cleavage is re-peated, resulting in rapid accumulation of microgram amounts of SPIA cDNA. An aliquot of the SPIA cDNA was used for quantitative polymerase chain reaction (qPCR) analysis.
Target labeling and hybridization onto Affymetrix Genechips
Three micrograms of the amplified cDNA from the WT-Ovation Pico amplification step were processed with the WT-Ovation Exon Module in GCAS to produce sense strand ST-cDNA following the manufacturer’s (NuGEN, San Carlos, CA, USA) procedure; 5 μg ST-cDNA was fragmented and labeled with the FL-Ovation™ cDNA Biotin Module using a proprietary two-step fragmenta-tion and labeling process. The first step is a combined chemical and enzymatic fragmentation process that yields single-stranded cDNA products in the base range of 50–100 . In the second step, this fragmented product is labeled via enzymatic attachment of a biotin-labeled nucleotide to the 3-hydroxyl end of the fragmented cDNA generated in the first step. Hybridization, wash-ing, and laser scanning of Affymetrix Human Exon 1.0 ST microarrays were performed according to the manu-facturer’s protocol (Affymetrix, Santa Clara, CA, USA). Hybridization was performed at 45 °C overnight, followed by washing and staining using FS450 fluidics station. Scanning was carried out using the 7G GCS3000 scanner.
Affymetrix human exon 1.0 ST microarray platform This platform consists of approximately 6 million 25 base probes, grouped into about 300,000 four-probe pro-besets, each designed to target an exon of a transcript. Multiple probesets are grouped together to represent a set of transcripts from a single gene (called a transcript cluster). Transcript clusters are annotated to genes in a nearly one-to-one fashion. Transcript clusters have from one to several hundred probesets, depending on the length of the transcript, and form the basis of our
analysis here. Of the 12,396 transcript cluster IDs which are found to be eGenes (either cis- or trans-), only 244 are in a many-to-one relationship with an EntrezGene and 282 no longer map to an Entrez gene entry. Thus, a transcript cluster level analysis may be considered a proxy for a gene-level analysis.
Microarray data collection, quality control, and data adjustment
The intensity values for each gene chip were collected using the robust multi-chip average (RMA) method available in the Affymetrix Power Tools (APT) [41] Soft-ware version 1.12.0 (Affymetrix). A total of 287,329 Refseq-core [42] probesets representing 17,873 distinct genes from 6111 samples were extracted from the APT, based on NetAffx annotation version 31 [43]. Samples were excluded based on three factors: (1) values for a quality control (QC) metric, all_probeset_rle_mean≥0.7 [44]; (2) chromosome Y-linked gene expression did not agree with reported sex; and (3) when a DNA/mRNA sample pair mix-up is apparent, based on the top 395 eQTLs with minor allele frequency (MAF)≥0. The remaining 5626 samples with satisfactory results consti-tuted the study samples and were again normalized with RMA, retaining only core-level probesets. We deter-mined that many artifacts in the expression data could be reduced by adjusting for chipping batch, various tech-nical factors provided by Affymetrix APT program for each array hybridization, and for the first principal com-ponent (PC1) determined from the centered and unscaled RMA data. The technical adjustment factors were: all_ probeset_mean, all_probeset_stdev, neg_control_mean, neg_control_stdev, pos_control_mean, pos_control_stdev. all_probeset_rle_mean, all_probeset_mad_residual_mean, and mm_mean. In addition, we adjusted by Probeset-GroupDiff, which partially accounts for the non-random layout of probes on the Affymetrix Exon Array.
Several additional data adjustments were considered beyond the technical covariates described above. We tested the effects of: (1) including 40 PCs on the un-adjusted data; (2) including 20 PEER factors [45] on the unadjusted data; (3) including 20 PEER factors on the adjusted data; and (4) including 40 surrogate variables [46] on the un-adjusted data. The internal validation rate for cis-eQTLs (Additional file 1: Table S2) was greatest when 20 PEER factors were used with the adjusted data and this approach was selected as the method of choice.
Genotyping platform and SNP imputation
Of the 5626 microarray samples passing quality controls, 5257 were previously genotyped using the Affymetrix 500 K and MIPS 50 K platforms [47, 48]. From a total number of 549,781 genotyped SNPs, we removed
137,728 genotyped SNPs on the following filtering cri-teria: Hardy–Weinberg Equilibrium (HWE)P value < 1E-6 (22,018 SNPs), call rate < 96.9% (48,285 SNPs), MAF < 0.01 (66,063 SNPs), map mismatch from Build 36 to Build 37 (82 SNPs), missing a physical location (428 SNPs), number of Mendelian errors > 1000 (25 SNPs), residing outside of chromosomes 1–22 or X (786 SNPs), and duplicates (41 SNPs). This leaves the remaining 412,053 SNPs as input to Minimac [49], an implementation of genotype imputation software, MACH [50]. The 1000-Genomes
“cosmopolitan” SNP set [51] was used as the imput-ation reference platform. Minimac’s GIANT 1000 Ge-nomes Imputation protocol was used, with the SNP phasing options of:−rounds 20–states 200–phase– sam-ple 5, yielding a total of 39,315,185 SNPs. Of these, we chose SNPs with imputed quality score (R2)≥0.3 and MAF≥0.01, leaving a total of 8,510,936 SNPs for analysis of cis and trans association, all in hg19 coordinates. The genotyping data are available in dbGaP under study phs000342.v13.p9 (http://www.ncbi.nlm.nih.gov/projects/ gap/cgi-bin/study.cgi?study_id=phs000342), which is under the umbrella of the overall FHS study of phs000007.
We performed a principal component analysis (PCA) with 521 unrelated FHS participants (Additional file 1: Figure S7) along with HapMap individuals (CEPH with Northern and Western European ancestry (CEU, Pink), Yoruba from Ibadan, Nigeria (YRI, Red), Han Chinese from Beijing (CHB), and Japanese from Tokyo (JPT). The samples which entered the eQTL study are shown in Additional file 1: Figure S7. The program smartpca from the EIGENSOFT package was used to perform the PCA [52]. PCs for additional FHS participants were computed from the PC weights derived from that analysis.
We also charted the effect of imputation R2 on validation rates for that eQTL (Additional file 1: Figure S8). Validation rate rises nearly linearly with imputation R2 from about 58% (R2< 35%) to ~69% (R2> 85%). However, since the overall average imput-ation R2 for this set is 94%, the lowered validation rate for lower quality imputation has little impact on the final result.
Whole blood cell counts
Of the 5257 samples, 2181 from the Third Generation cohort had whole blood complete blood cell counts (CBCs, Beckman Coulter, Brea, CA, USA). The cell counts of the remaining samples were imputed using a partial least squares (PLS) prediction based on the gene expression data. Cross-validated estimates of prediction accuracy (R2) for the CBC components (WBC, RBC, plate-let, neutr
![Table 5) appear to target expression of six to 27 genes specific to CD71+ early erythrocytes or reticulocytes [21] (significantly enriched, Fisher ’s exact test P values 1.8E-33 to 1.2E-7)](https://thumb-us.123doks.com/thumbv2/123dok_us/57092.2506775/9.892.83.436.129.702/table-expression-specific-erythrocytes-reticulocytes-significantly-enriched-fisher.webp)