Lawrence Berkeley National Laboratory
Recent Work
Title
Do residential building energy efficiency standards reduce energy consumption in China? – A data-driven method to validate the actual performance of building energy efficiency standards Permalink https://escholarship.org/uc/item/14b833kh Journal Energy Policy, 131 ISSN 0301-4215 Authors Wang, Xia Feng, Wei Cai, Weiguang et al. Publication Date 2019-08-01 DOI 10.1016/j.enpol.2019.04.022 Peer reviewed
eScholarship.org Powered by the California Digital Library
1
Do Residential Building Energy Efficiency Standards Reduce Energy Consumption in China?
– A Data-Driven Method to Validate the Actual Performance of
Building Energy Efficiency Standards
– Xia Wang1 2, Wei Feng2, Weiguang Cai* 1, Hong Ren1, Chao Ding2, Nan Zhou2
1. School of Construction Management and Real Estate, Chongqing University, Chongqing, 400044, China
2. China Energy Group, Lawrence Berkeley National Laboratory, 1 Cyclotron Road, CA 94720, USA
*Corresponding author: W.G.Cai, email: [email protected]
Abstract: Building energy efficiency standards (BEES) are believed to be one of the most effective policies to reduce building energy consumption, especially in the case of the rapid urbanization content in China. However, there is little evidence backed up by measured data to validate the actual effectiveness of BEES in China. Using survey data collected from 1,128 households in Chongqing China, this study applied the propensity scores matching method to estimate the effect of two BEES levels: the 50%-BEES (low level) and the 65%-BEES (high level). Results show that buildings built with 65%-BEES, on average, can reduce cooling and heating electricity use intensity (kWh/m2/a) by 41%, compared to buildings in the absence of the BEES. Meanwhile, the adoption of 50%-BEES can reduce cooling and heating electricity use intensity (kWh/m2/a) by 38%. However, energy savings are not significant if comparing buildings with 65%-BEES and 50%-BEES. The results indicate that there exists a performance gap between calculated design performance savings and actual operation energy savings. These empirical findings provide policy makers with
2
valuable feedback on buildings’ actual performance. The findings suggest that it is necessary to incorporate outcome-based compliance pathways into the current BEES system. Lastly, a data-driven building policy evaluation mechanism should be developed in China. Energy consumption databases should be developed to support policies such as building energy codes and standards’ development and performance evaluation.
Keywords: Effectiveness of residential building energy efficiency standards, Household electricity consumption, Propensity Scores Matching method, Micro household survey
1. Introduction
Global building energy consumption by residential and commercial subsectors has shown a continuous growth trend, generating significant levels of carbon dioxide emissions. According to the latest report by the International Energy Agency (IEA), building energy use accounts for 30% of the total final energy consumption worldwide (IEA, 2017). As the world’s largest developing country, the share of energy used by the building sector in China is increasing rapidly. In 2015, the percentage of building energy use of the total final energy use in China was 20%, with the specific amount being 857 million tons of coal equivalent (tce), three times that used in 2001 (CABEE, 2017; Huo et al., 2018). However, China’s building energy use will increase continuously due to continuing new urbanization and improvement of the living standard of its citizens (Zhou et al., 2015). China’s total floor area exceeded 60 billion square meters (m2)in 2015 (CABEE, 2017; Huo et al., 2019a, 2019b). According to the “New Urbanization Plan (2014–2020)”, China’s total floor area will exceed 70 billion m2 and the total building energy consumption will reach 1.5 billion tce in 2030. Thus, saving energy and reducing emissions in China's
3
building sector is critical.
In response to this severely increasing trend of building energy demand, Chinese government has enacted many building energy efficiency policies. In particular, the development and implementation of building energy efficiency standards (BEES) are considered to be the important strategies in efforts to reduce building carbon emissions. The BEES system in China can be grouped into two categories: residential BEES and commercial BEES. From the perspective of regional climates, the BEES system can be grouped into five categories: severe cold (SC), cold (C), hot summer and cold winter (HSCW), hot summer and warm winter (HSWW), and temperate(T) (Guo et al., 2016). Some studies have provided the potential long-term insights into the impact of the BEES in China. For example, Reinventing Fire China(2016)pointed out that the BEES have the potential to reduce 700 million tons of carbon emissions by 2050. Yu et al. (2014) predicted that the BEES would reduce building energy demand by 13%–22% by 2095. McNeil et al. (2016) showed that the BEES would reduce space cooling and heating electricity demand by 17% by 2030. In other countries, the BEES also play a significant decisive role in reducing building energy demand and carbon emissions (Gillingham and Palmery, 2014). For instance, Yu et al. (2017) have shown that the BEES in Gujarat, India, could reduce building electricity demand by 20% in 2050. Livingston (2013) has demonstrated that the BEES could reduce 3,995 million tons of carbon emissions by 2040 in the United States.
However, the actual operation condition of energy-efficient buildings is different from the design condition. More and more studies have pointed out there is a performance gap between calculated and actual building energy performance (Bordass et al., 2004; Demanuele et al., 2010; Guerra-Santin and Itard, 2012; Accame
4
et al., 2012; Calì et al., 2016; Brom et al., 2018). Thus, actual energy savings by the BEES could be different from design savings (Li et al., 2014; Yan et al., 2017; Newsham et al., 2009). Misleading design savings by the BEES may confuse the process of setting the target for carbon emissions and hinder building energy conservation. In fact, over time, the effectiveness of energy efficiency policy literature based on “ex-post’ analysis methods using actual data is receiving increasing attention (Parfomak and Lave, 1996; Anderson and Newell, 2004; Maher, 2016). This kind of research considers actual occupant behaviour influences. Recently, some studies have been estimating the ex-post impact of the BEES on residential or commercial energy consumption in other countries (Papineau, 2017; Levinson, 2016; Kotchen, 2016; Jacobsen and Kotchen, 2013; Aroonruengsawat et al., 2009). However, work assessing the ex-post effect of BEES is quite scarce in China. A limitation of such analysis has been the lack of access to large samples and measured building energy use data.
To bridge the gap in the literature, this study aims to estimate the impact of BEES by using actual data in China, taking Chongqing as an example (Fig. 1). The reasons for selecting data from Chongqing as a test group are as follows. First, there is always a controversy about whether the BEES in the HSCW region can reduce electricity consumption. Some argue that the standards are not useful in the HSCW region (BERC, 2013) because local occupants often prefer to open windows (the outdoor environment is always humid). This human behaviour could reduce the insulation performance of the energy-efficient building envelope (Fu, 2002; Luyi Xu et al., 2013). Chongqing is a typical city of the HSCW region in China; based on this study, deep insights can be gained on how to develop the BEES in the HSCW region of China. Second, actual electricity data for surveyed households is available from
5
utilities. Since there is no complete micro-building energy consumption survey in China, getting household actual energy consumption data (such as electricity and gas data) is very challenging. Additionally, a survey on household characteristics, appliance characteristics, building characteristics, and occupant behaviours characteristics was conducted as part of this research.
This paper makes several significant contributions to the current literatures. This is the first attempt to evaluate the effectiveness of BEES by using “ex-post” analysis methods in China, unlike energy consumption simulation predictions savings of the BEES (L Xu et al., 2013; Chen and Lee, 2013). Results provide policy makers and engineers with valuable feedback on buildings’ actual performance and the effectiveness of the standards. Secondly, the analysis gives deep insight into the performance gap between calculated energy savings and actual energy savings. This discussion provides a foundation for incorporating outcome-based pathways into the current BEES framework to better achieve potential energy savings in the future. Additionaly, some specific building energy consumption behaviour data are provided for a future benchmark case in the BEES design work. Thirdly, the propensity score matching (PSM) method can be used to mimic randomisation by identifying a comparison group of households that is statistically similar with treatment households, based on observable characteristics. Since previous studies pointed out that matching strategies can mitigate covariate bias in models (Ho et al., 2007; Imbens and Wooldridge, 2009; Sekhon, 2009). The PSM approach yields coefficient estimated both before and after matching, thus, assuming selection on observables, an important source of evaluation error can be quantified when estimating energy savings.
6
theoretical framework. Section 3 presents the identification method and data source. Section 4 checks overlap assumption. Section 5 assess matching quality. Section 6 reports the empirical results and provides a deep discussion. Section 7 contains a sensitivity analysis of empirical results. Section 8 concludes the paper and proposes some policy implications.
Fig. 1 Design Climate Regions of China and the Location of Chongqing
2. Theoretical Framework
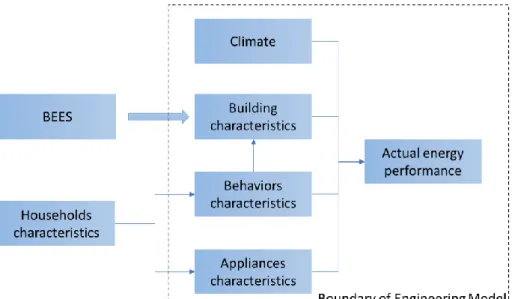
According to the IEA Energy Conservation in Buildings and Community Systems Annex 53, the energy use of buildings is driven by six factors (Yoshino et al., 2017): climate, building envelope, building equipment (energy service systems), building operation and maintenance, occupant behaviours, and indoor environmental conditions (Fig.2). Thus, to isolate the impact of BEES, other factors need to be controlled.
7
Fig. 2 Factors that affect energy use in buildings(Yoshino et al., 2017) Chongqing’s first BEES— “Design standard for energy efficiency of residential building DBJ50/5024-2002”—was introduced in 2002; it set the energy savings target of 50%1(hereafter, 50%-BEES). In 2007, the local government developed a revised version— “Design standard for energy efficiency 65% of residential building DBJ50-071-2007”—with energy saving targets of 65%2 (hereafter, 65%-BEES). In 2010, the local government further ensured the strategy of implementation of the 65% reduction of energy consumption in residential buildings and established a new standard. The new standard, which has the same energy saving targets of 65% as the older one (DBJ50-071-2007) but provides more advanced energy-saving technical measures to achieve reduction targets, is titled “Design standard for energy efficiency 65% of residential building DBJ50-071-2010”. DBJ50-071-2007 first took effect in the main district of Chongqing, and DBJ50-071-2010 was compulsory in all of Chongqing. This paper focuses on the effectiveness of DBJ50/5024-2002, DBJ50-071-2007, and
150% refers to the set target of 50% energy reduction in the building’s cooling and heating electricity consumption
compared with no building energy efficiency standards of ordinary buildings (CMCURD, 2002).
2 65% refers to the set target of 65% energy reduction in the building’s cooling and heating electricity
consumption compared with no building energy efficiency standards of ordinary buildings (CMCURD,2007; CMCURD,2010).
8
DBJ50-071-2010. Since DBJ50-071-2007 and DBJ50-071-2010 share the same energy efficiency reduction goal, the standards are grouped into two categories: the 50%-BEES (DBJ50/5024-2002) (low level) and the 65%-BEES (DBJ50-071-2007 and DBJ50-071-2010) (high level).
The BEES in Chongqing are designed to reduce cooling and heating electricity use intensity (CHEUI, kWh/m2/a) by covering the energy efficiency requirement for heat transfer performance (U-values) of the building envelope, the cooling and heating system, and assumed occupant behaviours (CMCURD, 2010, 2007, 2002). Specifically, the insulation level, shape coefficient, and other major parameters of building characteristics are regulated. The energy efficiency ratios (EER) of air-conditioners (ACs) and heating are assumed in the baseline setting. In addition, the EER of other home appliances (i.e., washing machines, televisions, etc.) are not regulated in the BEES. Assumed occupant lifestyle is “Full-time and Full-place” use and the application of cooling and heating. The conceptual framework of this study is as Fig 3.
Fig. 3 Theoretical Framework
9
the mean CHEUI of buildings built under different versions of a standard is unlikely to yield an accurate estimate of the actual electricity use in buildings, because the calculation ignores other confounding factors, shown in Fig. 3, that affect actual building operation (Levinson, 2016; Papineau, 2017). The effectiveness of standards should be evaluated by comparing the CHEUI difference in the same building before and after implementing the standards. Ideal experimental data could provide electricity use data on the counterfactual situation and solve the problem of causal inference. However, pre- and post-standard CHEUI data are rarely available for the same building. This problem is called “missing data”(Rosenbaum and Rubin, 1983). Using notations for the Neyman–Rubin causal model (Rosenbaum and Rubin, 1983), counterfactual samples can be found. Counterfactual samples here mean buildings in the absence of the BEES (hereafter, inefficient buildings, denoted as IBs).
In this study, we set three comparison groups to explore three questions. The first one concerns the impact of 65%-BEES on electricity savings compared to IBs—the treatment group is buildings built with 65%-BEES, and the control group is IBs. The second one concerns the effectiveness of 50%-BEES compared to IBs; the treatment group is buildings built with 50%-BEES, and the control group is IBs. The third one concerns whether high level standards are more effectiveness than low level standards; the treatment group is buildings built with 65%-BEES, and the control group is buildings built with 50%-BEES. This study focuses on the BEES in the same place, thus excluding climate influence. Based on Fig. 3 and considering the data availability, the control covariates are as follows.
Household characteristics, includingnumber of household members (denoted as
population), total annual income (denoted as income). The number of household members is commonly considered as an important indicator to predict energy use
10
(Song et al., 2017 Li et al., 2011). Also, previous studies have identified household size as a key factor influencing energy use (Khanna et al., 2016; Horowitz et al., 2014). Income is confirmed as having an impact on energy usage (Chen et al., 2013). We treat income as a category variable. The questionnaire provided five income interval options: “less than ¥30,000”, “¥30,000- ¥60,0000”, “¥ 60,000-¥120,000”, “¥120,000-¥200,000”, “more than ¥200,000”.
Appliance characteristics, including the number of room ACs3 (denoted as ACs) and the number of electric heaters (denoted as electric heaters) installed in the household, and the energy efficiency labels for room ACs (denoted as EEL). The numbers of ACs and electric heaters used represent independent variables influencing electricity use (Chen et al., 2013). Energy information labelling for residential appliances is an important energy conservation policy to control energy demand (Khanna et al., 2016). In our study, we consider EEL for ACs as an observable variable of appliances’ characteristics. China Energy Labels rank the energy efficiency of ACs into three classes. Grade 1 represents the most energy efficient and Grade 3 the least (Zhou and Bukenya, 2016). Therefore, we provide three EEL interval options: “Grade 1”, “Grade2”, and “Grade3”.
Building characteristics include floor area (denoted as area), the number of rooms (denoted as rooms), and the number of floors (denoted as floors). Floor area is regarded as a significant parameter affecting energy demand (Li et al., 2014). A large number of rooms are normally associated with more sets of space cooling and heating appliances. The number of floors refers to the total number of floors of buildings the residents lived. The shape coefficient of buildings varies with the number of floors in
3 Room ACs : Since there is no district heating system in the HSCW region of China (Guo et al., 2015), residents
11
the building (CMCURD, 2010). The shape coefficient of buildings is related to the envelope’s heat transmission coefficient (K) (CMCURD, 2010). K is a key indicator of energy demand (CMCURD, 2010). In this study, the built year is not explicitly mentioned as a covariate, the detailed reasons are explained in Appendix A.
Occupant behaviour characteristics, including status of windows when using ACs in summer (denoted as status of windows), temperature setting of ACs in summer (denoted as temperature setting ACs), and daily number of hours of use of ACs in summer (denoted as time using ACs). According to a previous study (Chen et al., 2010), the usage of ACs in summer contributes much to energy use in the HSCW region in China. Thus, we just considered the occupant behaviour in relation to ACs use in summer as observable characteristics. The ventilation rate is an important indicator regulation in the BEES, influencing both cooling and heating energy demand (CMCURD, 2010, 2007, 2002). We use ‘status of windows when using ACs’ as a variable measure actual ventilation rate. According to the literature, the temperature setting of ACs and the time of heating/cooling usage have a significant influence on heating/cooling energy consumption (Cheng and Steemers, 2011).
3. Identification strategy
3.1 Matching strategy
Following previous studies (Aroonruengsawat et al., 2009; Jacobsen and Kotchen, 2013; Koirala et al., 2013) the following equation is proposed:
(1)
Where standards is a dummy variable, which refers to an indicator for whether j residence j was built with the BEES. standards =1 signifies the treatment group, and j
j
standards =0 signifies the control group. The outcome dependent variable represents the log of CHEUI (kWh/m2/a) in residence j (denoted as lnY ), letting j Y1jbe the
12
amount of CHEUI (kWh/m2/a) of household j in the treatment group. Y0j is the amount of CHEUI (kWh/m2/a) of household j in the control group. Xjis a vector of the observable residence characteristics of each household j that affect operation electricity use, and jis an error term. The average treatment effect on the treatment
(ATT) with regard to the power-saving effect of the BEES can be expressed as:
j j
1j j, 0 j j,
ATT=E[lnY | X standards =1]-E[lnY | X standards =1] (2)
Where ATT is measured as the percentage of electricity change in kWh per meter. The main identification assumption is for each treatment of household j; matches of control household j with similar observable residence characteristics must be found. A problem arises when using non-experimental data because only one of these two statuses is actual observed; that is, either Y1j or Y0jis observed for each household j, but not both. In equation (2), the problem of selection bias is straightforward, because Y0j is unobservable. If,
j j
0 0
[lnY j| standards =1]= [lnY j| standards =0]
E E , IBs can be used as an adequate
control group. However, this condition is rarely satisfied with non-experimental data (Rosenbaum, 2005). There is, typically, covariate bias between the treatment and the control group, which causes estimation bias with the regression-based method. In earlier studies evaluating building performance data, overt bias has been controlled for either by using matching algorithms based on propensity scores or by taking advantage of the fact that the treatment and control groups differ in ways that are significant for the outcome being studied (Deng et al., 2012; Eichholtz et al., 2011). The PSM method, provided by Rosenbaum and Rubin (1983), is the conditional probability of assignment to a particular treatment given a vector of observed covariates. This study matched homes on analysis of 11 characteristics based on
13
theory and found in the literatures to affect building energy consumption. According to the notation for the Rosenbaum and Rubin causal model (Rosenbaum and Rubin, 1983) ,the preferred specification is expressed as:
j j
1j j , 0 j j , j
ATT=E{E[lnY | P(X ) standards =1]-E[lnY | P(X ) standards =0]|standards =1} (3) Where (P Xj) refers to the propensity score of observable characteristics Xjin our study. The observable characteristics are selected to maintain two standard identifying assumptions. First, for each household j, the observed residence covariates, Xj, are conditionally independent of the treatment [i.e., conditional independence assumption (CIA)]. Second, households with the same covariates have a positive probability of treatments or control group, 0 < (P Xj) < 1 in the common support (i.e., overlap assumption).
Based on Caliendo and Kopeinig (2008), which provided us with detailed guidance for implementing PSM, the effectiveness of the BEES is estimated in five steps.
First, the propensity score is estimated. Two standard probability methods (i.e., logit and probit) have been proposed to calculate the propensity score. Lechner (2001) finds little difference between the performances of the two models. Thus, we applied the logit model4. Another important condition for estimating the propensity
score is that more covariates that affect the outcome variable should be included in this model because omitting important variables can significantly increase bias in the
4. (Xj) j (Xj) (X ) 1 = + h h e P e
Where P(X )j refers to the propensity score of covariates X in residence j .h(X )j is made up of linear and higher-order terms of the covariates on which we condition to obtain an ignorable treatment assignment (Dehejia and Wahba, 2002).
14
resulting estimates. Therefore, based on a theory proposed by Yoshino et al. (2017), 11 matching covariates are included in our study.
The second stage is to match each treatment household j with each control household j according to the closeness of their propensity scores. Previous studies have suggested several matching algorithms, including nearest neighbour matching, kernel matching, and radius matching5(Imbens, 2004; Smith and Todd, 2005). The performance of different matching algorithms varies case by case and depends largely on the data sample and distribution (Ho et al., 2007). To verify the robustness of the results, we implement two matching methods: radius matching and kernel matching. Additionally, we use a bootstrapping methodology to calculate the standard error for the estimate of the standards impact.
The third step is to check the overlap and region of common support. The density distribution of the propensity score is the most straightforward way to envision common support (Caliendo and Kopeinig, 2008).To guarantee that every treatment household can be matched with a similar control household according to the propensity score, households whose propensity scores are either larger than the maximum or smaller than the minimum in the opposite group will be removed from the sample (Caliendo and Kopeinig, 2008). See section 4 for details.
The fourth step is to assess matching quality since it is satisfactory one can move on to estimate the treatment effects. Several procedures mentioned in the literature can be used to evaluate the matching quality, including standardised bias (SB)6, t-test, K-S distribution test, Pseudo-R2 and empirical quantile-quantile (QQ)
5 In our study, we will not discuss the technical details of each estimator in depth; see Smith and Todd (2005) or
Imbens (2004) for more technical details.
15
plots (Rosenbaum and Rubin, 1983; Rosenbaum and Rubin, 1985; Caliendo and Kopeinig, 2008; Imbens and Wooldridge, 2009). The basic idea of these methods is to check before and after matching to ascertain whether systematic differences in covariate distributions remain. This study uses SB, t-test, and Pseudo-R27 to evaluate matching quality. See section 5 for details.
The final step is to test the sensitivity of results with respect to ‘hidden bias’. The PSM estimator is based on CIA. We therefore need to test how strongly unobservable characteristics must affect the selection process to undermine the implications of matching analysis. We use Rosenbaum’s bounds (Rosenbaum, 2002) to address this problem. See section 7 for details.
3.2 Data sources and statistics 3.2.1 Overview of data collection
This survey was conducted by Chongqing University, in collaboration with the Chongqing Municipal Commission of Urban-Rural Development (CMCURD) and the State Grid Chongqing Electric Power Company (SGCEPC) from June 2016 to November 2016. The questionnaire covers five main areas: building characteristics, household characteristics, appliances characteristics, occupant behaviour characteristics, and energy data. Approximately 40 undergraduates, 10 graduate students, and 4 Ph.D students took part in this data collection activity. The details about collection stages are introduced in the Appendix B.
2 2 , , 100 | (S S ) / 2 − = + treat control x treat x control X X SB
whereXcontrol is the mean of the control group and Xtreat is the mean of the treatment group; Sx control2, is the
variance of the control group and Sx2,treat is the variance of the treatment group.
16
After validity and consistency checks, we finally obtained 1,128 households’ monthly electricity consumption data, along with their survey responses. The households included 504 households in buildings built with the 65%-BEES, 338 households in buildings built with the 50%-BEES, and 286 households in IBs. Specifically, the IBs investigated in this study were constructed before 2004, while buildings built with 50%-BEES and 65%-BEES were constructed during 2005–2009 and after 2010, respectively.The average age of 65%-BEES is 4.2 years, the average age of 50%-BEES is 8.8 years, and the average age of IBs is 14.5 years.
Table 1 shows the surveyed data compared to statistics in the urban areas of China and Chongqing Municipality. Except for the ownership of ACs, the surveyed population could represent the general urban population in Chongqing. The higher ownership of ACs might be caused by the surveyed population being mainly located in the urban area, while the data of the Chongqing Statistical Yearbook is for the whole of Chongqing Municipality, including suburban and rural township areas between the city and countryside in the Chongqing Municipality. The survey data which was conducted in Chongqing in 2014 showed that the ownership of ACs is 248 units per 100 households in urban areas, while the ownership of ACs is just 82 units per 100 households in rural township areas(Zhang, Yun.Huang, 2015).
Table 1 Comparison of Survey data with national and Chongqing Municipal Statistic Yearbook in 2016
Index Unit Survey(n=1128) Chongqing
Municipal
National
17
members
Average floor area per person m2 30.23 34.00 35.27
Ownership of ACs per 100 households
- 302.1 181.1 123.7
Ownership of electric heaters per 100 households
- 46.9 - -
3.2.2 Data description
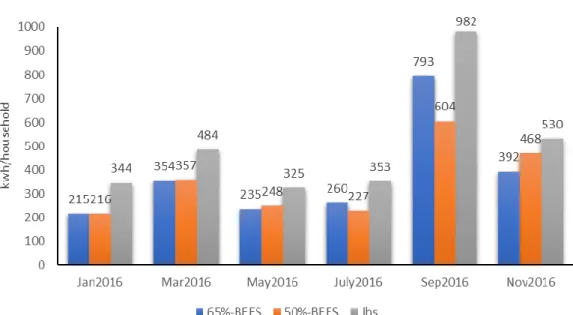
Fig. 4 to Fig. 6 show the distribution of monthly electricity consumption of 65%-BEES, 50%-BEES, and IBs. The mean values per two months’ of electricity consumption in buildings built with 65%-BEES range from 215 to 793 kWh/household, while the values in buildings built with 50%-BEES range from 216 to 604kWh/household and the values in IBs are between 325 and 982 kWh/household. The monthly amounts in summer are larger than those in winter. There are seasonal patterns in electricity consumption. The total mean values for each two-month period in IBs is larger than in 65%-BEES and 50%-BEES.
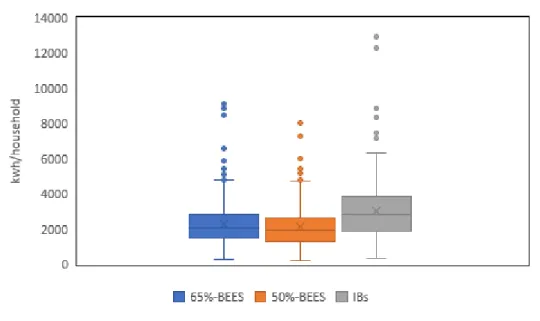
Fig. 5 shows the distribution of annual electricity consumption (kWh/household) in each building. The average electricity in buildings built with 65%-BEES is 2,249 kWh/household/a, while the value in buildings built with 50%-BEES is 2132 kWh/household/a and that in IBs is 3018 kWh/household/a.
The outcome variable CHEUI (kWh/m2/a) is estimated according to monthly electricity consumption. There are four distinct seasons in Chongqing. The cooling season is from June 1 to September 30, and the heating season is from December 1 to February 28 (CMCURD, 2002). Thus, the difference in electricity consumption between the cooling/heating seasons and the non-cooling/heating seasons can be used
18
to estimate CHEUI. The method used is similar to the research by Chen et al. (2009), Ouyang et al. (2009a), and Zhaojian (2006). The average CHEUI for IBs is 10.24 kWh/m2/a, with a standard deviation of 6.51 kWh/m2/a in this data. The average CHEUI for buildings using the 50%-BEES and 65%-BEES is 9.25 kWh/m2/a, with a standard deviation of 7.00 kWh/m2/a, and 8.66 kWh/m2/a, with a standard deviation of 6.06 kWh/m2/a, respectively (Fig.6).
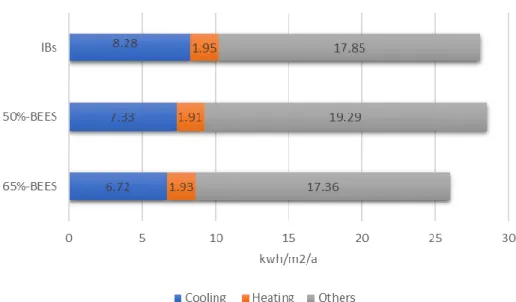
Fig. 7 further demonstrates the breakdown of end users in annual mean average electricity use intensity (EUI). The average EUI value in 65%-BEES is 26.01 kWh/m2/a; that in 50%-BEES is 28.53kWh/m2/a; and that in IBs is 28.08 kWh/m2/a. The share of cooling electricity usage in total buildings’ electricity usage for both 65%-BEES and 50%-BEES is 26%, and 29% for IBs. The share of heating electricity usage in total building electricity use for these three types buildings is the same in Chongqing, approximately 7%. Obviously, the share of cooling in total building energy use is higher than that at the national level (2%), and the percentage of heating in total is lower than that at the national level (54%) (Zheng et al., 2014). The variables’ statistics are as in Table C.1.
19
Fig. 4 Mean electricity per two months’ values of the households in the three types of buildings
Fig. 5 The distribution of annual electricity consumption of households in the three types of buildings
20
Fig. 7 Breakdown of end-user in mean annual energy use intensity in the three types of buildings
4. Checking overlap assumption
As mentioned above detailed steps of matching strategy, this paragraph shows the density distribution of the propensity score in both groups before matching so that to check the overlap and the region of common support between treatment and control groups (Fig. 8). The left-hand side of Fig.8 (a) shows the density of estimated propensity scores for 65%-BEES compared to IBs, before matching. The red lines represent the propensity score of the X-covariate in the treatment group, and the blue line represents the propensity score of the X-covariate in the control group. The left-hand side of Fig. 8 (b) and Fig. 8 (c) could be explained in the same way with Fig. 8 (a). Although there is a discrepancy in propensity scores between the treatment and the control groups, the common support assumptions of these three comparison groups are all satisfied. For example, in Table C.2, when comparing 65%-BEES with IBs using the two matching procedures, the number of households in the treated satisfying the common support accounts for 79% of the total samples. And the percentage of residences in the control group meeting the common support is 81%.
21
The other two comparison groups also satisfy the overlap assumption with the matching samples constituting nearly 80% of the total samples.
(a) (b)
(c)
Fig. 8 Estimated Propensity Scores of 65%-BEES compared to IBs (a), 50%-BEES compared to IBs (b), and 65%-BEES compared to 50%-BEES (c)
5. Assess matching quality
The results of a balance check of covariates are reported in Table C.3, Table C.4 and Table C.5. To isolate the impact of BEES, we need to control other confounding factors that affect electricity usage. Therefore, after matching, there should be no systematic differences in observable covariates’ distribution. As can be clearly seen from the right-hand side of Fig. 8 (a), (b) and (c), the propensity score was balanced after matching. The existence of good matching quality can be
22
confirmed by using these two matching methods for all comparison groups in our study. For example, in Table C.3, the average SB for all observed variables is 14% before matching, while, after radius matching and kernel matching, the average SB decrease by 6.2% and 6.7%, respectively. The SB for each covariate is apparently lower than before matching (all below 20% after matching). In empirical studies, there is a lack of a standard reference value for SB after matching to assess matching quality (Rosenbaum and Rubin, 1985; Asensio and Delmas, 2017), therefore, we evaluate balance check associates with other two indicators (t-test and pseudo-R2). The t-test indicators show that household and building characteristics are significantly different between the treated and the control groups before matching (see column 5 in Table C.3), while, after matching, t-test values for most variables are not significant (see columns 9 and 13 in Table C.3). This indicates that the matching procedures we applied balance the bias in covariates’ distribution. Then, the results of comparing the pseudo-R2 values before and after matching show that pseudo-R2 values for the radius and kernel approach are relatively low (pseudo-R2 =0.009) after matching. Table C.4 and Table C.5 could be explained in the same way with Table C.3.
6. Results and Discussion
6.1 The effectiveness of BEES on electricity consumption
The empirical findings for 65%-BEES compared to IBs and 50%-BEES compared to IBs are reported in Table 2 and Table 3, respectively. In general, there is little difference between the quantitative results for different matching algorithms because of the number of available matching samples varying with matching algorithms (Table C.2), but the qualitative findings are similar. The buildings built with 65%-BEES had an average treatment effect on electricity consumption (kWh/m2/a) of approximately 41% in households (significant at the 5% level, standard
23
errors are clustered by bootstrap 500) compared to those IBs (Table 2). The results of these two estimates indicate that buildings built with 65%-BEES could truly reduce electricity usage at the operation stage of buildings. Compared to IBs, there is also a significant positive effect on reducing electricity consumption by adopting 50%-BEES (Table 3). And the ATT is 38%. The results suggest that buildings built with 50%-BEES could promote electricity reduction during the operation stage.
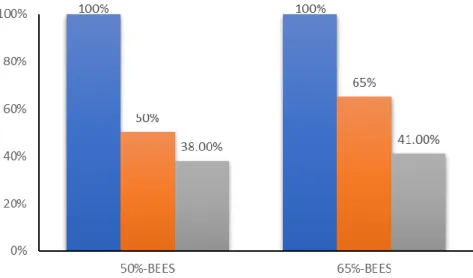
In general, the empirical results suggest that adopting 65%-BEES and 50%-BEES can reduce electricity use to some extent. However, there is a performance gap between calculated and actual energy-savings (Fig. 9). The BEES have set the targets of 50% and 65% cooling and heating electricity consumption reduction for buildings built without any energy-efficiency measures. The 50% and 65% saving targets are expected to be achieved through improvement of the U-values of the building envelope, the energy efficiency of heating and cooling equipment, and assumed occupant lifestyle (Yang, 2011). However, the actual performance of standards is influenced by building construction quality, the energy efficiency of cooling and heating equipment, occupant lifestyle, and climate (Evans et al., 2017, 2010; Feng et al., 2014; Lee and Chen, 2008; Menezes et al., 2012). Thus, the big difference in calculated savings and actual savings can be explained from two aspects: the quality of building construction and the differences in design condition and actual operating condition.
Table 2 Energy savings of 65%-BEES (65%-BEES compared to IBs)
Matching method ATT Std. Err.
(Bootstrap=500)
P value
24
Radius Matching -0.405 0.072 0.000
Table 3 Energy savings of 50%-BEES (50%-BEES compared to IBs)
Matching method ATT Std. Err.
(Bootstrap=500)
P value
Kernel Matching -0.382 0.095 0.001
Radius Matching -0.380 0.095 0.001
Fig. 9 The performance gap between calculated and actual operations in cooling and heating electricity savings using different standards
6.1.1 Building construction quality
The U-values of the building envelope is a vital item of regulation in the BEES to achieve potential energy savings. The quality of building work could affect the implementation of building energy efficiency technologies(Repository, 2012; Guo et al., 2016), although this phenomenon has not been tested empirically. We explore these reasons on the basis of some qualitative evidence. First, at the onset of the
25
implementation of the BEES, the compliance rate at the construction stage was relatively low because of a lack of monitoring following construction (Guo et al., 2016). According to a survey conducted by the MOHURD, at the national level, only 21% of new buildings met the energy-saving standard at the construction stage (MOHURD, 2008). In Chongqing, the percentages were much lower, approximately 20% (Cai et al., 2009; Luyi Xu et al., 2013). Additionally, since there are no separate criteria for different construction classes of building envelope in China (Hong, 2009), it is difficult to estimate the quality of building envelopes. Second, inferior materials used may affect the actual performance of the BEES (Guo et al., 2016). Labelling energy properties in building materials as part of standard procedure is often overlooked (Evans et al., 2017). Implementing a higher level of BEES would increase the cost of building construction. In China, building envelope material testing, rating, and labelling are done by construction companies, so most BEES are still being implemented in a command-and-control fashion (Li and Shui, 2015). Third, interior decorating by occupants may damage the thermal insulation performance of the building envelope(Tian and Wei, 2004),affecting the actual performance of the BEES. In China, 51% of residential buildings is decorated by the occupants (Yu et al., 2017). About 87% of occupants lack knowledge of either the structural or the thermal insulation in the building envelope(Yu et al., 2017), which may damage external thermal insulation systems. Damage to the external thermal insulation system will result in more heating energy being absorbed by the outer wall and then release to the exterior, thereby increasing energy waste.
6.1.2 Difference in design condition and actual operation condition
Table 4 shows the difference in parameters between design condition and actual operation condition. First, there is a significant discrepancy between the design
26
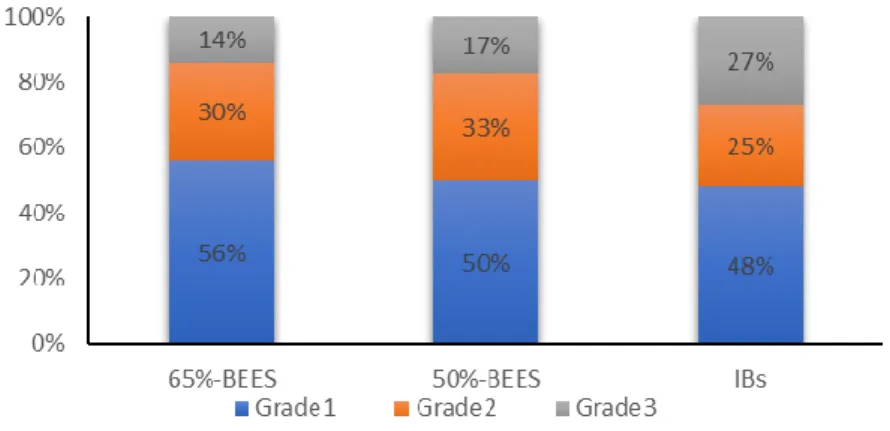
condition EER of cooling and heating systems and the real situation. For example, according to Table 4, the standards show that the design condition assumption of EER of ACs ranges from 2.2 to 2.8, while the EER of the heating system ranges from 1.9 to 2.8 (CMCURD, 2010, 2007, 2002). There are significant differences in the assumed EER of ACs or heating equipment between different standards. Therefore, 20% of the total energy reduction target in the standards is estimated to achieve with improvements in the energy efficiency of cooling and heating equipment (Yang, 2011) . However, survey results reported in this paper suggested that, in fact, the share of three efficiency levels of ACs (Grade 1, Grade 2 and Grade 3) in the IBs is similar to that in the other two types of buildings (Fig.10), which may result in low actual energy-performance savings from application of the standards. Additionally, survey results show that the actual average CHEUI in IBs is 10.23 kWh /m2/a, 9.24 kWh /m2/a for buildings built with 50%-BEES, and 8.65 kWh /m2/a for buildings with 65%-BEES. The differences in calculated and actual electricity consumption are shown in Fig.11.
27
Fig.11 Actually cooling and heating electricity consumption and regulation limits values (kWh/m2/a) (CMCURD, 2010, 2007, 2002).
28
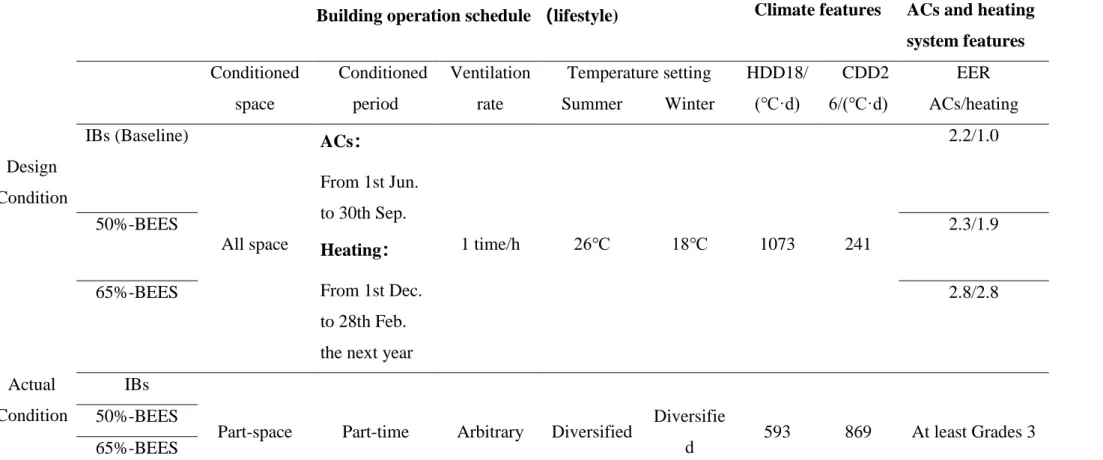
Table 4 The design parameter regulation in BEES and the real condition surveyed
Building operation schedule (lifestyle) Climate features ACs and heating
system features Conditioned space Conditioned period Ventilation rate Temperature setting HDD18/ (℃·d) CDD2 6/(℃·d) EER
Summer Winter ACs/heating
Design Condition IBs (Baseline) All space ACs: From 1st Jun. to 30th Sep. Heating: From 1st Dec. to 28th Feb. the next year
1 time/h 26℃ 18℃ 1073 241 2.2/1.0 50%-BEES 2.3/1.9 65%-BEES 2.8/2.8 Actual Condition IBs
Part-space Part-time Arbitrary Diversified Diversifie
d 593 869 At least Grades 3
50%-BEES 65%-BEES
29
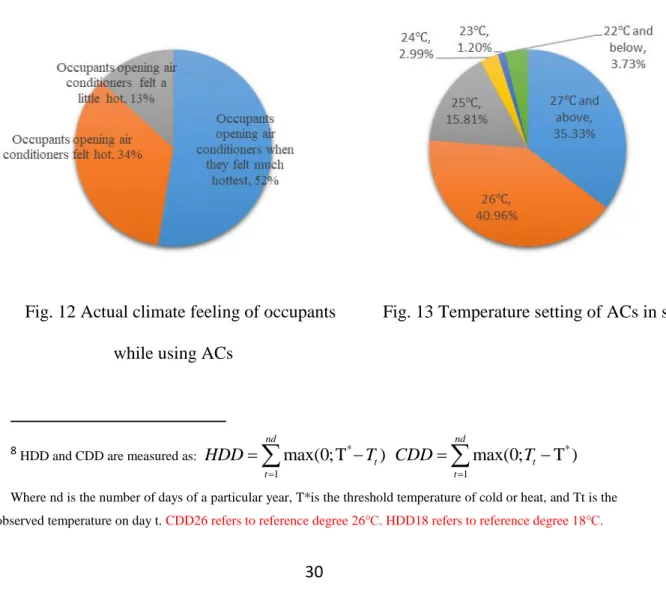
The second difference in the design condition and the real condition is the building operation schedule. (1) The assumed lifestyle in the standard consumes more electricity than the actual lifestyle. The assumed lifestyle is described as “Full-time and Full-place” use and the application of cooling and heating. “Full-time” represents cooling and heating systems operating all the time during cooling times (June 1– September 30) and heating times (from December 1 to February 28) (Table 4)(CMCURD, 2002). Meanwhile, the actual behaviour of households in turning on ACs, determined by this survey, is shown in Fig. 12. Fifty-two percent of total residents indicated that they would turn on their ACs when they felt “the hottest”, and 34% of total residents reported that they turned on their ACs when they felt “hot”. Likewise, 13% of total residents reported that they would turn on their ACs when they felt “a little hot”. These behaviours reveal a different lifestyle parameter than the “full-time” use and different behaviours in relation to ACs than is assumed in the design standard. “Full-place” signifies cooling and heating systems operating in all areas of the residential buildings. Meanwhile, the actual lifestyle variable can be described as “part-time and part-place” use in the application of cooling and heating. In fact, nearly all households surveyed said that when they use ACs they either limit the use to one bedroom or use them when there is somebody in the room; this signifies less time spent using ACs than is assumed in the standards. (2) The regulation temperature setting to turn on ACs in summer is 26 °C in the BEES. The actual temperature set to turn on ACs is shown in Fig. 13. Just 41% of households set thermostats to turn on the ACs at 26 °C. (3) The ventilation rate regulation in the standards is 1 time/hour, whereas the ventilation rate is arbitrary in reality. People who live in Chongqing prefer to open windows. This behaviour has resulted in a significant discrepancy between predicted and actual thermal insulation performance.
30
As suggested in the survey results (Fig. 14), 18% of occupants prefer to open windows to cool a space. And, as suggested in Fig. 15, 33% of occupants open either windows or doors when they are using ACs.
The third difference is that outdoor temperature parameters are different from the designed parameters in the standards. Outdoor temperature parameters are defined as heating degree days (HDD) and cooling degree days (CDD). HDD and CDD values in the standards all use typical meteorological year parameters, which are, respectively, 1073 (°C ·d) for CDD 26 and 241 (°C ·d) for HDD 18 (CMCURD, 2010, 2007, 2002). However, actual CDD 26 and HDD 18 in 2016 are different from regulation values. According to Blázquez et al. (2013), Chongqing’s average actual CDD 26 and HDD 18 in 2016 are 869 (°C d) and 593 (°C ·d)8, respectively.
Fig. 12 Actual climate feeling of occupants while using ACs
Fig. 13 Temperature setting of ACs in summer
8 HDD and CDD are measured as: * 1 max(0; T ) = =
nd − t t HDD T * 1 max(0; T ) = =
nd t− t CDD TWhere nd is the number of days of a particular year, T*is the threshold temperature of cold or heat, and Tt is the observed temperature on day t. CDD26 refers to reference degree 26℃. HDD18 refers to reference degree 18℃.
31
Fig.14 Percentage of occupants using different cooling methods
Fig. 15 The status of windows and doors when using ACs
6.2 Do high-performance standards reduce electricity by more than do low-performance standards?
Unexpectedly, the power-saving effect of buildings built with high level standards (65%-BEES) compared to buildings built with low level standards (50%-BEES) is not significant (P value=0.9) (Table 5). But this result does not mean that high-performance standards are ineffective. This empircial result is likely due to the fact that actual heating and cooling energy use in Chongqing is relatively low, based on the current heating and cooling usage pattern, especially for the heating electricity demand (Fig. 11). Compared to the 47% share of heating in total building energy use (Bin and Jun, 2012) in northern China, the share in Chongqing is just 7%. Most people in the HSCW region have a high tolerance to cold (Ouyang et al., 2009b). The survey results show that approximately 55% of the surveyed households do not adopt heating in winter (Fig. 16), and similar survey results were obtained in the HSCW region (Ouyang et al., 2009b). This phenomenon is down to the so-called North– South heating line. In the 1950s, the central government established district heating in
32
the northern region of China. However, in South China, residents manly use their own heating equipment in the winter, for example, room ACs, electric heaters, or gas-fuelled heating. Our survey shows that 11% of occupants use ACs for space heating on even the coldest days, and 6% of them use electric heaters for auxiliary heat. Twenty-nine percent of the occupants use only electric heaters for space heating. Additionally, our empirical findings are the same as those of a typical experiment conducted by Tsinghua University in Shanghai (BERC, 2013); when actual use and application of heating is “part-time and part-place”, the differences in annual energy use between different insulation levels is not significant (see life 5 in Fig. 17).
However, the findings do not mean that high-performance standards are not needed at all in HSCW zones. This is because the effect of high-performance standards on electricity savings would be more distinct in the future if people grow richer and use more power for heating and cooling. There has been evidence that high-performance insulation of the building envelope has a significant effect on energy savings when residents’ lifestyle is ‘Full-time and Full-place” use and the
application of heating (see life 1 in Fig. 17) (BERC, 2013). Therefore, in Chongqing, high-performance insulation of building envelopes and superior standards are needed to face an increasing trend of heating demand (Hu et al., 2016).
Table 5 Energy savings of BEES (65%-BEES compared to 50%-BEES)
Matching method ATT Std. Err.
(Bootstrap=500)
P-value
Kernel Matching 0.014 0.078 0.857
33
Fig. 16 Percentage of occupants using different heating appliances
Fig. 17 Energy consumption by different heating lifestyle9 under differences
9 Lifestyle 1 means people adopt heating in all areas in the whole day (24 hours) with the indoor temperature
being kept at 18℃.
Lifestyle 2 means that people only use heating when they come back home with the indoor temperature being kept at 18℃.
Lifestyle3 means that people only use heating when they stayed in one room with the indoor temperature being kept at 18℃.
34
insulation performance of envelope(BERC, 2013)
7. Robustness checks
This study applied Rosenbaum’s bounds to evaluate the sensitivity of our estimates to hidden bias (Rosenbaum, 2002). Table 6 represents the results of our sensitivity analyses for hidden bias. A sensitivity parameter, Γ, is used to measure the extent to which hidden biases of various magnitudes might alter the conclusions of the study. According to this, we can estimate changes in p values or significance levels in the presence of potentially unobserved confounding factors. The critical Γ values are 2.25 for the 65%-BEES and 2.23 for the 50%-BEES. For the 65%-BEES compared to IBs, for example, the essential values of Γ 2.25 means that unobservable covariates would have to influence the outcome electricity consumption (kWh/m2/a) by 2.25 times before we would change our inference at the 90% confidence level. Unobservable confounding factors for 50%-BEES compared to IBs should result in the need to change electricity consumption of buildings built with 50%-BEES by approximately 2.23 times. The effectiveness of 65%-BEES on electricity use is not significant when compared with 50%-BEES, thus, we do not test the sensitivity of this comparison group using Rosenbaum bounds. We admit that selection on observables studies may still be affected by bias due to unobserved confounders, however, our standardized bias calculations suggest that based on observable characteristics, our sample satisfies conditional independence and unconfoundedness. And the unobservable confounder could have sufficient impact (2.25 times and 2.23 times, respectively) on electricity consumption to change our inference. Therefore, we
18℃ and turn off the heating system before sleeping.
Lifestyle 5 means that people use heating when they stay in one room with the indoor temperature being kept at above 12℃ and turn off the heating system before sleeping.
35
believe that our estimates are robust.
One possible source of hidden bias could be the influence of the compliance rate of the BEES at the design stage. A previous study(Guo et al., 2016) has pointed out the compliance rates could play an indirect role in influencing actual performance of the BEES, because at the onset of implementation of the BEES, the compliance ratesof the BEES were relatively low in the absence of a BEES’ supervision and inspection system, although this phenomenon has not been tested empirically.
In our research, all the samples of buildings with BEES have passed a design and construction review. Therefore, we do not include the compliance rate in the set of matching covariates and find no appreciable change in the inference for our estimates. Understanding the influence of building quality, particularly in an empirical setting with some sort of exogenous variation, would be of considerable interest for future research.
Table 6 Rosenbaum bounds analysis for hidden bias
Γ sig+ sig- CI+ CI-
65%-BEES 2.25 0.000 0.051 -0.746 0.000
50%-BEES 2.23 0.000 0.051 -0.778 0.001
Note: sig+ refers to upper bound significance level ,sig- refers to lower bound significance level, CI+ refers to upper bound confidence interval (alpha= .9),CI- refers to lower bound confidence interval alpha = .9)
8. Conclusions and policy implications
This study is an empirical post-analysis of the effect of building energy efficiency standards (BEES)—the 65%-BEES (high-level)- and 50%-BEES (low-level)—at the household level in Chongqing using actual electricity consumption data based on counterfactual theory. First, we find that the effects of the 65%-BEES and
36
the 50%-BEES on average cooling and heating electricity savings (kWh/m2/a) are 41% and 38%, respectively, compared to IBs. This indicates that the BEES have a definite and positive impact on reducing energy consumption at the operation stage, although there is a big discrepancy between calculated energy savings and actual energy savings. Second, the power-effect of 65%-BEES compared to 50%-BEES is not significant due to the low demand of heating energy use under the “part-time and part-place” lifestyle. In view of the results and our deep discussion, we propose several policy suggestions.
8.1 Incorporate outcome-based pathways into current BEES frameworks
First, this study provides a foundation for the future formation of outcome-based compliance pathways for achieving the actual energy performance of the BEES in China. Chinese government has implemented a standard for the energy consumption of buildings, which is based on actual energy use in buildings, titled the “Standard for Energy Consumption of Buildings, GB/T51161-2016” (Yan et al.,
2017). However, it has not yet formed a mechanism for evaluating the effectiveness of BEES in reducing actual operation energy demand. Some experts have agreed that the BEES, which focus only on building design, are “hitting a wall” in terms of the energy performance they can promise (Lang, 2004). Under traditional BEES, when the building is completed and occupied, there is no way to know whether the decisions for a specific design, material, or orientation resulted in actual energy savings (Colker, 2014). Thus, an outcome-based compliance path can be incorporated into current BEES frameworks. This compliance path can not only help focus on addressing supervision and inspection of systems of building design at the construction stage but also facilitate greater energy savings at the operation stage of energy-efficient buildings. For example, Seattle, in the U.S., has enacted
outcome-37
based energy codes for existing buildings, imposing financial penalties if projects do not meet targets proposed at the operation stage (Denniston et al., 2010).
8.2 Reinforce the implementation of the BEES
Second, associated with the current BEES implementation situation in China, it is also important to strengthen administrative management into all stages of implementation of the BEES. (1) Currently, although some inspections are conducted during the construction stage in China, they are only inspections for a random sample of buildings and are often only carried out once during a building’s life cycle (Guo et al., 2016). The compliance rates is a critical parameter for calculating macro building energy savings (MOHURD, 2017, 2012, 2011, 2010, 2008). Thus, municipalities should assess more comprehensive compliance trends for each building type at each stage (design, construction, prior to occupancy, and when the building is occupied) at local levels. A successful system for supervising BEES is needed to reach a better level of building envelope construction quality. The most important improvement should be supervising the entire construction process and establishing reporting by either government or independent third parties, rather than developer self-reporting (Feng et al., 2014). (2) Develop training materials and provide training. Building construction quality is a factor influencing both calculated and actual energy savings of standards. This is because, in China, the development of BEES and codes are guided by the government and not promoted by the market. Thus, the building sector typically suffers from a lack of knowledge about energy efficiency improvements. The BEES are not easily understood by stakeholders, which result in poor quality of implementation of standards during the construction phase. Therefore, the government should develop a long-term training strategy to ensure that all of those involved understand how BEES are implemented. Setting up a professional society
38
(e.g., ASHRAE) or equivalent organisation enables stakeholders to discuss code upgrades and conduct more regular research (Feng et al., 2014). (3) Establish a better system for testing and certifying building materials/products. If all building materials or components were tested and labelled in an understandable way, policymakers could easily determine which materials match design targets. If tested and labelled products are used, developer and constructors alike will find it easier to abide by energy efficiency requirements at the construction stage. Better and more comprehensive systems would consist of test protocols for specific building materials, test laboratories that are recognized by an independent certification party , and labels that provide users with specific performance characteristics (Evans et al., 2017).
8.3 Do some work to revise and optimise superior BEES
Third, do some work to revise and optimise superior BEES. Currently, most households in Chongqing do not adopt heating in winter, reflecting “part-time and part-space” use and application of heating. The actual heating consumption in Chongqing is relatively low. This may imply that calculated design performance savings from heating systems are overstated. Therefore, occupant life patterns should be considered in the BEES. (1) First, the BEES in this region should not simply copy the SC and C regions and should improve the insulation levels by as much as possible. When designing BEES, more consideration should be given to window-opening behaviour. (2) In fact, as electricity consumption in Chongqing is greater for cooling than for heating, the effect of reducing the cooling consumption should be taken more seriously than that of reducing the heating consumption when selecting energy-savings measures in standards. (3) If possible, the building envelope could have alternative functions. For example, the building envelope should be cooled in the summer for the purpose of shading, while having good thermal insulation
39
performance in winter. (4) The BEES should consider more energy-saving measures that are not limited to the insulation level of the building envelope and improvement of cooling/heating equipment. Improvement of the energy efficiency of lighting systems and the hot water supply system, in addition to renewable energy use, should be included in the BEES. (5) A benchmark case should be included in detail in the corresponding BEES to provide a reference for evaluation. Some input parameters for future simulation of building energy use in the BEES in Chongqing are suggested based on survey data; see Table 7.
Table 7 Proposed parameters for future simulation building energy use in the BEES Building operation schedule ACs and heating system features Conditi oned space Conditioned period Ventila tion rate Temperature setting EER Coolin g Heatin g
Summer Winter ACs/Heating Propo sed Each room uses a separat e unit ACs for cooling or heating 8hours/ day; 75days 2 hours/ day; 35days 1.0tim es/ hour 26℃ 18℃ 3.5/3.1
8.4 Developing a data-driven building policy evaluation mechanism
Third, in summary, this study provides a framework for empirical post estimates of specific energy efficiency policies on energy consumption in the residential building sector. Currently, due to a lack of micro data on household energy consumption and other variable characteristics’ data related to energy consumption, there is little empirical evidence of the effectiveness of energy efficiency policies in reducing energy consumption in China. A continued lack of such data may lead to a gradual widening of the gap between theory and practice and the inability to achieve
40
strategic goals (Oreszczyn and Lowe, 2010). Considering that absence, evaluation can be used to improve compliance rates and revise standards. IEA countries that have collected sufficient energy and behavioural data to evaluate their BEES have a better understanding of the impacts of their policies. Therefore, for the future of China’s building conservation work, it is highly recommended that China builds up a national micro survey database of building energy use, similar to either the U.S. Residential Building Energy Consumption Survey Database, the U.S. DOE Building Energy Performance Database, the U.S. Building Energy Codes Program, South Korea’s Building Energy Integrated Database, or the UK National Energy Efficiency Data-Framework (Hamilton et al., 2017). Another option is to use randomly-selected samples from a big energy database from an energy enterprise and then develop household surveys according to these samples. Developing a data-driven building policy evaluation mechanism is critical in China. Energy consumption databases should be developed to support policies, such as building energy codes and standards’ development, and performance evaluation.
8.5 Limitations of this research
Although this study fills the gap in the literature by using real data to evaluate the impact of building energy efficiency standards in China, the limitations of this study are as follows.
First, it was unable to separate heating and cooling energy consumption from other end-uses in this study and approximation was adopted to subtract non-heating/cooling season load from non-heating/cooling season load. Future research should aim to collect data with higher accuracy possible by installing smart meters.
Second, this study simply identifies the short-run evidence on the BEES really reduce the energy consumption in HSCW zone in China due to data limitations. The
41
future work should aim to explore long-run evidence on whether residential BEES reduce energy consumption.
Acknowledgments
This research was supported by the Fundamental Research Funds for the Central Universities (No.2019CDSKXYJSG0047); the Social Science and Humanity on Young Fund of the Ministry of Education P.R. China (No. 15YJC630003); the Fundamental Research Funds for the Central Universities (No. 2017CDJSK03XK01) and China Scholarship Council (CSC) funds (NO:201706050086).
Appendix A. The reason for why the built year is not explicitly mentioned as a covariate.
In our studybuilt year is no longer considered separately. It can be deeply explained as the following three reasons. First, the BEES is highly related to built years(Guerra Santin, 2010) .This is because BEES were proposed in different years. Therefore, different type of BEES is already able to reflect the influence of the built year on energy use. Second, the built year influences energy use due to different EEL for appliances used by households in different time. The earlier buildings were built, the lower EEL for appliances were. Since this appliances characteristic have been considered in the model, the potential impact of the built year could be revealed in current study. Third, the thermal isulation performance of buildings is attenuated with time, and the greater the building age, the larger the attenuation of thermal performance. This is an important reason why the built year significantly influence energy consumption. As the design life of the self-insulated system of buildings in Chongqing is the same with that of buildings (50 years) and the thermal performance does not decrease considerably during the design year, thus the impact of thermal performance attenuation in the design life could be ignored. Fourth, the overlap
42
43 Appendix B
Data collection consisted of three stages (Fig.B.1). At the first stage, we got building characteristics’ information (including the type of standard used for building construction and the built year of buildings) from CMCURD. The distribution of the sample is based on the Energy Consumption Survey of Civil Buildings which is organised by the Ministry of Housing and Urban-Rural Development of the People’s Republic of China (MOHURD) and conducted by CMCURD. At the second stage, we conducted a household survey in the buildings provided by CMCURD in the first stage. To guarantee the survey quality, all investigators were required to attend a full-day training lecture to receive intensive training for the interviews, with instructions to record all the interviewees’ telephone so that they could be called back. All the interviewees received an umbrella as a gift after they finished the survey. Households were invited to participate in the survey if they met three criteria: First, a household had to provide the registration number for their smart electric meter or their electricity billing number, which would allow utilities to provide household monthly electricity consumption data. Second, a household had to have used electricity only for consumption purposes, rather than for production purposes. Third, the residents must have lived there for more than one year. The final stage involved getting household electricity consumption data from utilities according to households’ smart electric meters or their electricity billing number. Then, we matched these data with other characteristics using either the electric meters or electric billing numbers.
44
Data collection
Energy data Household survey
Monthly electricity consumption
Building characteristics
The recording review of BEES
Built year
Data from CMCURD
Data from utilities
Data from household survey Household characteristics
Occupant behavior
Appliance characteristics
Smart electric number/Billing number
Building characteristics Including: floor area, number of rooms, residence floors
45 Appendix C
See Appendix Tables C.1- Table C.5. Table C.1
Survey statistical analysis
Variable 65%-BEES 50%-BEES IBs
Obs. Mean (Std. Dev.)
Min Max Obs. Mean (Std. Dev.)
Min Max Obs. Mean (Std. Dev.) Min Max Electricity consumption Electricity use (kWh/household/a) 504 2249 (1131.22) 279 9125 338 2132 (1212.09) 245 8111 286 3018 (1685.87) 352 12942
Cooling and heating electricity use (kWh/household/a) 504 767 (552.55) 56 3650 338 710 (578.23) 49 3244 286 1123 (756.55) 70 5177 EUI (kWh/m2/a) 504 26.01 (12.72) 3.72 104.33 338 28.53 (14.67) 3.82 115.14 286 28.08 (14.41) 4.77 102.78