10
Improving Peer-to-Peer Performance
through Server-Side Scheduling
YI QIAO, FABI ´AN E. BUSTAMANTE, PETER A. DINDA, and STEFAN BIRRER Northwestern University
and DONG LU Ask Jeeves
We show how to significantly improve the mean response time seen by both uploaders and download-ers in peer-to-peer data-sharing systems. Our work is motivated by the observation that response times are largely determined by the performance of the peers serving the requested objects, that is, by the peers in their capacity as servers. With this in mind, we take a close look at thisserver side
of peers, characterizing its workload by collecting and examining an extensive set of traces. Using trace-driven simulation, we demonstrate the promise and potential problems with scheduling poli-cies based on shortest-remaining-processing-time (SRPT), the algorithm known to be optimal for minimizing mean response time. The key challenge to using SRPT in this context is determining request service times. In addressing this challenge, we introduce two new estimators that enable
predictiveSRPT scheduling policies that closely approach the performance of ideal SRPT. We eval-uate our approach through extensive single-server and system-level simulation coupled with real Internet deployment and experimentation.
Categories and Subject Descriptors: C.2.4 [Computer-Communication Networks]: Distributed Systems—Distributed applications; C.4 [Computer Systems Organization]: Performance of Sys-tems—Reliability, availability and serviceability; H.3.5 [Information Storage and Retrieval]: Online Information Services—Data sharing
General Terms: Algorithms, Design, Experimentation, Measurement, Performance
Additional Key Words and Phrases: Peer-to-peer, server-side, scheduling, size-based scheduling, SRPT
ACM Reference Format:
Qiao, Y., Bustamante, F. E., Dinda, P. A., Birrer, S., and Lu, D. 2008. Improving peer-to-peer per-formance through server-side scheduling. ACM Trans. Comput. Syst. 26, 4, Article 10 (December 2008), 30 pages. DOI=10.1145/1455258.1455260 http://doi.acm.org/10.1145/1455258.1455260
Authors’ addresses: Y. Qiao, F. E. Bustamante (corresponding author), P. A. Dinda, S. Birrer, Depart-ment of Electrical Enginnering and Computer Science, Northwestern University, 2145 Sheridan Road, Evanston, IL 60208; email: [email protected]; D. Lu, Ask Jeeves, Inc., Offline Development Group.
Permission to make digital or hard copies of part or all of this work for personal or classroom use is granted without fee provided that copies are not made or distributed for profit or direct commercial advantage and that copies show this notice on the first page or initial screen of a display along with the full citation. Copyrights for components of this work owned by others than ACM must be honored. Abstracting with credit is permitted. To copy otherwise, to republish, to post on servers, to redistribute to lists, or to use any component of this work in other works requires prior specific permission and/or a fee. Permissions may be requested from Publications Dept., ACM, Inc., 2 Penn Plaza, Suite 701, New York, NY 10121-0701 USA, fax+1 (212) 869-0481, or [email protected].
C
2008 ACM 0734-2071/2008/12-ART10 $5.00 DOI 10.1145/1455258.1455260 http://doi.acm.org/ 10.1145/1455258.1455260
1. INTRODUCTION
Today’s most popular application of the peer-to-peer (P2P) model is undoubt-edly data sharing; a recent study by CacheLogic shows that by the end of 2004, P2P data sharing represented 60% of all Internet traffic [CacheLogic 2005]. The cooperative service model behind these applications has been adopted by other large-scale systems, including distributed storage [Adya et al. 2002; Kubiatowicz et al. 2000; Dabek et al. 2001; Rowstron and Druschel 2001b; Bhagwan et al. 2004; Haeberlen et al. 2005], cooperative content distribution networks [Freedman and Mazi`eres 2004], and cooperative backup [Lillibridge et al. 2003; Cox and Noble 2003].
In P2P data-sharing systems, participating peers help each other search for objects, download them, and ensure/promote fair usage. A peer in search of a particular object issues a query that gets forwarded among the participat-ing peers. After determinparticipat-ing alternative sources based on its query replies, the requesting peer initiates the object download from a subset of the pos-sible providers, each party effectively adopting client and server roles. Ear-lier work [Saroiu et al. 2002; Gummadi et al. 2003a] has demonstrated that the response time experienced by users of this data-sharing service is domi-nated by the downloading process.Over 80% of all download requests in Kazaa [Sharman Networks Ltd. 2004] are rejected due to capacity saturation at server peers, while over 50% of all requests for large objects (>100MB) take more than one day and nearly 20% take over one week to complete.
In this article we show it is possible to decrease the mean response time seen by both downloaders and uploaders in a P2P data-sharing system by a factor of five to six using scheduling techniques that are readily implementable in many systems. We make the case for our scheduling techniques, solve the key problem in their implementation, and present detailed evaluations that show the significant improvement they yield, including measurements of an Internet deployment.
Our earlier work [Qiao et al. 2004] evaluated the prospectsfor using size-based scheduling to decrease the mean response time of the downloading process on the server side of individual peers. While the initial results were promising, it is not a foregone conclusion that size-based scheduling will work in practice, as its performance, in general, is strongly dependent on accurate estimates of service time [Lu et al. 2004]. This article completes the case for size-based scheduling of the server side of P2P systems, ending with a complete prescription for developers of these systems.
Based on extensive trace data collected in the Gnutella and eDon-key2000/Overnet networks, two of the most popular P2P file-sharing sys-tems [CacheLogic 2005], we characterize server-side workload and demonstrate both the promise and potential problems with scheduling policies based on shortest-remaining-processing-time (SRPT), a policy that is optimal for mini-mizing mean server response time. We propose newpredictiveSRPT scheduling policies based on job size predictors and evaluate them using trace-based simu-lations at both peer and system levels, as well as measuring their performance in a real Internet-wide P2P deployment. SRPT combined with even a naive
estimator significantly increases performance compared to current scheduling approaches, and our best estimator improves on the naive estimator by a factor of two to three. Our results show that it is practical to approach the response times of ideal SRPT scheduling with very low overhead. While our work is in the context of two popular data-sharing systems, our findings can be easily applied to many other P2P data-sharing and storage systems.
The remainder of this article is structured as follows. After introducing the context of our work in Section 2, Sections 3 and 4 describe our trace collection methodology and present a characterization of different aspects of the server workload. We introduce SRPT scheduling into the server side of P2P systems in Section 5 and propose alternative ways to predict the job size and service time of a P2P request in Section 6. Section 7 presents experimental results of different scheduling policies for P2P servers. We present our prescription for developers in Section 8.
2. BACKGROUND AND RELATED WORK
Data-sharing P2P systems can be seen as consisting of four main components: membership management, trust and reputation, object location, and object re-trieval. Over the last few years, a number of projects have explored a wide variety of issues mostly focusing on the first three components, looking at more scalable object location and routing protocols [Ratnasamy et al. 2001; Row-stron and Druschel 2001a; Stoica et al. 2001; Zhao et al. 2001], richer query languages [Huebsch et al. 2003; Tang and Dwarkadas 2004], improving avail-ability [Bhagwan et al. 2004; Haeberlen et al. 2005; Mickens and Noble 2006; Chun et al. 2006], ensuring/promoting fair resource sharing [Cox and Noble 2003; Walsh and Sirer 2006], and handling highly dynamic peer populations [Bustamante and Qiao 2003; Rhea et al. 2004]. The fourth component, object retrieval, has gone largely ignored even though it determines much of the ev-eryday user’s experience [Gummadi et al. 2003b].
Acquiring an object in these systems is a two-step process, similar to find-ing an article in the World Wide Web: There is a query/reply phase in which the client peer finds alternative sources for the required object, followed by a retrieval phase where the object is requested from a subset of possible sources. To better understand the contribution of these two phases to the client expe-rience in terms of response time, we conducted a small local experiment using eDonkey2000/Overnet [MetaMachine 2004], measuring the query and down-load time (for the first 10MB) of 100 shared objects randomly selected through passive monitoring. Our measurements revealed download times four to six orders of magnitude larger than the corresponding query times.
We focus in this article on the server-side scheduling problem, with the goal of designing efficient scheduling policies that, while fair, result in a much lower average response time for requesting peers. Perhaps the earliest work look-ing at improvlook-ing download time is that by Bernstein et al. [2003] on adap-tive server peer selection based on server attributes and partial downloads. The authors propose using machine learning techniques for clients to adap-tively select among alternative servers in order to reduce their download times.
While smarter server selection at the client side may result in faster downloads, many of the available peers will probably be highly popular ones1that are over-loaded, due to both low (constrained) resource availability and a large number of queued download requests. Thus, a better understanding and scheduling of these requests at the server peers will help further improve the download times experienced by clients.
The most commonly used scheduling polices in P2P systems are based on pro-cessor sharing (PS)andfirst-come-first-serve (FCFS). PS is commonly employed for CPU scheduling and in the current Apache Web server, while FCFS is used by common Gnutella implementations [mut 2004]. Some P2P systems, such as eDonkey2000/Overnet [MetaMachine 2004], additionally consider reputation as part of their scheduling policy to create incentives for content sharing.
The shortest-remaining-processing-time (SRPT) policy, although studied since the 1960’s [Schrage and Miller 1966], has recently caught the attention of the Web server community. For a general queuing system (G/G/1) Schrage [1968] proved that SRPT is optimal in the sense that it yields (compared to any other conceivable strategy) the smallest mean value of occupancy, as well as minimum waiting and delay time. Perera [1993] and Bansal and Harchol-Balter [2001] evaluated SRPT in terms of fairness. Perera [1993] studied the variance of delay time in M/G/1/SRPT queuing systems and concluded that the variance is lower than for FIFO and LIFO [Perera 1993], while in Bansal and Harchol-Balter [2001] the authors proved that SRPT also outperforms PS in terms of mean slowdown, their fairness metric.
SRPT has been successfully applied to a number of application areas. Bux [1983], for example, introduced SRPT into packet networks, using message size as an estimate of service time. Bansal and Harchol-Balter [2001] proposed the use of SRPT in Web servers and argued for file size as an estimator for service time Harchol-Balter et al. [2003, 1998]. The authors also studied how SRPT can help a Web server to improve performance under both persistent and transient overload [Schroeder and Harchol-Balter 2006].
Despite superficial similarities to scheduling for Web servers [Almeida et al. 1998; Crovella et al. 1999; Bansal and Harchol-Balter 2001; Lu et al. 2005], a closer look at the characteristics of P2P request traces indicates very significant differences, as next described.
— Thefetch-at-most-oncebehavior of P2P clients makes the distribution of ob-ject popularity decidedlynotconform to Zipf or other power laws [Gummadi et al. 2003a].
— Requests to P2P servers are often not for the whole object, but instead for only a small chunk (with the remaining parts being downloaded from other servers). What is more, as our traces show, the amount of data actually served is often just a fraction of the requested size.
— While Web servers can reasonably assume full control over resources, P2P servers are commonly configured with quite conservative upper bounds for resource consumption to control their impact on their users’ other tasks. 1Saroiu et al. [2002] report that about 10% of the peers within the University of Washington serve
— Although Web servers often experience high load (defined as the mean job arrival rate over mean service rate [Schrage and Miller 1966]) of close to 1, they are typically not overloaded. Popular P2P servers, on the other hand, normally operate overloaded [Saroiu et al. 2002] due in part to the aforemen-tioned low resource availability and, on average, large job sizes.
Thus, the lessons learned in Web server scheduling cannot be mechanically applied to peer-to-peer file sharing.
This article shows how to effectively apply SRPT scheduling on the server side of P2P data-sharing systems, both in theory and practice, and discusses why it would be done. What makes the application of SRPT in this context chal-lenging is the nontrivial task of estimating the service time of a request upon its arrival. We are, nonetheless, able to do so achieving performance near to what would be possible with perfect knowledge. The reported work significantly ex-tends our initial results [Qiao et al. 2004] in many respects: (i) We extend our analysis by incorporating traces collected from both Gnutella and eDonkey, two of the most dominant P2P file-sharing networks; (ii) we conduct detailed anal-ysis for predicting service time of each request, and introduce new predictive SRPT scheduling policies that are shown highly effective at reducing mean response time; (iii) we test the effectiveness of our predictive SRPT schedul-ing policies through trace-driven simulations, includschedul-ing both sschedul-ingle-server and system-level simulation; and (iv) we implement our predictive scheduling poli-cies in the server side of real eDonkey networks, and show the advantages of our approach through a live Internet experiment.
3. TRACE COLLECTION
For our study of server workload characterization and the subsequent analysis of alternative scheduling policies for P2P servers, we make use of a set of object request traces collected from two of the most popular P2P networks [CacheLogic 2005].
We collected traces using a set ofhoneypotsconnected to the eDonkey (i.e., eDonkey2000/Overnet) (∼2,900,000 online peers) and the Gnutella (∼500,000 online peers) networks during March 1st through 15th, 2004. Our honeypots are peers that make available large numbers of popular objects to the whole P2P system, thus ensuring a large number of download requests. During the trace collection process, each of our honeypots was instrumented to record, for every incoming download request, its arrival time, requested object name and size, served data-chunk size, transfer finish time, and other related information for later analysis. Arrival time and transfer time of each request are recorded using the UNIXgettimeofday (3C), giving us microsecond-level accuracy for timestamps. For our analysis purposes in this work, a granularity of millisec-onds suffices.
To ensure variety in our traces, several honeypots were instantiated in differ-ent nodes at differdiffer-ent locations in North America, Europe, and Asia. In addition, every honeypot was set to serve its own collection of popular objects and was configured with different limits for resource consumption, including outgoing bandwidth and the number of threads serving requests. These resource limits
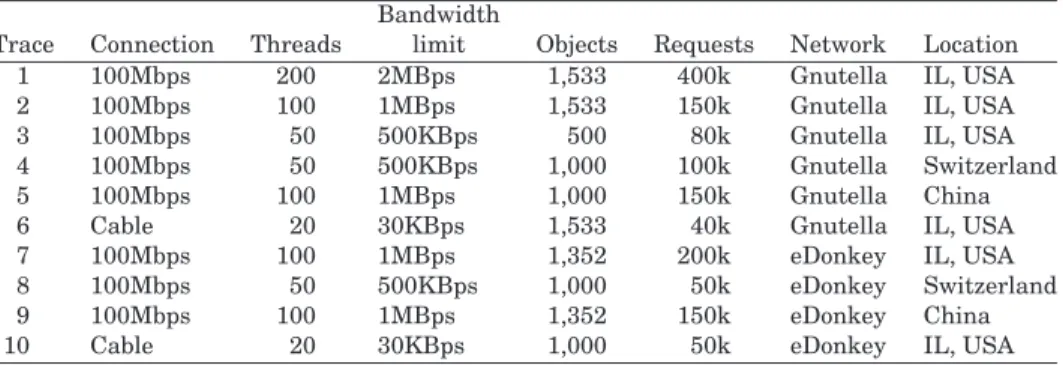
Table I. Key Parameters of Collected Traces from P2P Servers Bandwidth
Trace Connection Threads limit Objects Requests Network Location
1 100Mbps 200 2MBps 1,533 400k Gnutella IL, USA
2 100Mbps 100 1MBps 1,533 150k Gnutella IL, USA
3 100Mbps 50 500KBps 500 80k Gnutella IL, USA
4 100Mbps 50 500KBps 1,000 100k Gnutella Switzerland
5 100Mbps 100 1MBps 1,000 150k Gnutella China
6 Cable 20 30KBps 1,533 40k Gnutella IL, USA
7 100Mbps 100 1MBps 1,352 200k eDonkey IL, USA
8 100Mbps 50 500KBps 1,000 50k eDonkey Switzerland
9 100Mbps 100 1MBps 1,352 150k eDonkey China
10 Cable 20 30KBps 1,000 50k eDonkey IL, USA
Threadsis the number of available server threads.
were set considerably higher than their default settings to capture the behavior of busy server peers. In order to capture potential differences due to bandwidth diversity, some of these honeypots were placed behind cable modems, a common connection for P2P servers [Saroiu et al. 2002]. It is worth noticing that, by be-ing collected from “common” peers in the network, this set of traces captures the inherent dynamism of the P2P client/server interaction, including clients’ early disconnects and partial downloads. Table I summarizes some key parameters of the collected traces.
4. WORKLOAD CHARACTERIZATION
We begin our study of scheduling policies by characterizing the different aspects of the server workload. We do this based on the analysis of traces collected from both the Gnutella and eDonkey networks. We look to determine the distribu-tion of job (or request) interarrival times, sizes (number of bytes requested or served), and service time, and to test the independence of job arrivals. We de-fine job service timeas the wall-clock time for a server to finish sending the data to a client over the Internet, given the bounded outgoing bandwidth for the job. In other words, this is the time to complete the job in isolation from other jobs. Closely related, theresponse time of a job is the sum of its service time and its total waiting time in the queue. We also look to identify the likely performance bottleneck and to understand the implications of our findings on P2P server-side scheduling.
For conciseness, we present our results using two representative traces, one from Gnutella and one from eDonkey, both collected from IL, U.S.A., behind the 100Mbps Ethernet connection. All other traces show similar results. Rejected jobs due to server capacity saturation are not included in our analysis.
4.1 Job Arrivals Form a Poisson Process
Previous research [Paxson and Floyd 1995; Deng 1996] has shown that Pois-son processes are valid for modeling the arrival of user-initiated TCP sessions such as TELNET and FTP connections. HTTP arrivals, on the other hand, have been shown not Poisson, but better modeled by a heavy-tailed Weibull distribution [Deng 1996]. This is because HTTP document transmissions are
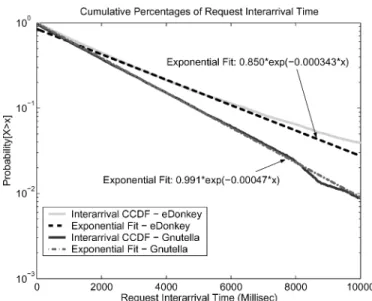
Fig. 1. CCDF of interarrival time of requests to P2P server. They-axis is in log scale.
not entirely initiated by the user; some are automatically generated by the browser (requesting embedded files), resulting in a more bursty process.
We characterized job interarrival times for P2P servers based on our col-lected traces. Figure 1 gives the complementary cumulative distribution func-tion (CCDF) of job interarrival time for the two representative traces, one from Gnutella and one from eDonkey. Notice that the vertical axis is logarithmic; the straight lines of the CCDF curves for both traces strongly indicate that the arrival process at a P2P server can be modeled by an exponential. A least-squares curve-fit using an exponential function, shown by the two dashed lines in Figure 1, yields a coefficient of determinationR2=0.9943 andR2=0.9940,
for the Gnutella and the eDonkey traces respectively, strongly suggesting ex-ponential interarrival times.
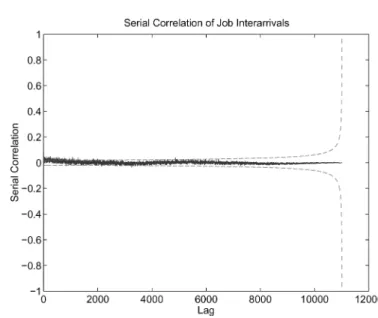
We also tested the independence of job arrivals by computing the se-rial correlation of their interarrival times. We found that the correlation between any two separate interarrival times is effectively nil for all our traces; Figure 2 shows this for the representative eDonkey trace. Exponen-tially distributed, independent interarrival times are the definition of a Poisson process.
4.2 Job Sizes Are Multimodal And Heavy Tailed
Job size is another important property for queuing models. For P2P schedul-ing, there are three different possible definitions for job size:full object size, requested data-chunk size, and served data-chunk size. While the full object size is usually large (from a few hundred to several hundred MBs), in most P2P systems peers download only a small fraction of the object from any given server peer—a technique sometimes referred to asmultisource file transmission
Fig. 2. Serial correlation of interarrival time of requests.
Fig. 3. CCDFs of served data-chunk size, requested data-chunk size, and full object size. Both the
x- andy-axis are in log scale.
protocol[eDonkey 2004]. More importantly, there is usually also a significant difference between the requested and the actual served data-chunk size. We discuss some possible explanations for this difference in Section 5.
The CCDFs of the three job sizes for representative traces from both P2P networks are depicted in log-log scale in Figure 3. Served data-chunk sizes in eDonkey are generally larger than those in Gnutella, and have a thicker tail of large jobs. As can be observed from the graph, the three sizes often differ by several orders of magnitude. These apparent differences between the three job sizes exist in all our collected traces from both Gnutella and eDonkey. For the
remainder of this article, we focus mainly on the requested and served data-chunk sizes, as these two are the main determinants of P2P server performance. Although the requested size and served size in the representative Gnutella trace can be roughly approximated by Pareto distribution, none of these sizes can be easily modeled with simple distributions. In all our traces, these three job sizes demonstrate multimodal distributions. On the other hand, all of these distributions are heavy tailed, suggesting that jobs with large sizes will play a significant role in the workload of server peers. We also studied the serial correlation of job sizes, and found no correlation between sizes of consecutive versus more widely spaced jobs.
4.3 Job Service Times Are Pareto
Job service time is another aspect of the workload that helps us understand the potential benefits of different scheduling policies. Due to the different download speeds of clients, job service time is not directly proportional to any of the three job sizes we have seen, but can be well approximated by a Pareto distribution, one of the simplest forms of heavy-tailed distributions.
4.4 Server Resource Utilization Is Low
Despite their apparent similarities with Web servers, the resource utilization of P2P servers is quite different. Web servers typically try to serve requests as quickly as possible, and their bottleneck resource is commonly either the lim-ited bandwidth of the outgoing link [Bansal and Harchol-Balter 2001] or the CPU. On the other hand, P2P servers are normally run in the background of common users’ machines and are thus very conservative in their use of resources.
To understand resource utilization on P2P servers, we instrumented our honeypots to record several metrics, such as CPU and memory usage, every three seconds. Our traces show that even when our servers2support 200
con-current downloads and use up to 2MBytes/second of bandwidth, CPU utiliza-tion remains in the 1.2 to 20% range, and memory usage is consistently below 20MBytes. Neither CPU nor memory turn out to be the performance bottleneck for P2P servers, not even for the most popular of our honeypots.
4.5 Effective Load Is Very High
The low physical resource utilization observed in P2P servers can be largely attributed to user-defined constraints on physical resource consumption, in particular, limits on bandwidth usage and the number of concurrent server threads. A P2P server is an “effective machine” defined by these limits and can be easily saturated if it is popular, using up all server threads or available band-width and thus queuing up or rejecting incoming requests. These user-defined constraints are, thus, what make the server side of P2P systems the system’s bottleneck [Saroiu et al. 2002; Gummadi et al. 2003a].
2Each of our servers is a dual 1 GHz Pentium III machine with 1GB RAM and two 30GB IDE disks
Although all our honeypots were configured with much higher resource limits than what is typical, all of them became saturated (overloaded) throughout the trace collection period. Assuming the same job service time distribution for rejected jobs as the served ones, the effective server loads for all our honeypots exceeded 1, and some went as high as 3. This clearly indicates that a popular P2P server will typically operate and handle job requests under overloaded conditions.
In all our traces, service times are consistently much smaller than response times. In our eDonkey traces, for example, over 90% of all jobs have service times<60 seconds, while>80% of response times are≥3000 seconds. Clearly, response time is dominated by queuing delay, strongly suggesting the need for more effective scheduling algorithms to manage the queue and lower response times.
5. SCHEDULING A P2P SERVER
Having characterized different aspects of the collected P2P server-side work-load, we now turn our attention to the scheduling of requests at P2P servers. Our scheduling problem can be formulated as follows:Given the total number of concurrent jobs that a server can support (based on a user-defined limit on the number of concurrent server threads), how should we schedule the incoming jobs so that their mean response time is minimized?This section discusses the chal-lenges in adopting SRPT-based policies to address this problem and illustrates the promise of such an approach.
5.1 Bringing SRPT to P2P Systems
Ideal preemptive SRPT is a simple policy [Schrage and Miller 1966]. Each job is associated with its remaining amount of processing time. The job queue is ordered, from shortest to longest, based on these times. The server operates on the first job in the queue until it either completes or a new job arrives with a shorter remaining processing time. In the P2P system, working on the job means dispatching it to an available server thread.
While conceptually simple, the introduction of SRPT-based scheduling poli-cies on the server side of P2P systems raises several challenges. Most impor-tantly, ideal SRPT requires a priori knowledge of requests’ service times, or at least their ranks, something not readily available in this context. Although there has been some success in estimating service time in other contexts, such as network packet forwarding [Bux 1983] and Web servers [Bansal and Harchol-Balter 2001; Lu et al. 2005], it is by no means obvious that such predictions are possible in P2P servers.
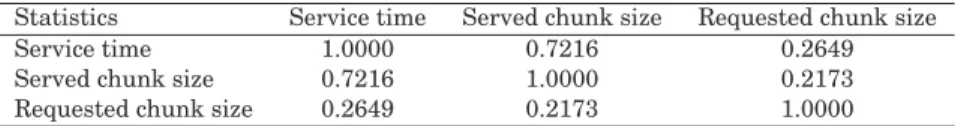
Since a typical P2P download request is for a specific chunk of the whole object (Section 4), we could think of using the requested chunk size as a rough estimate of the service time and thus as the metric for SRPT scheduling. Unfor-tunately, there are only weak correlations between requested chunk size and service time (or served chunk size), as shown in Table II. Indeed, this weak cor-relation is present in all of our collected traces from both systems, leading us to believe this is likely an inherent characteristic of the data-sharing networks,
Table II. Correlation Coefficients between Service Time, Served Chunk Size and Requested Chunk Size for a Representative eDonkey Trace
Statistics Service time Served chunk size Requested chunk size
Service time 1.0000 0.7216 0.2649
Served chunk size 0.7216 1.0000 0.2173
Requested chunk size 0.2649 0.2173 1.0000
rather than an effect introduced by the specific behavior of any particular client. Several characteristics of the P2P environment could help to explain this weak correlation, given as follows.
— A client can abort or exit at any time during the data transmission.
— A P2P client can switch servers for a given data-chunk before the request is completed. We speculate that the more popular the object, the more likely this switching.
— Although each download process is supposed to share equal outgoing band-width from the P2P server, bandband-width bottlenecks along the path to the destination can make the individual download speed vary.
Thus, requested chunk size is not a good estimator of service time, and a weak estimator can dramatically compromise the performance of SRPT [Lu et al. 2004]. Table II also shows a much stronger correlation between served chunk size and service time, indicating that, if available, served chunk size could be a better estimator for service time.
5.2 Initial Results
We explored SRPT performance when relying on requested chunk size (RS), served chunk size (SS), and service time (ideal SRPT) as the scheduling metric. We denote the different scheduling policies SRPT-RS, SRPT-SS, and SRPT, re-spectively. Note that while SRPT-RS can be directly implemented with current tools, SPRT-SS and ideal SRPT are not implementable.
To evaluate the performance of the different policies we built a general-purpose queuing simulator (4500 lines of C++ code). All simulations were driven by the object request traces collected from our honeypots. Each of our traces was played back, modulating load by varying mean interarrival time. In most simulations, we set queue capacity to 500 and the number of threads to 10 at the server. In other words, the server supported up to 10 concurrent downloads, and had a maximum queue length of 500, a typical configuration for peers in various P2P systems. PS (processor sharing) used a time slice of 0.01 seconds.
For the remainder of this section and in Section 6, unless otherwise specified, we present our results using one representative trace (from eDonkey, collected at Northwestern University, U.S.A.). We repeated all the experiments for all our traces from both Gnutella and eDonkey networks, and they all show similar trends.
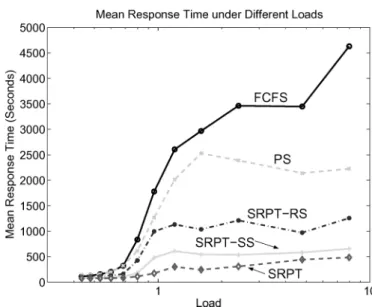
Figure 4 gives the mean response time of the five scheduling policies handling requests for the representative eDonkey trace, with the system load varying
Fig. 4. Mean response time for different scheduling policies under varying load. Thex-axis is in log scale.
between 0.4 and 8. Notice the log scale in the x-axis, used to provide a more readable plot. The advantages of the three SRPT-based policies over PS and FCFS are clear, especially when the load is close to or above 1.3 When the
load is 1.6, for instance, mean response time is 2967.78 seconds under FCFS and 2530.14 seconds under PS. For SRPT-RS, SRPT-SS, and SRPT, however, the number drops by 60 to 65% (1036.49 seconds), 78 to 82% (545.39 seconds) and 90 to 92% (244.70 seconds), respectively. This confirms our expectations of SRPT performance; even with only weak correlation between requested chunk size and actual service time, SRPT-RS achieves considerable performance gains over both PS and FCFS. The relative performance of the five scheduling policies remains consistent for all other collected traces.
Despite the benefits of SRPT-RS over FCFS and PS, there remain signifi-cant gaps between the mean response time of RS and those of SRPT-SS and ideal SRPT. As would be expected, the stronger correlation between served chunk size and service time naturally yields significantly better per-formance for SRPT-SS (although not quite matching what is achievable with perfect information).
All these scheduling policies require little or no state-keeping overhead for the scheduler. FCFS and PS require no storage of job state, while SRPT-RS, SRPT-SS, or SRPT only keeps one state variable per job, recording the remain-ing requested chunk size, remainremain-ing served chunk size, or remainremain-ing service time, respectively.
3In this article we are mostly interested in the case where server load is larger than 1, which
is normal for a popular P2P server [Saroiu et al. 2002]. As can be seen in Figure 4, SRPT-based scheduling policies also outperform FCFS and PS when the load is smaller than 1, as long as there are jobs waiting in the queue.
Fig. 5. Prediction module and its interaction with the scheduler.
6. APPROACHING IDEAL SRPT
The previous section has shown the clear advantages of SRPT-based scheduling over commonly used policies such as FCFS and PS. Of the three SRPT-based policies introduced, only SRPT-RS (relying on requested chunk size) is applica-ble, given the information available before actually serving the request. Ideal SRPT requires the request service time, while SRPT-SS assumes foreknowledge of the actual served chunk size.
Although SRPT-RS promises considerable improvements over FCFS and PS, there is plenty of room for improvement if it were possible to effectively predict the parameters upon which SRPT-SS and ideal SRPT rely. In this section, we explore and evaluate alternative predictors.
6.1 Predictability Analysis
The prediction module of any scheduler can be seen as a “black box” which, given certain characteristics of a request stream, outputs a set of predicted values used as scheduling parameters. In the context of a P2P server scheduler, the relevant attributes (input values) for a given request may include object size and requested chunk size, while predicted values (scheduling parameters), could include served chunk size or the request service time. Figure 5 shows the prediction module and its place in the architecture of the whole system.
The effectiveness of a prediction scheme can be estimated by the ratio of variance of the prediction error,e, to the variance of response signal,y:σ2
e/σ2y.
Thispredictability ratiointuitively shows how much the predictor decreases the “surprise” of the response (its variance). The smaller the ratio, the better the predictability, with a ratio near 1 implying no improvement.
We begin by applying one of the most commonly used prediction techniques, thegeneral linear model (GLM)[Timm 2002] to all requests entering the P2P
server. Although the discussion is focused on predicting served chunk size, our study of the prediction of service time follows a similar line.
6.1.1 Global Incremental GLM. The idea of our approach is to derive a linear model for predicting served chunk size as a function of the request’s object size and the requested chunk size. To this end we employ a GLM of the form
y=Xb+a,
whereXis a three-column matrix with one row per request, and columns rep-resenting a request’s object size, the requested chunk size, and the constant 1. The column vector yconsists of the corresponding measured served chunk sizes. The coefficient vectorbis the heart of the model. GivenXandy, the GLM model-fitting process (we use MATLAB’s glmfit function) determinesbas well as the error vectora, such that the variance ofais minimized.
Givenb, we predict the served chunk size of a new request as ˆ
y =b0+b1x1+b2x2+E[a],
where x1andx2are the requested object and chunk sizes, andbi (i : 0..2), are
the coefficients in b. The GLM-fitting procedure assures that E[a] = 0; the error of the prediction ise= y−yˆ. Note that we evaluate the prediction errors (e), not the model-fit errors (a).
We first fit the GLM with an initial set of requests (30, in this case), and incrementally adjust it with each new request. For each new request, we first predict its served chunk size ˆy, and we then serve the request and determine its actual served chunk size y as well as the prediction errore. A new row is then added to theXandymatrices, and an updated model is generated by fitting the GLM with the new data. The process of fitting the GLM is relatively inexpensive and can be done in constant time by using either a subset of previous requests or employing the innovations algorithm [Brockwell and Davis 2002].
We have focused our description on directly predicting the served chunk size for an incoming request. This value could also be estimated based on a prediction of the ratio of served to requested chunk size (i.e., y =SS/RS). In fact, for all the prediction schemes investigated, this indirect method has been shown most effective.
We ran incremental GLMs over each individual trace in our collection. We found that the predictability ratio of this simple model ranges between 0.96 to 0.98 for the prediction of SS/RS, and is even higher when directly predicting served chunk size, implying that, while not totally ineffective, this prediction scheme provides only marginal benefits.
6.1.2 Per-IP Group Incremental GLM. To improve the predictability of our model we could take into account additional information about a request, such as the specific object being requested or the IP address of the requester. This sec-tion reports predictability improvements resulting from addisec-tionally consider-ing requesters’ IP addresses. We also experimented with object-based groupconsider-ing, but omit the details of that study as it did not appear to significantly contribute to the predictability of the model.
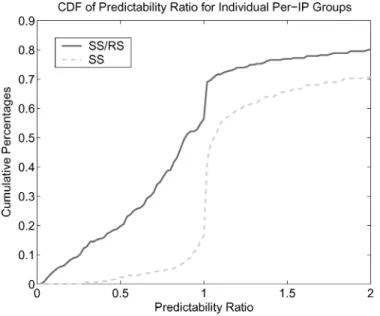
Fig. 6. CDF of predictability ratio for individual per-IP groups.
We grouped all requests for a P2P server by the IP addresses of the re-questers, and applied incremental GLM, as described before, separately over the requests from each individual IP address. The result is a collection of GLMs, one for each requester IP address found.
We thus have a matrix of independent variablesXi, a vector of the model
coefficientsbi, a response vectoryi, a fit error vectorai, and a test error vector eifor each IP addressIPi. We will often treat this collection of models as asingle
black box, in which case we produce aggregate sequences,y =y1,y2,. . .,yn, ande=e1,e2,. . .,en over all IP addresses to produce asinglecollective pre-diction error metricσ2
e/σy2. Given this black-box model, our study shows that
the predictability ratio for the different traces lies between 0.50 to 0.55, indi-cating that the new prediction scheme could typically explain 45% to 50% of the variance of the served chunk size for all incoming requests. This enhance-ment of the predictability ratio over the single increenhance-mental GLM model should translate into a significant improvement on the performance of our SRPT-based scheduling policies.
To better understand this prediction scheme, we also consider the predictabil-ity ratio for each IP address, namely,σ2
ei/σ
2
yi within each individual per-IP group IPi. Figure 6 shows the CDFs of these ratios for different IP addresses. We show
both the CDF for predicting served chunk size directly (SS), and the one for pre-dicting the SS/RS ratio. Clearly, SS/RS leads to considerably better predictions. More than 60% of the IP addresses in our traces show a predictability ratio above 0.80, implying that in most cases the prediction cannot explain the sig-nal variancewithinthe per-IP group especially well. In fact, and consistent with this high predictability ratio, a careful examination of the coefficient vectorsbi
valueb0and have little dependence on the characteristics of the request itself
(xi).
This also suggests that the low overall ratio (0.50 to 0.55) over all requests can be mostly explained by grouping of requests based on IP addresses, not due to the effectiveness of the individual incremental GLM predictor for each group. This led us to an interesting question and the next, simpler prediction scheme:Can we do well by predicting SS/RS for a request simply based on the served chunk sizes from earlier requests of the same IP?While the job sizes at the server may not be serially correlated in aggregate as shown in Section 4, it may be the case that job sizes from an individual client are.
6.1.3 Per-IP Time-Series Models. We apply windowed moving average (MA) and exponentially weighted moving average (EWMA) models to study this new prediction scheme. MA and EWMA are simple, specific forms of the general class of ARIMA models [Box et al. 1994] that require no model fitting. The most basic time-series predictor is the windowed moving average. We apply MA by first recording a history of previous SS/RS values for each individ-ual IP address. For a new request, we estimate its SS/RS ratio as the average over a window of the previouskvalues for the same IP address.
SS RS = yˆi = 1 k k j=1 yi−j
One disadvantage of the simple MA is that values older thankdo not contribute to the prediction.
A slightly more sophisticated time-series predictor is EWMA, the exponen-tially weighted moving average.
SS
RS = ˆyi=αˆyi−1+(1−α)yi−1
Here, all measurements are included in the prediction, but the contribution of a particular measurement decreases over time. Both the MA and EWMA models smooth the measurements.
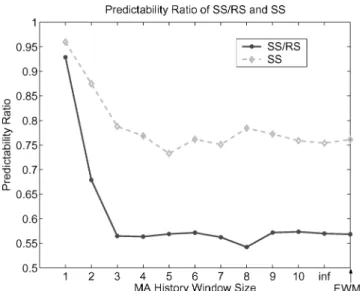
Figure 7 gives the predictability ratios of our simple MA and EWMA models for the SS/RS ratio, with different window sizes in the case of MA. An infinite window size in MA means we make use of all history information. For EWMA, plotted on the rightmost corner of the graph, we useα=0.5, to equally weight the previous predicted value and the last measured data point. As long as the window size exceeds 3 for MA, as well as in the case of EWMA, the predictability ratio consistently drops below 0.60, comparable to that of applying GLM to all per-IP groups. For comparison purposes, we also give the predictability ratio for SS, which consistently performs worse than SS/RS.
We use per-IP MA and EWMA prediction models in our system because they are inexpensive and have among the lowest predictability ratios. MA requires storing k previous values (or a single value for a pure mean model,k = ∞). EWMA requires storing only a single value.
It is important to note that our prediction scheme incurs very low overhead, which is mainly generated by the necessity to keep state, of any kind, for each
Fig. 7. Predictability ratio of SS/RS and SS using MA with different history window sizes and using EWMA.
IP address. The information kept per IP address is quite small (onedoubletype variable per IP) and need only be kept for the set of most frequently encoun-tered IP addresses, a very small fraction of the total IP address space. As an example, our largest honeypot trace contains 400,000 individual download re-quests from 43,193 different IP addresses; 345KB of storage would be sufficient for state-keeping of all these IP addresses. Moreover, the top 1000 most active IP addresses account for nearly half of all requests in the trace. In addition, this state could be significantly reduced through binning based on the high-order bits of the IP addresses, such as done in our domain-based scheduling work for Web servers [Lu et al. 2005]. Besides the per-IP information, a predictive SRPT scheduling policy also needs to store the predicted (remaining) service time, incurring a small additional overhead proportional to the queue depth.
Note that in order to use per-IP time-series models such as MA or EWMA, an IP address needs to have multiple requests associated with it. Fortunately, the majority of requests belong to this case: For all our traces, over 95% of all requests are from IPs that had sent two or more requests and over 80% of all requests are from IPs sending at least five requests. This guarantees the effectiveness of our per-IP MA or EWMA prediction.
We have discussed the prediction procedure for the served chunk size of a request; the prediction of a request’s download speed is very similar. Having both predictions, the service time of a request can be estimated simply as the ratio of predicted served chunk size over predicted download speed.
6.2 Performance Evaluation
We implemented MA and EWMA prediction modules for our P2P server scheduler; these modules estimate the served chunk size and the requester’s download speed. We parameterize SRPT using either the predicted served
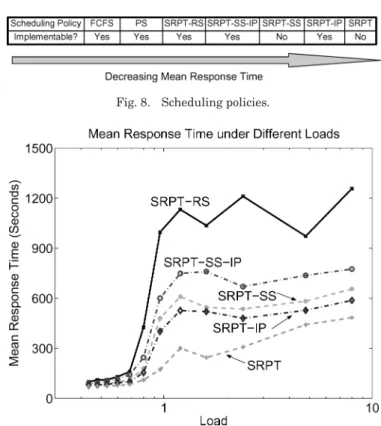
Fig. 8. Scheduling policies.
Fig. 9. Mean response time for different scheduling policies under varying load. Thex-axis is in log scale.
chunk size or the predicted service time as the scheduling metric, yielding two new implementable policies: SRPT-SS-IP and SRPT-IP, respectively.
More specifically, when we only predict the served chunk size to parameter-ize SRPT, we get the SRPT-SS-IP scheduling policy. If we go one step further by predicting download speed as well, we can have the prediction of service time, which equals the predicted served chunk size over the predicted down-load speed. The scheduling scheme parameterized by this predicted service time is named as SRPT-IP. The two policies are also collectively called pre-dictive SRPT scheduling policies. Figure 8 summarizes the scheduling policies evaluated; the mean response time of each policy decreases as we move from the leftmost FCFS to the rightmost SRPT.
We present results from the performance evaluation of these two new scheduling algorithms, comparing them with the straightforwardly imple-mented RS, and the two ideal but unimplementable variations, SRPT-SS and SRPT. We show the results obtained with the representative eDonkey trace using the single server simulator described in Section 5.2; the perfor-mance of the two predictive scheduling policies were obtained by using EWMA withα=0.5 as the prediction scheme.
6.2.1 Significantly Reduced Mean Response Time. Figure 9 shows the mean response time in the representative eDonkey trace as a function of system
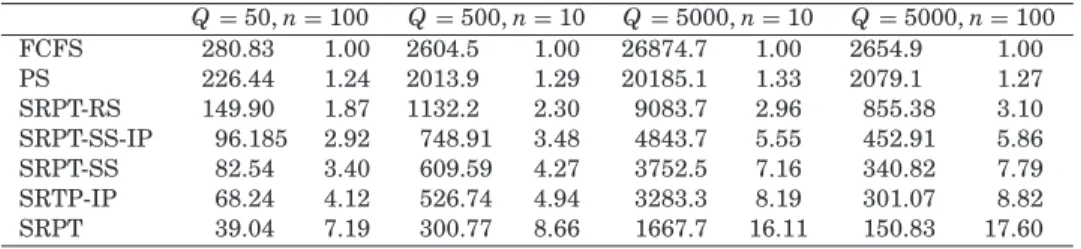
Table III. Performance (mean response time in seconds) of Different Scheduling Policies Q=50,n=100 Q=500,n=10 Q=5000,n=10 Q=5000,n=100 FCFS 280.83 1.00 2604.5 1.00 26874.7 1.00 2654.9 1.00 PS 226.44 1.24 2013.9 1.29 20185.1 1.33 2079.1 1.27 SRPT-RS 149.90 1.87 1132.2 2.30 9083.7 2.96 855.38 3.10 SRPT-SS-IP 96.185 2.92 748.91 3.48 4843.7 5.55 452.91 5.86 SRPT-SS 82.54 3.40 609.59 4.27 3752.5 7.16 340.82 7.79 SRTP-IP 68.24 4.12 526.74 4.94 3283.3 8.19 301.07 8.82 SRPT 39.04 7.19 300.77 8.66 1667.7 16.11 150.83 17.60
The performance is measured when policies are configured with different queue capacities and server thread numbers.
load for each of the scheduling policies, again with thex-axis in log scale. We omit the FCFS and PS curves from this figure, to better illustrate the relative performance of all five SRPT-based policies.
We observe significant performance increases over basic SRPT-RS when pre-dicting either the actual served chunk size or the service time. At almost all levels of system load, SRPT-SS-IP, the policy that tries to predict actual served chunk size, results in much lower response times than SRPT-RS. Moreover, SRPT-IP, which predicts the actual service time, further shortens the mean response time.
A closer look at SRPT-SS-IP and SRPT-SS reveals that their performances are quite similar. Recall that at the end of Section 5.2, the best we could do in an implementable system was SRPT-RS, and that there was a considerable performance distance between SRPT-RS and the unimplementable SRPT-SS. Now, by predicting the served chunk size (in implementable SRPT-SS-IP) we are 50% to 90% closer to SPRT-SS. Similarly, the implementable SRPT-IP, in which we predict the service time, yields results 70% to 90% closer to what ideal SRPT achieves than the previously best implementable case, SRPT-RS. In absolute terms, SRPT-IP results in a factor of two to three reduction in mean response time compared to naive SRPT-RS.
All the previously shown results were obtained with a queue capacity of 500 and 10 server threads. Table III illustrates how performance depends on these parameters if they are allowed to vary. The table is based on a subset of our sensitivity study in which system load is 1.20. Under each configura-tion and for each scheduling policy, we show both the mean response time and the relative performance improvement over FCFS. The significant advantage of SRPT-based policies over FCFS and PS holds true over the whole study, irrespective of queue capacity and number of server threads. The relative per-formance differences between SRPT-based policies, as well as the effectiveness of our predictive SRPT-SS-IP and SRPT-IP policies, remains similar over a wide range of parameter settings.
6.2.2 Fairness Is Preserved. One major concern with SRPT-based schedul-ing is that it is possible to design a workload in which SRPT leads to starvation of large jobs. Fortunately, previous research on M/G/1 queuing systems with comparable workloads has shown that the starvation does not occur [Perera 1993; Bansal and Harchol-Balter 2001]. Perera [1993] proves that the variance
Fig. 10. Mean slowdown for different scheduling policies for various job sizes. Jobs are divided into four groups based on job size percentile, with the top 10% largest jobs sitting in the rightmost group.
of delay time of ideal SRPT is smaller than those of FIFO and LIFO, while Bansal and Harchol-Balter [2001] show that the mean slowdown of ideal SRPT is actually smaller than those of FCFS and PS. In the context of P2P server scheduling, we consider fairness issues using three metrics: the mean slowdown of large jobs, the rejection rate of requests, and the distribution of rejected job size [Bansal and Harchol-Balter 2001].
We studied the mean slowdown of the various scheduling policies. Figure 10 gives the results with a system load of 2. Here we divide all jobs into four groups based on job size percentile, with the top 10% of largest jobs in the rightmost group shown in the figure. Clearly, for different sizes of jobs the SRPT family results in a much lower mean slowdown. Similar trends were observed for other system loads.
Our simulation study also shows that under various system loads, ideal SRPT actually results in the lowest rejection rate, and the other SRPT-based policies also reject fewer jobs than FCFS and PS. Further, our simulations re-veal that the distribution of rejected job size is almost identical for all evaluated scheduling policies.
In conclusion, the SRPT family of scheduling policies produces faster re-sponses to user requests without sacrificing fairness, yields lower mean slow-down even for large jobs than FCFS and PS, and accepts more jobs without changing the distribution of rejected ones. Our predictors allow SRPT to be implemented in P2P servers and to achieve near-optimal performance.
7. SYSTEM-LEVEL EVALUATION
Our performance evaluation thus far has been from the perspective of a single server. As already mentioned, it is common for a client to download nonover-lapping chunks for a given object simultaneously from multiple servers. Thus,
an important metric to consider is the response time for a client downloading theentireobject. We investigate this aspect using a simulation of a large-scale P2P data-sharing environment (Section 7.1).
It is also crucial to implement and study the effectiveness of our scheduling policies in a realistic P2P system such as the eDonkey network. As previously discussed in Section 3, all the traces that we have used for trace-driven simula-tion already capture the dynamism and interacsimula-tion between clients and servers. Nevertheless, it is still important to see how well our scheduling policies can do in the real implemented system, directly facing peers’ dynamism and ad-justment such as aborted downloads or parallel downloads of a single object, as well as in the face of network effects.4To achieve this, we compare the
dif-ferent (implementable) scheduling policies in a semicontrolled experiment, by building them into an open-source eDonkey peer [aMule 2004] and instantiat-ing multiple peers, actinstantiat-ing both as clients and servers, in the eDonkey network. Section 7.2 provides more details on the experimental design as well as the performance evaluation results.
7.1 Simulation Study
We developed a system-level simulator that can be parameterized with a choice and mix of scheduling policies. We then evaluated our different policies using a simulation of a 10,000- node P2P data-sharing system.
7.1.1 System-Level Simulator. One key challenge in building a system-level simulator is that of preserving as many inherent characteristics of the P2P server workload as possible. Examples of these characteristics include job interarrivals and job size distribution, as well as the various existing corre-lations, such as those between served chunk size and requested chunk size (CorrSize) and between the SS/RS ratio for different requests from thesameIP
(CorrIP).
A synthetic workload generator that could preserve all these characteris-tics would be extremely difficult to build. Furthermore, because we are in part evaluating predictors here, we must be extremely wary of synthetic workload models. It is far too easy to build a model that a predictor can trivially but inac-curately “lock onto,” or that omits important characteristics of the real workload that a predictor needs to see in order to work. Based on this consideration we built a trace-driven simulator that takes as input traces those such as we have collected.
As each trace we have consists only of download requests at asingle P2P server, we cannot directly apply them to system-level simulation. Thus, in-stead of direct playback, we construct system-level traces from them using the following rules.
— All download requests come into the system following Poisson arrivals. Re-quests are sampled from the trace to preserve CorrSize. Each request is
4Nonetheless, as we have observed in our traces, it is sometimes the user-set upper bound on
bandwidth usage by servers that determines the object transfer speed, rather than the network path between client and server.
dispatched to one of the servers in the simulation that shares the requested object. Obviously, the more objects a server has, the more requests, and thus the heavier load it will experience. This guarantees that each server has its own constant probability to get a request and, thus, that the job interarrival times at each single server still remain exponentially distributed.
— All requests in the trace are grouped based on the IP addresses of clients. Whenever a client makes a request, the requested chunk size, served chunk size, and service time of the request are all extracted from one particular request within its request group. This preservesCorrIP.
— When sending a request, each client dynamically adjusts the starting offset of the requested chunk to reflect the download progress of each object. The download of an object is considered complete when all of its chunks have been served.
Our system-level simulator consists of 8000 lines of C++, including various scheduling policies, communication functionality between peers, as well as trace sampling and request modulators. Internally, it uses our single server simulator, described previously in Section 5.2, for each individual node.
7.1.2 Simulated Environment. Using the simulator, we built a P2P data-sharing network that consists of 10,000 clients, 500 of which being honeypots serving popular content similar to those used in our trace collection. Each server is assigned a different capacity, serving from 5% to 50% of a total of 5000 shared objects in the system.
During the simulation, a client plays its constructed trace and sends down-load requests to servers, asking for shared objects. Each of our servers has 10 server threads, and a queue capacity of 500 jobs, the default configuration in one of the most common eDonkey clients [emu 2004]. Each client can execute up to 10 parallel downloads, either for different objects or for different chunks of the same object.
We run our simulation for a total of 20 runs, each consisting of one round per load level for every scheduling policy studied. During each round, we set thesystem loadat a particular level by adjusting the aggregate job arrival rate. Thus, one instance of our experiment corresponds to: (1) a run, (2) a load level, and (3) a scheduling policy. Each instance ran for a total of 432,000 seconds (5 days).
7.1.3 Results. The response time for downloading a complete object at a client is affected by the scheduling policies at the server side, the overall system load, and the size of the entire object. In the following we look at the benefits of the different scheduling policies as a function of system load and object size. All results shown here are averaged over 20 simulations driven by our repre-sentative eDonkey trace.
Figure 11 shows the mean response time of object downloads as a function of system load. At all levels of load, SRPT-based scheduling policies signifi-cantly outperform FCFS and PS. When the system load is 1.1, for instance, SRPT-SS and ideal SRPT reduce mean response time to 19% and 11% of what
Fig. 11. Mean response time of object downloads under varying system load.
is possible with either FCFS or PS. Even the most straightforward and triv-ially implementable SRPT-based scheduling policy, SRPT-RS, yields significant improvements (about 63% reduction in FCFS and PS mean response time). Our implementable predictive SRPT-IP policy yields an 84% reduction with respect to FCFS and PS, doubling the performance of SRPT-RS and coming closer to ideal SRPT than the unimplementable SRPT-SS. Under all system loads, SRPT-IP consistently outperforms SRPT-SS and is quite close to ideal SRPT.
Figure 12 depicts the mean response time of object downloads as a function of object size, with a system load of 1.5.5The figure clearly shows the
perfor-mance advantage of SRPT-based scheduling policies; we see once again that SRPT-IP performs close to ideal SRPT. Common across the scheduling policies is that, but for some local fluctuations, the mean response time of a download is linearly proportional to the size of the object. Recall that our SRPT-based policies schedule jobs based on either job service time, served chunk size, or requested chunk size, butnot the whole object size. This explains why these policies behave fairly across all object sizes without creating excessively long response times for large objects.
Our trace-based system-level simulation confirms the advantages of the SRPT family of scheduling policies. Not only do our SRPT-based policies greatly reduce the mean response time on the server side,but they also yield faster re-sponse times for downloads of entire objects from the client’s perspective.
5The mean response times for different object sizes in Figure 12 show similar trends as those
Fig. 12. Mean response time of object downloads for different object sizes, system load at 1.5.
Fig. 13. Clients and servers in live Internet evaluation. 7.2 Evaluation in a Real-World System
For our live Internet experiments, we implemented the different scheduling policies in aMule, an eMule variant [aMule 2004]. We modified or added 10,000 lines of C++ to build in the different scheduling policies as well as logging and reporting mechanisms. We then deployed our modified aMule code on a small set of machines scattered around the world, provided popular content, and observed the performance of the different policies on the incoming requests.
7.2.1 Experimental Design. Our evaluation considers both client and server perspectives. In each experiment, we use four servers and three clients (see Figure 13). Each server is scheduled by one of the four scheduling policies,
namely FCFS, SRPT-RS, predictive SRPT-IP, and ORIG, the original eDonkey scheduler. ORIG can be regarded as a variant of PS with coarser time slice and taking into account peers’reputations. Each of the servers provides the same set of objects and each client randomly chooses objects from the set for down-loading. The server object set includes 1500 objects that follow the eDonkey object size distribution of Figure 3.
The clients and servers were deployed as normal peers on the eDonkey net-work, with the servers serving requests fromanypeers in the network to en-sure that they are exposed to a real P2P system workload. Similarly, each of our clients records the four servers as potential download sources, but can also send download requests to other peers that serve the object. We instrumented our original eDonkey server, Server/ORIG, to assign three different levels of credit to our three clients: the lowest possible credit, a medium credit, and the highest possible one. Credits are ignored by the other three servers. To ensure a fair comparison, all our servers are located within the same LAN, exposed to the same network and hardware conditions. Clients are dealt with in the same way.
Each of our experiments lasted for about 3 days, during which each server served 20, 000 requests, with about 10%, or 2000, requests originated at our own clients. The distributions of job sizes and interarrival times from each of our clients are almost identical throughout the experiment.
In total, we conducted four experiments, each with a different LAN/host for our clients. The servers, on the other hand, were in the same LAN across all experiments. Each server has a queue capacity of 500 with 10 server threads. The locations of the LAN/hosts for our clients in the four experiments include the U.S.A. (IL), China (Beijing), and Europe (Switzerland).
7.2.2 Server-Side Evaluation: Significant Reduction in Mean Response Time. For the server-side evaluation, the results we present here are taken from one representative 3-day experiment, with the clients located in Beijing, China, and the servers in Illinois, U.S.A.
Figure 14 shows the mean response time of handling download requests at our four eDonkey servers. Notice that thex-axis in this graph represents time (from the start of the experiment). Each data point in the figure is the average response time for all requests in each past hour. Server/SRPT-RS and Server/SRPT-IP consistently outperform Server/FCFS and Server/ORIG. In particular, Server/SRPT-IP reduces the mean response time by a factor of five to six. The sequence of peaks shown in the graph correspond to a “time-of-day” effect in mean response times, as different volumes of download requests are experienced at different times over 24 hours [Saroiu et al. 2002].
To get a sense of the fairness of SRPT-based scheduling in practice, Figure 15 compares the mean slowdown (mean ratio of response time to service time) using SRPT-based and other policies as a function of job size, showing mean slowdown at different percentile ranges of encountered job sizes. Notice that our job queue has limited length. As expected, when job size grows (as we go from the left side to the right side in the figure), mean slowdown decreases for FCFS, remains mostly stable for ORIG, a PS variant, and increases for the
Fig. 14. Mean response time of handling download requests at server side at different times during the experiment.
Fig. 15. Mean slowdown of handling download requests at server side with different job sizes. Jobs are divided into four groups based on job size percentile, with the top 10% largest jobs sitting in the rightmost group.
SRPT-based policies. However, even for the largest 10% of jobs, SRPT-IP and SRPT-RS still result in a much lower mean slowdown than FCFS and ORIG, further justifying their practical value in real P2P applications.
7.2.3 Client-Side Evaluation: All Clients Benefit. Figure 16 shows, from the client’s perspective, the mean response time of download requests of our four servers. Each group of bars in the figure corresponds to one 3-day experiment in which our own clients were deployed at one of our four locations (one behind
Fig. 16. Client-side mean response time of download requests for all four 3-day experiments, with clients at different locations.
a cable modem and another with a 100Mbps Ethernet connection in Illinois, U.S.A. China, and Switzerland). The reported response times are for single chunks. For all servers except Server/ORIG, we show the mean response time for all download requests of all our three clients. For Server/ORIG, which takes clients’ credit into account, we show the mean response time separately for Client/High, Client/Med, and Client/Low.
It is clear from the graph that clients have a much lower response time for requests directed to Server/SRPT-RS and Server/SRPT-IP than those di-rected to Server/FCFS. Moreover, Client/Med and Client/Low, the most repre-sentative peers in the eDonkey network, also see much faster responses from the two SRPT servers than from the original eDonkey server, Server/ORIG. Even Client/High, which owns the highest possible credit at Server/ORIG, only achieves performance close to Server/SRPT-IP. Note that when using Server/ORIG, only about 2% of all clients will get highest credit, thus achiev-ing a relatively low mean response time. In contrast, the remainachiev-ing 98% of clients can only get performance similar to those of Client/Med or Client/Low, which are significantly worse then what can be achieved by Server/SRPT-IP and Server/SRPT-RS. These results show that our SRPT-based policies, partic-ularly SRPT-IP, can, in general, provide all users, regardless of credit, with a much faster and pleasanter downloading experience. Moreover, the advantages of SRPT-based scheduling policies are consistent for all four experiments with diverse geographical locations and connection types, indicating the robustness of our P2P server scheduler.
8. CONCLUSIONS AND PRESCRIPTION
We have demonstrated that scheduling the server side of a P2P data-sharing system using SRPT combined with accurate estimators of request service time can lead to significantly lower mean response times, both for the server and the client. Based on extensive trace data collected in the Gnutella and eDonkey2000/Overnet networks, we characterized server-side workload and demonstrated the promise and potential problems with scheduling policies
based on SRPT, a policy that is optimal for minimizing mean server response time. We proposed newpredictiveSRPT scheduling policies based on job size predictors and evaluated them using trace-based simulations at both peer and system levels, as well as measuring their performance in a real Internet-wide P2P deployment. SRPT combined with even a naive estimator was demon-strated to significantly increase performance compared to current scheduling approaches. We have also shown that it is practical to approach the response times of ideal SRPT scheduling with very low overhead.
Our scheduling techniques can be readily applied to existing systems by: — making the work queue of the system a priority queue, with the priority
being the expected service time of the request, smaller expected service times having higher priority;
— dispatching requests from the queue to the worker threads in priority order; — instrumenting the execution of a request to record the ratio of number of bytes served to the number of bytes requested (SSRS), as well as the download rate of the request (R);
— using a hash table to associate, with each observed IP address, two EWMA filters (the first filter operates on the ratios, giving a prediction of the ratio for the next request from the IP address, SS
RS, while the second operates on the
download rates and gives a prediction of the corresponding download rate,
R);
— estimating the service time of a new request asRS×SS RS×
1
R, whereRSis the
requested number of bytes; and
— potentially, using a clock algorithm to age entries in the hash table for garbage collection.
While our work is in the context of two operational data-sharing systems, our findings can be easily applied to many other P2P data-sharing and storage systems.
REFERENCES
ADYA, A., BOLOSKY, W. J., CASTRO, M., CERMAK, G., CHAIKEN, R., DOUCEUR, J. R., HOWELL, J., LORCH, J. R., THEIMER, M.,ANDWATTENHOFER, R. P. 2002. Farsite: Federated, available, and reliable storage for an incompletely trusted environment. InSymposium on Operating Systems Design and Implementation.
ALMEIDA, J., DABU, M., MANIKUTTY, A.,ANDCAO, P. 1998. Providing differentiated quality-of-service
in Web hosting services. InProceedings of the 1st Workshop on Internet Server Performance (WISP).
AMULE. 2004. aMule homepage. http://www.amule.org.
BANSAL, N.ANDHARCHOL-BALTER, M. 2001. Analysis of SRPT scheduling: Investigating
unfair-ness. In theJoint International Conference on Measurement and Modeling of Computer Systems (SIGMETRICS).
BERNSTEIN, D. S., FENG, Z., LEVINE, B. N.,ANDZILBERSTEIN, S. 2003. Adaptive peer selection. In Proceedings of the 2nd International Workshop on Peer-to-Peer Systems (IPTPS).
BHAGWAN, R., TATI, K., CHENG, Y.-C., SAVAGE, S.,ANDVOELKER, G. M. 2004. Totall recall: System
sup-port for automated availability management. InProceedings of the 1st Symposium on Networked Systems Design and Implementation (NSDI). 337–350.