We show in this paper that the architecture of the Internet dictates that current trade statistics significantly underestimate the magnitude and growth of cross-border data flows. As a result, the contributions of cross-border data flows to global growth and to small businesses are being significantly underestimated. This suggests that trade and tax policy should place more emphasis on maintaining cross-border data flows. Moreover, policies that discourage cross-border data flows, such as data localization and high tax rates on cross-border data, should be avoided if possible. Statistical agencies should explore adding data as a separate trade category, along with goods and services.
INTRODUCTION
The architecture of the Internet is designed as a “network of networks.” As such, one of its key attributes is making the passage of data from one
network to another easy. So, when a user sends an email, views a video, or downloads a file from a website, the data may pass through a large number of different networks on the way from its origin to its destination, with the routing virtually transparent to the user.
This architecture has proven to be extremely flexible and powerful, both nationally and globally. Individuals, small businesses, and corporations with Internet access can easily access data of all sorts from around the world. Similarly, companies can efficiently and cheaply provide services such as email and web search on a global basis, in many cases without charge.
One sign of the Internet’s global success is the rapid growth of cross-border data flows. Cross-border data flows are growing far faster than conventionally measured trade in goods
BY DR. MICHAEL MANDEL
APRIL 2014
Data, Trade and Growth
About the author
Dr. Michael Mandel is the chief economic strategist at the Progres-sive Policy Institute and a senior fellow at Wharton’s Mack Institute for Innovation Mangement.
Acknoledgement
An earlier version of this paper was presented at the “Measuring the Effects of Globalization” conference in Washington, D.C., February 28-March 1, 2013. We thank the Alfred P. Sloan Foundation for their financial support. I thank Diana Carew of PPI, Alan Mauldin
and services. According to TeleGeography, a consulting firm that keeps track of international data flows, demand for international bandwidth increased at a compound annual rate of 49% between 2008 and 2012.1 By comparison, the
overall volume of global trade in goods and services, adjusted for inflation, rose at an average rate of 2.4% over the same period.
Looking at the data links between the United States and Europe in particular, the data-carrying capacity of transatlantic submarine cables rose at an average annual rate of 19% between 2008 and 2012. Meanwhile the overall volume of trade in goods and services between the U.S. and Europe, adjusted for inflation, is barely above pre-recession peaks.
Indeed, the global economic and financial system, as it stands today, would not function without cross-border data flows. Data flows that cross national borders are essential to everything from small business exports to manufacturing supply chains, global finance, international medical and physics research, entertainment, tourism, education, social media, and our local communities. Indeed, cross-border data is becoming increasingly important as an input to the production of goods by both small and large businesses and a crucial element for economic growth. “The cross-border free flow of information enables international trade which can lead to increased innovation, productivity and economic growth,” writes a paper from the Brookings Institution.2
Moreover, trade in data creates positive
externalities and an extra boost to global growth. Unlike exports of goods, data can be shipped from one country to another without depriving the first country of the benefits. All other things being
equal, growth in cross-border data flows can be a far more powerful impetus to consumer welfare, small business success, and economic growth than growth in trade in goods and services.
However, despite the importance of cross-border data flows, current international economic statistics are mostly uninformative and even misleading about their magnitude. First, note that cross-border data flows are not tracked as a separate category in trade statistics. Instead, cross-border trade involving data is lumped in with trade in services. For example, international telecommunications are treated as the export/import of a service. World Trade Organization estimated that global exports of telecommunications services totaled $111.5 billion in 2012.3
Treating cross-border data as a service creates a real problem. By international agreement among statistical agencies, the export or import of services is defined to occur when there is a monetary payment from a resident of one country to a resident of another in exchange for the service. For example, if a U.S. business hires accountants in London, that becomes an export of accounting services from the United Kingdom to the United States.
Virtually all of the existing statistics about cross-border trade in data are based on this monetary definition of service exports and imports. The July 2013 report from the United States International Trade Commission, “Digital Trade in the U.S. and Global Economies, Part 1,” identifies the Bureau of Economic Analysis (BEA), the Census Bureau, OECD, and Eurostat as the main sources for statistics on ‘digital trade.’ Each of these relies on the same basic definition of service exports and imports as being tied to a monetary exchange between residents of two different countries.4
Currently, international agencies such as the ITU only collect fragmentary statistics on cross-border data flows, though they are putting more effort into estimating such figures.5
We will show in this paper that the efficient global architecture of the Internet allows and even encourages data to cross national borders without
Cross-border data flows
are growing far faster
than conventionally
measured trade in goods
and services.
leaving a significant monetary footprint. As a result, economically important cross-border data flows are simply not being counted by current international economic statistics. We will offer evidence in this paper that both the level and rate of growth of data trade are being significantly understated.
This understatement has serious policy implications. First, the data sector is a bigger contributor to U.S. and global growth than current economic statistics show. Second, to the degree that trade negotiators prioritize their goals according to the relative magnitude of different trading sectors, trade policy should place more emphasis on maintaining the free flow of data. Similarly, international tax policy should place more emphasis on maintaining the free flow of data. Third, attempts by various countries to implement barriers to the free flow of data may do considerably more economic damage than the current trade statistics show. Potential obstacles to the free flow of data can hurt small and medium enterprises that use the Internet to conduct global business. This is especially important in the wake of recent revelations about the extent to which the National Security Agency (NSA) has monitored data flows around the world. This news has caused a rising demand within countries such as Brazil for demand for certain data to kept within national borders—so-called ‘data localization’ or data protectionism. The European Union is also considering new data privacy regulations that could potentially act as an impediment to flows of data in and out of the EU.
Finally, it’s becoming clear that better statistics about cross-border data flows are needed to
convince policymakers how important data is to economic health. That might help avoid trade and tax policies that are detrimental to growth. It is self-evident that good policy rests on a foundation of accurate and comprehensive knowledge about current and emerging trade flows.
HOW CROSS-BORDER DATA FLOWS ARE MEASURED TODAY
The World Trade Organization (WTO) and national statistical agencies such as the U.S. Bureau of Economic Analysis regularly produce figures on cross-border trade in data-related services such as telecommunications services, computer and information services, and financial services. Figure 1 shows the reported dollar value of global exports of selected data-related services.6
According to international standards, trade in services is typically measured by monetary transactions between residents of one country and residents of another country. (When we say ‘residents’ we mean individuals, small and medium enterprises, and establishments of large companies located in that country). That’s the main principle laid out by the Manual on Statistics
Attempts by various
countries to implement
barriers to the free flow of
data may do considerably
more economic damage
than the current trade
statistics show.
FIGURE 1. REPORTED GLOBAL EXPORTS OF SELECTED DATA-RELATED SERVICES, 2012
Service Global exports (billions of dollars) Annual growth rate (2008-2012) Communications services
(both voice and data) 111.5 3.4%
Financial services 303.1 0.3%
Computer and information services
(including web search) 262.7 7.2%
Royalties and license fees 289.6 5.9%
Sum of selected data-related
services 966.9 4.0%
Merchandise exports 18401.0 3.3%
of International Trade in Services, approved in 2010
by the United Nations Statistical Commission: The market price is used as the basis for valuation of transactions in international trade
in services. Market prices for transactions are defined as amounts of money that willing buyers pay to acquire something from willing sellers. The exchanges are made between independent parties and based on commercial
FIGURE 2. SERVICE TRANSACTIONS TRACKED BY BEA SURVEY
Transaction
code Types of transactions
Receipts for intellectual property
1 Rights related to industrial processes and products 2 Rights related to books, music, etc.
3 Rights related to trademarks
4 Rights related to performances and events pre-recorded on motion picture film and TV tape (include digital recordings)
5 Rights related to broadcast and recording of live events and performances 6 Rights related to general use software
7 Business format franchising fees 8 Other intellectual property
Receipts for selected services
9 Accounting, auditing, and bookkeeping services
10 Advertising services
11 Auxiliary insurance services
12 Computer and data processing services 13 Data base and other information services 14 Educational and training services 15 Industrial engineering services
16 Industral-type maintenance, installation, alteration, and training services
17 Legal services
18 Management, consulting, and public relations services (including expenses allocated by a U.S. parent to its foreign affiliates)
19 Merchanting services
20 Operational leasing services
21 Trade-related services, other than merchanting services
22 Performing arts, sports, and other live performance, presentations and events 23 Research and development services
24 Telecommunications services 25 Agricultural services
26 Disbursements to fund production costs of motion pictures
27 Disbursements to fund news-gathering costs and production costs of program material other than news 28 Waste treatment and depollution services
considerations only and are sometimes called “at arm’s length” transactions.7
Similarly, the Bureau of Economic Analysis (BEA)—the statistical agency in charge of tracking service trade—measures data-related exports and imports by tracking the money received from ‘foreign persons’ and the money paid to ‘foreign
persons.’ The BEA collects much of its data on service sector exports and imports through surveys, specifically, “BEA benchmark (BE-120) and quarterly (BE-125) Survey of Transactions in Selected Services and Intangible Assets with Foreign Persons.”8 Figure 2 shows the fairly long
list of services queried in these surveys. Many of these include cross-border data flows, including telecommunication services, royalties and license fees, database and other information services, and financial services.
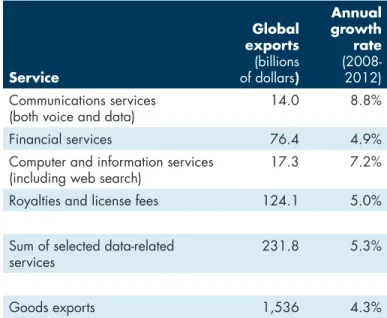
These reports feed into the widely cited monthly report on “U.S. International Trade In Goods And Services,” including the goods and services trade deficit, which is a key number for economists in government and the private sector. In addition, the BEA produces an annual report on trade in services. Figure 3 shows statistics on exports for selected data-related services in 2012.
THE ARCHITECTURE OF
THE INTERNET AND DATA TRADE
The figures in the previous section raise two disturbing questions. First, when measured as a service, the rate of growth of the cross-border data-related services is barely higher than the growth rate of merchandise trade, both for the globe and for the U.S. Second, the aggregate numbers make cross-border data trade look relatively unimportant. For example, reported U.S. telecom exports of $14 billion in 2012 are roughly the same size as U.S. exports of newsprint.
The global and national statistics on trade in
services are based on tracking monetary exchanges between residents of different countries. In
theory, this principle can be applied to trade in data as well. If a person in the United States downloads a file from a website in a different country, it’s theoretically possible that he or
she could be charged for both the cross-border telecommunications link and for the content in the file.
However, in practice the architecture of the Internet has developed in such a way that many or perhaps most cross-border data flows do not result in an exchange of money between residents of different countries. Let us illustrate this important point with a simple example: An American economist who visits the website for the Bank of Russia (www.cbr.ru) and wants to obtain statistics about the latest movement of the Russian monetary supply.
First, imagine that these statistics were in bound volumes that had to be shipped from Moscow. There’s little doubt that the cost of the volumes and the shipping would be quite high, and would register as imports in the trade statistics.
But when the data is downloaded, there is no charge for content. The Russian central bank is not charging U.S. economists for downloading data. So if this cross-border data transfer is going to create a monetary footprint and show up in the BEA statistics, it will happen because the
FIGURE 3. REPORTED U.S. EXPORTS OF SELECTED DATA-RELATED SERVICES, 2012
Service Global exports (billions of dollars) Annual growth rate (2008-2012) Communications services
(both voice and data) 14.0 8.8%
Financial services 76.4 4.9%
Computer and information services
(including web search) 17.3 7.2%
Royalties and license fees 124.1 5.0%
Sum of selected data-related
services 231.8 5.3%
Goods exports 1,536 4.3%
telecommunications transport across national borders involves an exchange of money between a U.S. resident and a non-U.S. resident.
Obviously the economist or his or her institution pays a domestic Internet service provider such as Comcast or Verizon for an Internet connection. But unlike an international phone call, no extra
money is paid for the foreign website. The data request is passed from network to network until it reaches the Russian central bank, which then sends the money supply figures back again. At some point, that data request passes from a U.S.-owned network to a foreign-U.S.-owned network. For the sake of clarity of the example, let’s assume that the U.S.-owned network also owns the submarine
Historically the major cross-border data flow was the conventional international phone call. In the United States, the originator of an international phone call picked up a telephone, dialed 011, the country code and phone number, and paid an international charge to his or her phone company. The provider then paid the carrier in the receiving country according to a government-mandated settlement schedule. Conversely, the recipient of an overseas call did not pay an international charge—instead the overseas caller paid his or her local provider in their own country, who settled up with the U.S. phone company.
Under this scheme, calls from the U.S to overseas points were classed as imports, because the foreign carrier received the payments. Calls from other countries were classed as exports, since the payments came to the U.S. carriers. So if U.S. customers made more overseas calls than they received, the telecom trade balance would be negative. Indeed, that was true for many years. According to an FCC report from 1998:
U.S. carriers owe settlement payments for the services that they bill, and are owed payments for the services that the foreign carriers bill. In addition, U.S. carriers are owed payments for switched traffic that transits U.S. points. Because U.S. customers place far more calls than they receive and because U.S. carriers terminate more collect calls that generate surcharges for the originating carrier, U.S. carriers make net settlement payments to most foreign carriers. The total net payment for all U.S. carriers grew from $0.4 billion in 1980 to $5.6 billion in 1996. (Trends In The U.S. International Telecommunications Industry” FCC, August 1998 http://transition.fcc. gov/Bureaus/Common_Carrier/Reports/FCC-State_Link/Intl/itltrd98.pdf)
Reading this explanation, however, should make it clear that this definition of telecom imports and exports is an artifact of a regulatory convention that “calling party pays” for wireline calls. Suppose instead that we had a rule that “receiving party pays” as in a collect call or an 800-number. Under that alternative regulatory regime, the toll on an outgoing international call would be collected from the recipient of the call by his or her (foreign) carrier. The foreign carrier would then remit a portion of the charge to the originating domestic carrier. As a result, with ‘receiving party pays’ an outgoing international call would be treated as an export. Similarly, an incoming call would be treated as an import. Thus, a shift in regulatory conventions from ‘caller pays’ to ‘recipient pays’ would immediately turn a telecom trade deficit into a trade surplus, without altering the final allocation of revenues to the respective telecom carriers after the settlement process. In addition, outgoing and incoming international calls were physically indistinguishable, in terms of the equipment used.
cable between New York and the United Kingdom, so that the interchange between the U.S.-owned network and foreign network physically occurs in the U.K.9
Is there an exchange of money between the U.S.–owned and the foreign-owned network? Now we have to delve into the architecture of the Internet. Networks are connected in two ways, by peering or by the payment of transit fees. Peering is an agreement between two networks to exchange traffic without exchanging money. Peering agreements, especially between large networks, are so ubiquitous that they are basically conducted on a handshake, as one authoritative OECD study shows:10
A survey of 142,000 peering agreements conducted for this report shows that the terms and conditions of the Internet interconnection model are so generally agreed upon that 99.5% of interconnection agreements are concluded without a written contract.
In fact, the largest global networks—the so-called ‘Tier 1’ networks—almost by definition peer with
every other Tier 1 network. That means if a data packet goes from AT&T’s network to British Telecom’s network on the way from Russia, it is unlikely that money changed hands at the interconnect between the two.
It might seem like peering is a barter-type agreement that should generate revenue recognition on the financial books, even if no money exchanges hands. However, peering takes place mostly in situations of balanced traffic, so the revenues and costs would net out. The accounting firm KPMG notes that:11
In our experience, peering arrangements between Tier 1 telecoms do not result in the recognition of revenue even though a service is provided and value is transferred between telecoms in much the same way as under traditional interconnect arrangements.
It’s also worth noting that peering is a key reason that you can access websites from all over the world
without having additional charges added to your Internet bill.
Alternatively, smaller networks can connect
up to larger ones by paying transit fees, also known as buying Internet transit. In theory
these Internet transit payments could show up as trade in telecommunications services, if the smaller network was paying a provider from a different country for transit. However, the price of Internet transit has been dropping sharply. According to market research firm TeleGeography, price of IP transit at major hubs has dropped at roughly 30% per year over the past 5 years.12 To the knowledge of
the author, no statistical agency currently uses the price of Internet transit to adjust service trade.
ESTIMATING ONE COMPONENT OF DATA TRADE
For the reasons described in the previous section, we would expect that the official statistics on cross-border data trade (trade in data-related services) far understate both the actual economic value and growth of cross-border data flows. But how big is the understatement?
In this section, we will try to answer one small piece of this question. In particular, we will delve deeper into the measurement of U.S. telecom ex-ports, and construct an alternative estimate based on directly measuring cross-border data flows. For 2012, the Bureau of Economic Analysis reports that exports of communications services from the United States amounted to $14 billion (pay-ments from nonresidents to residents). Imports of communications services into the United States amounted to $8 billion (payments from residents to nonresidents). These numbers have been rising, but they are still miniscule compared to the im-portance and amount of international data traffic in and out of the United States.
However a closer look helps explain why these have to be understatements. Let’s start with a simple example. Suppose a major U.S. telecom provider builds its own submarine cable to Great Britain, say, or Singapore. That expenditure will show up in the company’s capital spending budget, rather than as a payment for cross-border telecom ser-vices. Then if the U.S. provider peers with foreign
providers at the non-U.S. cable landing, no money will change hands at the connection point. The result: the telecom provider has made a major investment in providing cross-border data flows, none of which show up in the trade account. The export benefits of capital investment by the tele-com industry are not being counted.
More generally, most submarine cables are being built these days by a consortium of companies, each of whom get access to a share of the band-width. The same principle shows up as in the pre-vious example—the spending on the cable shows up as a capital investment, rather than a payment for cross-border telecom services. From here, we can construct increasingly complicated examples that arrive at the same place—cross-border trans-port of data without a corresponding monetary transfer between residents and nonresidents. How can we construct a better estimate of cross-border telecom services? In an earlier paper, we discussed the idea that the production and use of data should be treated as a fundamental component of economic activity, parallel to the production and use of goods and services.13 This approach leads
naturally to an increased focus on directly measur-ing data generation, data flows, and data storage as a way of understanding economic activity.
One pioneer in such efforts has been Martin Hilbert, who has been developing a systematic methodology for comparing the communications capacity of various media, ranging from mobile to television.14 Based on this work, the International
Telecommunications Union (ITU) has been gradu-ally moving towards direct measures of data flows, as opposed to indirect measures such as numbers of cellular subscriptions or broadband connec-tions. A recent publication from the ITU notes:
Using the unifying metric of bits per second, employed for measuring global technological capacity to communicate, it is possible to
compare different communication technologies. It is also possible to analyze bits per second per capita, per technology, per country or per any other relevant socio-economic or demographic parameter.15
This section follows in the same spirit of direct measurement of data flows. For the purposes of this section, data flow is measured in terabits per second (Tbps). The telecommunications market research and consulting firm TeleGeography esti-mates that the U.S. had 23 Tbps of international
Internet capacity in 2012, with an average utiliza-tion of 29% and a peak utilizautiliza-tion of 49%.16 This
suggests that on average, the U.S. cross-border data flow is roughly 6.7 Tbps.17
Is this volume of cross-border data a large number or a small number? We compare the cross-border data flow with a recent
Cisco-We find that cross-border
data flows are roughly
25% and 16% of U.S.
Internet and IP traffic,
respectively.
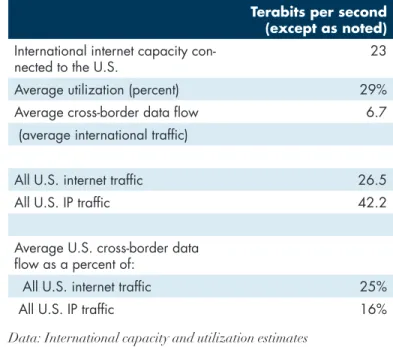
FIGURE 4: CROSS-BORDER DATA FLOWS, 2012: UNITED STATES
Terabits per second (except as noted)
International internet capacity
con-nected to the U.S. 23
Average utilization (percent) 29%
Average cross-border data flow 6.7
(average international traffic)
All U.S. internet traffic 26.5
All U.S. IP traffic 42.2
Average U.S. cross-border data flow as a percent of:
All U.S. internet traffic 25%
All U.S. IP traffic 16%
Data: International capacity and utilization estimates from TeleGeography
Traffic estimates from Cisco. IP includes both internet traffic and managed IP such as consumer video. Figures omit mobile.
sposored projection of data traffic, by country and type.18 For 2012, the Cisco study estimates that
Internet and IP traffic in the United States at 8 exabytes per month and 13 exabytes per month, respectively.19 That translates into roughly 26.5
Tbps and 42.2 Tbps.20
Figure 4 compares the U.S. cross-border data flows with the overall U.S. Internet and IP traffic. We find that cross-border data flows are roughly 25% and 16% of U.S. Internet and IP traffic, re-spectively. To put this in perspective, U.S. exports of goods and services are 14% of U.S. gross domes-tic product (GDP) in 2012, while U.S. imports of goods and services are 18% of U.S. gross domestic product (GDP) in 2012.
This calculation offers us a reasonable way of estimating the size of the international component of the U.S. telecom sector. According to the BEA,
the gross output for the telecommunications in-dustry in 2011 was $556 billion.21 After adjusting
for growth, that puts the gross output at roughly $575-$600 billion in 2012.
If we assume that the international component of the telecom industry is proportional to the size of the data flow, the international component of U.S. telecom would be roughly $92-$150 billion. That’s compared to the $14 billion in exports and $8 billion in imports that the official statistics report.
Obviously this should be viewed as an exploratory effort, with plenty of caveats. However, the revised estimates intuitively make more sense than the of-ficial statistics, in terms of measuring the impor-tance of cross-border telecom services. Of course, these numbers are accompanied by substantial and worrisome caveats and the possibilities of large errors in both directions. In particular:
• Coverage and methodology may differ. Cisco’s projections include all IP usage. TeleGeography’s estimates of international capacity by country do not include private networks such as intra-corporate networks, Google and other content providers
networks, and research networks. This factor would tend to underestimate the share of cross-border traffic.
• Double counting is inevitable. International Internet traffic is often routed through third-party countries before getting to its destination. Traffic between Moscow and New York might be routed through London and therefore show up as part of European cross-border data flows. Traffic between the Canadian cities of Vancouver and Toronto might be routed through the United States, and therefore show up as part of U.S. cross-border data flows. And since less-developed countries may have better Internet connections with the U.S. and Europe than with each other, it’s possible for intra-African traffic, say, to be routed through New York or London. This factor
Using a similar methodology as for the U.S., we can calculate interregional cross-border data flows as a share of Internet traffic for Europe. TeleGeography estimated that international bandwidth in Europe was 56.5 Tbps in 2012, but that 78 percent of that bandwidth was between cities in the same region. As a result, “interregional internet capacity connected to Europe” equaled 12.6 Tbps in 2012. Based on this figure, we calculate that cross-border data flows between Europe and the rest of the world equaled 16% of the region’s Internet traffic and 13% of the region’s IP traffic.
These results, which should be viewed as highly imprecise and tentative, suggest that the United States is more interconnected with the rest of the world than Europe. The sources of error enumerated in the caveats above are potentially very significant.
would tend to overestimate the share of cross-border traffic
• When comparing estimates/forecasts from different sources, timing matters. International Internet capacity, as estimated by TeleGeography, had been growing at almost 50% per year. Domestic U.S. Internet traffic as projected by Cisco, has been growing roughly as fast. As a result, calculating cross-border data flows as a share of Internet traffic can be heavily influenced if one source is using yearly averages while the other source (TeleGeography) is using a particular point in time (April of each year). The direction of bias is uncertain.
• Compression may distort the statistics. Widespread and growing use of
compression means that, “we communicate around three times more information through the same installed infrastructure as we did in 1986.” It’s possible that cross-border data flows may be compressed more intensively than purely domestic data flows.22
MEASURING THE ECONOMIC BENEFITS OF CROSS–BORDER DATA FLOWS
Why are we concerned with correctly measuring cross-border data flows? The classic justification for the benefits of trade is that two or more
countries working together can produce more than the same countries operating separately. Moreover, the size of the gain from trade is related to the magnitude of trade, all other things being equal. The more trade, the better.
Under the current trade statistics, the magnitude of trade in data is being systematically
underestimated. Thus, the benefits from trade in data are being systematically underestimated as well, which as we will see in the next section distorts policy decisions.
Moreover, trade in data has somewhat of the characteristic of a public good, since data can be duplicated relatively costlessly. As a result, data
created in one country and used in
another country does not deprive the first country of its use. To use a specific example, one type of intangible capital stock is
‘entertainment, literary, and artistic originals’, including films. Licensing the right to show a film in a foreign country currently shows up as an export in the national income accounts. However, such a license generally does not reduce the ability of American consumers to view the film and does not reduce the intangible capital stock of ‘entertainment, literary, and artistic originals’.
As a result, trade in data creates positive
externalities and an extra boost to global growth. Unlike exports of goods, data can be shipped from one country to another without depriving the first country of the benefits. All other things being equal, growth in cross-border data flows can be a far more powerful impetus to consumer welfare, the success of small and medium
enterprises, and economic growth than growth in trade in goods and services.
This means that data trade generates a positive externality for the global economy. If a U.S. university produces educational videos about computer science and makes them available on the Internet, then students around the world can benefit from those videos.
Now we turn to the question of how data trade figures into calculations of gross domestic product and economic growth. As noted in an earlier paper, data can be ‘consumed’ by individuals; used
We need to carefully
consider the positive
impact of cross-border
data flows on the success
of small and medium
enterprises, which can use
the Internet to achieve
globalization more easily.
as an intermediate input into production by large companies or small and medium enterprises, and can be an investment in intangible capital.23
There is a well-established methodology for assessing the contribution to economic growth through trade in conventional goods and services. In the calculation of gross domestic product, the dollar value of exports is a plus, while the dollar value of imports is a minus. For the calculation of gross domestic purchases—which are one measure of living standards—the dollar value of exports of goods and services is a minus, while the dollar value of imports of goods and services is a plus. The arithmetic does not work quite the same for cross-border data flows, for two reasons. First, because data that is exported is still available domestically, so exports don’t need to be subtracted from gross domestic purchases. Second, imports of data potentially come in at low or zero prices, as discussed above, despite the fact that there is a positive price to originally producing the data and then transporting it across national borders. As a result, imports of data, valued in dollars, appear not to contribute to growth.
Consider, however, that the alternative to importing the data at a low or zero price is to produce it domestically at its full cost, which would be higher than the import price. Viewed from that perspective, there is a growing body of literature about how to value the contribution to growth of imports that are priced much lower than comparable domestic products. We will show how this approach can be used to value cross-border data flows.24
To demonstrate how this would work, we will consider the amusing category of YouTube videos of cats involved in different activities. Quite a few of these videos are produced in Japan, and get millions of free views.25 They provide pleasure
for viewers in America and around the world, analogous to going skiing or reading a book. In some sense, they raise consumer welfare in the U.S. for people who enjoy videos of cats.
But how should the gain to the U.S economy from these “free” data flows be measured? The key is to realize that there are two relevant prices here. One is the price to Americans of consuming the Japanese-made cat video, which is zero. The second is the maximum price Pcat that an
American would pay for viewing a Japanese-made cat video, measured either in dollars or value of time. We assume that there is no way of profitably producing a comparable video with Japanese cats in the United States—in other words, in order to produce comparable videos domestically, they would have to be sold at an average price per viewing in excess of Pcat.
So before YouTube, it was as if the price of
Japanese cat videos to Americans was equal to Pcat,
and the volume of videos viewed was zero. After the Internet and YouTube, the price P of Japanese cat videos goes to zero, and the volume of videos viewed goes to V.
How much does this change contribute to U.S. gross domestic purchases? For the sake of simplicity, assume that X is the size of gross domestic purchases in dollars, excepting cat videos. Let’s also assume that there is no inflation and that X is otherwise not changing. Then the straightforward way of calculating growth would be as (X+P*V)/X, where P is the price of cat
videos after the introduction of YouTube. But P is zero, so it looks like there is no gain.
In fact, a better approach is roughly analogous to the procedure used to calculate chain-weighted GDP growth. We take the geometric average of two growth rates—the first assuming that the price of the video is always zero, and the second assuming that the price of the video is always Pcat.
In other words, the gain to gross domestic purchases from cross-border data flows of cat videos is roughly equal to the revenue that would generated by pricing the videos at the average of the actual price (zero) and the price that
Americans would be willing to pay, Pcat. Since this
requires no additional domestic resources, it is also the gain to consumer welfare.
POLICY IMPLICATIONS
Trade in data is a fundamentally new phenomenon. While many people would like to fit it into the framework of previous trade deals—in particular, the General Agreement on Trade in Services— such efforts will not work. We need new analytical tools to deal with both measuring cross-border data flows and assessing the benefits of these data flows. Moreover, we need to carefully consider the positive impact of cross-border data flows on the success of small and medium enterprises, which can use the Internet to achieve globalization more easily.
This paper has made the case that, without those tools, the economic impact of cross-border data flows are being understated. What effect does this understatement have on trade and tax policy? Trade and tax policy. Both trade and tax policy require a series of compromises and trade-offs. In the case of trade negotiations, a wide variety of different industries and interests—agriculture, low-tech manufacturing, high-tech manufacturing, finance, insurance—are competing for the
attention of policymakers. Both large companies
and small and medium enterprises are involved. Trade negotiators have to decide which issues are “must-haves” and which ones they can retreat on.
Similarly, tax policy requires balancing out the need to raise revenue against the negative effect of taxes on different industries. That’s especially true in today’s climate, where tax cuts affecting one industry will have to be balanced by closing tax loopholes or raising taxes affecting other industries.
Moreover, policymakers have to consider the special impact of cross-border data flows on small and medium enterprises. The ability to tap into the global Internet gives such businesses the opportunity to access foreign markets in a way that was not possible before.
Policymakers and negotiators make these decisions partly by assessing political reality, and partly by assessing economic strength. All other things being equal, industries that have a bigger positive effect on jobs and growth will fare better in trade and tax policy.
The problem is that the positive benefits of cross-border data flows—because they are such a new phenomenon—are significantly underestimated in the available official statistics. Reported exports of data-related services show up as relatively minor in the larger picture. Under the circumstances, the impact of cross-border data flows on economic growth will be understated as well, and it will be more difficult for policymakers to set the right priorities for trade and tax policy.
The problem is that the
positive benefits of
cross-border data flows—
because they are such a
new phenomenon—are
significantly
underestimated in the
available official statistics.
25
the first assuming that the price of the video is always zero, and the second assuming that the price of the video is always Pcat.
𝑔𝑔= (𝑋𝑋 + 0 ∗ 𝑉𝑉)𝑋𝑋 ∗ 𝑋𝑋+ 𝑃𝑃𝑋𝑋!"#∗ 𝑉𝑉 = 1 +𝑃𝑃!"#𝑋𝑋∗ 𝑉𝑉≈ 1 +𝑃𝑃!"#2𝑋𝑋∗ 𝑉𝑉
In other words, the gain to gross domestic purchases from cross-‐border data flows of cat videos is roughly equal to the revenue that would generated by pricing the videos at the average of the actual price (zero) and the price that Americans would be willing to pay, Pcat. Since this requires no additional domestic resources, it is also the gain to consumer welfare.
Policy Implications
Trade in data is a fundamentally new phenomenon. While many people would like to fit it into the framework of previous trade deals—in particular, the General Agreement on Trade in Services—such efforts will not work. We need new analytical tools to deal with both measuring cross-‐border data flows and assessing the benefits of these data flows. Moreover, we need to carefully consider the positive impact of cross-‐border data flows on the success of small and medium enterprises, which can use the Internet to achieve globalization more easily.
This paper has made the case that, without those tools, the economic impact of cross-‐border data flows are being understated. What effect does this
understatement have on trade and tax policy?
Trade and tax policy. Both trade and tax policy require a series of compromises and trade-‐offs. In the case of trade negotiations, a wide variety of different industries and interests—agriculture, low-‐tech manufacturing, high-‐tech
manufacturing, finance, insurance—are competing for the attention of policymakers. Both large companies and small and medium enterprises are involved. Trade
For example, there have been several recent proposals for increasing the tax rate paid by international Internet companies, or imposing additional regulations on them. For example, a recent paper from the French government suggested a sort of tax on data. Such proposals— which would be likely to discourage cross-border data flows—are more likely to be seriously
considered in the absence of evidence showing the large positive economic impacts from such cross-border data flows.
Impact of data localization. Another example comes from the aftermath of the revelations about NSA monitoring, which has created a backlash against U.S. internet companies and intensified discussions about building “walls” that would keep certain types of personal data from leaving countries such as Brazil.
Several reports have identified the possible negative economic consequences from such actions.27 However, what’s missing is the ability
to actually track the negative consequences from data protectionism, since we do not currently track cross-border data flows. By comparison, if a country erects trade barriers against a particular tangible product, the impact of such a policy would immediately show up in the trade statistics. It’s difficult to measure the harm from barriers to data trade if we cannot measure the data flows to begin with. Weller and Woodcock note:28
It is also the case that regulations that are not explicitly intended to apply to Internet traffic exchange may have that effect. For example, restrictions on the ability to export certain data, such as customer profiles, intended to protect security and privacy, may also limit the development of Internet topology and the
growth of Internet assets in some regions. Similarly, tax policies in each country toward broadband and Internet businesses are likely to affect the choice of the locations for investment in Internet assets.
Policymakers need to be especially concerned with the impact on small and medium businesses.
CONCLUSION: THE NEED FOR BETTER DATA ON CROSS-BORDER DATA FLOWS
Businesses in any industry are usually ambivalent about the collection of government statistics about that industry. On the one hand, objective industry-wide statistics can be extremely useful for business decision-making and planning. On the other hand, the collection process can be intrusive, and accurate statistics can potentially attract new competitors or unwanted attention from regulators. The calculation gets even tougher for rapidly innovating tech industries. All other things being equal, tech companies are unlikely to call for additional investment in statistics that may be quickly outmoded by technological change.
However, the balance changes in a situation where businesses need government support in order to avoid bigger problems. In particular, better information about cross-border data flows will help make the case that data protectionism and taxes on data can be economically destructive. The bottom line is that the statistical agencies should supplement the current trade statistics with additional metrics on cross-border data flows. This should be part of a large push to better measure data consumption and investment domestically.
ENDNOTES
1. “Global Bandwidth Research Service,” TeleGeography, http://www.telegeography.com/research-services/global-bandwidth-research-service/index.html.
2. Joshua Meltzer, “The Internet, Cross-Border Data Flows and International Trade”, Brookings Institution, February 2013. 3. “International Trade Statistics 2013,” World Trade Organization, http://www.wto.org/english/res_e/statis_e/its2013_e/
its2013_e.pdf.
4. “Digital Trade in the U.S. and Global Economies, Part 1”, US ITC Table 4.2, .
5. See for example Measuring the Information Society 2012, International Telecommunications Union, 2012, http://www.itu. int/ITU-D/ict/publications/idi/material/2012/MIS2012_without_Annex_4.pdf.
6. “International Trade Statistics 2013,” World Trade Organization, http://www.wto.org/english/res_e/statis_e/its2013_e/ its2013_e.pdf.
7. Manual on Statistics of International Trade in Services (2010), UN Department of Economic and Social Affairs Statistics Division, https://unstats.un.org/unsd/tradeserv/TFSITS/msits2010/docs/MSITS%202010%20M86%20(E)%20web.pdf. 8. “Chapter 8: net exports of goods and services,” Bureau of Economic Analysis, updated November 2011. http://www.bea.gov/
national/pdf/ch8NetExport%20for%20posting.pdf.
9. Many large providers own their own undersea cables, have a share of a cable, or have long-term rights to use part of the bandwidth. Submarine cable is used to carry cross-border data flow across oceans but also often between countries on the same continent, because it’s often easier and safer to maintain cables that run along the coast underwater than across difficult terrain. Cables are typically laid with multiple strands of optic fiber, some of which are ‘lit’ and have the necessary equipment to be used, and some of which are ‘dark’ and not yet ready for use. Capacity can be increased by laying new cables, lighting dark fiber, or by improving the capacity of already lit fiber.
10. Dennis Weller and Bill Woodcock, Internet Traffic Exchange: Market Developments and Policy Challenges, OECD Digital Economy Papers 207, January 2013.
11. “Accounting under IFRS: Telecoms”, KPMG, January 2010, http://www.kpmg.com/CN/en/IssuesAndInsights/ ArticlesPublications/Documents/Accounting-under-IFRS-Telecoms-O-1001.pdf.
12. “IP Transit Port Upgrades Yield Steeper Price Declines for Buyers”, http://www.telegeography.com/press/press-releases/2013/10/08/ip-transit-port-upgrades-yield-steeper-price-declines-for-buyers/index.html.
13. Michael Mandel, “Beyond Goods and Services: The (Unmeasured) Rise of the Data-Driven Economy,” Progressive Policy Institute, October 2012.
14. See, for example, Martin Hilbert and Priscila Lopez, “The World’s Technological Capacity to Store, Communicate, and Compute Information”, Science, April 2011.
15. Measuring the Information Society 2012, International Telecommunications Union, 2012, http://www.itu.int/ITU-D/ict/ publications/idi/material/2012/MIS2012_without_Annex_4.pdf.
16. We thank Alan Mauldin of TeleGeography for providing these estimates.
17. These figure are based on the bidirectional averages of the monthly average and peak during April of each year.
18. See “The Zettabyte Era, ” Cisco, May 2012. http://www.cisco.com/en/US/solutions/collateral/ns341/ns525/ns537/ns705/ ns827/VNI_Hyperconnectivity_WP.pdf. See also http://ciscovni.com/vni_forecast/advanced.html.
19. Non-internet IP traffic in the U.S. is mainly consumer video.
20. 1 exabyte=1024 petabytes; 1 petabyte=1024 terabytes; 1 terabyte = 8 terabits.
21. “Gross-Domestic-Product-(GDP)-by-Industry Data,” BEA, 2012, http://www.bea.gov/industry/gdpbyind_data.htm. 22. “Mapping the dimensions and characteristics of the world’s technological communication capacity during the period of
digitization (1986 - 2007/2010)”, ITU, December 2011, prepared by Martin Hilbert.
23. Michael Mandel, “Beyond Goods and Services: The (Unmeasured) Rise of the Data-Driven Economy,” October 2012. 24. There is a growing literature about how to assess growth when import prices are less than domestic prices. See, for example,
W. Erwin Diewert and Alice O. Nakamura, “Bias Due to Sourcing Substitutions: Can It Be Measured?“ (March 19, 2010). See also R. Feenstra et al, “Estimating Real Production and Expenditures across Nations: A Proposal for Improving the Penn World Tables,” The Review of Economics and Statistics, 2009, vol. 91, issue 1, pages 201-212.
25. Gideon Lewis-Kraus, “In Search of the Living, Purring, Singing Heart of the Online Cat-Industrial Complex” wired.com, August 31, 2012, http://www.wired.com/underwire/2012/08/ff_cats/all/.
26. Pierre Collin and Nicolas Colin, “Mission d’expertise sur la fiscalitié de l’économie numérique,” January 2013, http://www. redressement-productif.gouv.fr/files/rapport-fiscalite-du-numerique_2013.pdf.
27. Daniel Castro, “How much will PRISM cost the U.S. cloud computing industry,” ITIF August 2013: Daniel Castro “The False Promise of Data Nationalism”, ITIF, December 2013; “The Cost Of Prism Will Be Larger Than ITIF Projects,”http://blogs. forrester.com/james_staten/13-08-14-the_cost_of_prism_will_be_larger_than_itif_projects.
research institution that seeks to define and promote a new progressive politics in the 21st century. Through research, policy analysis and dialogue, PPI challenges the status quo and advocates for radical policy solutions.
Progressive Policy Institute All rights reserved. Progressive Policy Institute 1101 14th St. NW Suite 1250 Washington, DC 20005 Tel 202.525.3926 Fax 202.525.3941 Email [email protected] www.progressivepolicy.org