Working Paper Number 89
Capital Flows To Developing Countries: Does The Emperor Have Clothes?
S Griffith-Jones* and J Leape
This paper begins by examining the pattern of capital flows first to low-income countries, and then to emerging economies. In both cases, we see a dramatic collapse in the last several years. The evolving determinants of these trends in FDI flows (the principal category of private flows to low-income countries) and other capital flows are analysed. The behaviour of flows to emerging economies heavily influences both present and potential future flows to low-income countries. The paper concludes with the policy implications at both source countries and low-income recipient countries.
September 2002
* Institute of Development Studies, Sussex University ** London School of Economics
Table of Contents
I Introduction
II New pattern and sharp decline of private flows III Policy implications
I Introduction
Since the Asian crisis, there has been a collapse in private capital flows to low- income developing countries, and emerging economies alike, and sharp changes in the
composition of these flows. According to World Bank data, net private flows to low-income countries dropped from $32bn in 1997 to just $2bn in 1999, rising slightly to $4bn in 2000 (see Table 1 below). Net private capital flows to all emerging
economies declined since 1997 and were practically zero in 2000 and 2001, according to IMF World Economic Outlook data shown in Table 2.
Insufficient emphasis has been placed as yet by analysts and policy- makers on the nature, causes and policy implications of these large changes. A key question is whether these changes are mainly structural or cyclical. Though this is a difficult question to answer, it is very important to attempt to do so, given the different policy implications for all involved, but particularly for low- income developing countries.
Indeed, one scenario is that recent trends continue for a long period. The surge in private capital flows to developing countries in the 1990s might have been, as the IMF November 2001 Emerging Market Financing Quarterly puts it, a “one-off portfolio stock adjustment” that has now run its’ course. This would imply that the presence of foreign companies, banks and other investors in developing economies would no longer contribute foreign exchange or external savings to these economies; their only contribution would be via transfers of technology, management know-how and other expertise. The latter is clearly important, particularly for certain categories of countries – such as low-income and transition economies. However, much of the value of foreign presence for developing countries is in the blend of both capital flows and transfer of expertise. If only transfer of expertise were to remain, the balance of benefits and costs would change quite significantly, as would the amount of policy and other effort that may be justified in trying to attract such flows. The emperor would have no clothes, or - more accurately - would be half- naked.
The alternative scenario is that the sharp decline is mainly driven by general cyclical factors and the memory of recent crises. If this is the case – and if crises stop
happening – then the pay-off is far greater for policy- makers (in developed and developing countries, as well as in international organisations), to make efforts to attract private flows to return to developing countries, as well as encouraging more those flows that are more stable.
As already mentioned, for low- income economies, the evolution of private capital flows shows an equally disturbing picture since 1997, when these flows have collapsed, as discussed in detail in section II. The situation there is particularly
worrying for two reasons. First, the decline is across the board, affecting all categories of inflows. In addition, the potential negative effect on growth and poverty reduction could be much larger.
The issues to emerge most strongly from this study are those of risk, imperfect information and missing markets. All three of these issues have implications for the developed country investor demand for long-term assets and for the supply of long-term assets in developing, and especially low- income, countries. As a consequence,
they have profound implications for policy as well. The issues are clearly interrelated, as imperfect information contributes to missing markets – and vice versa – and both contribute to risk. But there are distinct issues that arise in each case that merit separate analysis.
Risk is of fundamental relevance to investors, and has a direct influence on the price investors are willing to pay for an asset. Virtually all of the formal analysis in this area focuses on price risk – that is, the variance of total returns and their covariance with the returns of other assets. The financial crises of the 1990s, however, have demonstrated that liquidity risk is also a crucial factor influencing investors.
More fundamentally, while portfolio theory takes risk as exogenous to the investor, it is now clear that both investor behaviour and developed-country policy decisions influence price risk. Price risk is endogenous to investor behaviour as a result of, among other factors, benchmarking of fund managers and changes in global risk aversion (and its interaction with liquidity risk) – both of which lead to strong herd behaviour among investors. The relevance of these factors has been evident in the large swings in the degree of correlation among emerging market assets in the last half of the 1990s – a pattern that cannot be explained by exogenous changes in “fundamentals”. Price risk is also endogenous to policy decisions, which affect the incentives and constraints imposed on investors. An important recent example in this area is the new Ba sle Capital Accord and the now well-documented implications for the cyclicality, cost and level of financing to developing countries.
This endogeneity of risk to investor behaviour and to policy decisions underscores the importance of a developed-country policy response as part of any initiative to increase the supply of long-term capital to developing countries.
While the endogeneity of developing country asset risk to developed-country policy decisions has only recently begun to attract attention, the endogeneity of such risk to host (developing) country policies has long received intensive scrutiny. As discussed in more detail below, one key issue in this area is that of political and economic stabilisation, and the related issue of policy consistency.
The endogeneity of developing country asset risk to recipient country policy is closely related to the other themes of imperfect information and missing markets. An
important component of the “international financial architecture” response to the crises of the 1990s has been an increased emphasis on transparency of country data and policies – as reflected particularly in the area of codes and standards. The crises – notably those in Mexico and Thailand – highlighted how imperfect information can contribute to the misallocation of capital flows, exacerbating booms and impeding necessary policy adjustments. These crises showed that it is not only the
comprehensiveness and accuracy of information that matters but also its timeliness and regularity. The initiatives on codes and standards have been important in all these areas. However, as many analysts have noted, improved information is not, in many circumstances, sufficient to improve the efficiency of the allocation of capital flows.
While virtually all of the emphasis in this area has been on developing countries, it is worth remembering the LTCM debacle and the prolonged liquidity crisis that ensued. That crisis demonstrated that a lack of transparency in developed country financial
markets is also a factor that contributes to instability and can have an adverse impact on the demand for developing country assets.
A final theme in our analysis is the importance of missing markets. A distinguishing feature of long-term assets is the need for associated long-term contracts. Such contracts, in turn, require an institutional setting that includes well-defined property rights and effective enforcement mechanisms. It is therefore no surprise that recent research has highlighted the role of governance and property rights as impediments to investment. Another area in which missing markets are important is in the provision of long-term finance from domestic sources. Such finance can facilitate inward
investment both directly, by providing an alternative source of fund ing, and indirectly, by stimulating domestic investment and by providing a domestic yield curve against which assets can more easily be priced.
A related issue is that of the small and segmented nature of most low- income developing country markets. The small scale of most corporates in low- income countries is a factor not stressed in the literature, but one that we have established in interviews is a major constraint for both portfolio investment and bank lending to those countries. Market size and market access have been shown empirically to be key determinants of direct investment (e.g., Devereux and Griffith, 1998). These factors are also regularly cited by firms as a major obstacle to investment in Africa (e.g., the current CREFSA-CSAE survey of direct investors into Africa).
The issues of market size and market access have been interpreted by the “new” trade theory as fundamentally related to trade costs. A now extensive literature has
demonstrated the influence of such costs in determining not only the volume and direction of trade, but also the level and location of foreign direct investment. The magnitude of trade costs facing developing countries is determined primarily by three factors. The first of these is the economic trade costs such as those associated with weak transport and telecommunications infrastructure. These costs tend to be highest in the least developed economies. The second is the high costs of trading with
partners in the region, as a result of the slow pace of moves towards creating larger regional markets. Africa, in particular, has a long history of regional integration initiatives, but few successes. Progress in reducing the impediments to trade among regional partners in Africa and in South Asia can have a significant impact on inward investment flows. The final, and perhaps most important issue, is that of access to developed markets. The adverse impact on direct investment of small domestic markets can be overcome through access to other markets, particular the largest developed markets in the US and Europe. Yet, access to these markets is uneven, with significant tariff and non-tariff barriers in many of the areas of most relevance to developing countries.
Section II begins by examining the pattern of capital flows first to lo w- income countries, and then to emerging economies. In both cases, we see a dramatic collapse in the last several years. Section II goes on to analyse the evolving determinants of these trends in capital flows. It provides an assessment of FDI flows (the principal category of private flows to low- income countries) and goes on to assess other capital flows, focusing particularly on flows to emerging economies, which heavily influence both present and potential future flows to low- income countries. Section III examines the policy implications both in source countries and low- income recipient countries.
II New pattern and sharp decline of private flows
As shown by the World Bank data presented in Table 1, total private flows to low-income countries collapsed after 1997. As the collapse in private flows was
accompanied by only a small increase in official flows, total long-term net resource flows fell by half over the two years. Recently released figures show little signs of recovery in 2000, and the prospects for 2001-2 remain bleak. As discussed below, the pattern of private capital flows to emerging markets in recent years present an equally disturbing picture.
Table 1: Net long-term resource flows to low-income countries, 1990-2000 (1) In millions of US dollars 1990 1991 1992 1993 1994 1995 1996 1997 1998 1999 2000 Total 33,503 36,793 38,226 37,934 48,949 47,371 53,358 50,110 38,778 26,876 25,173 Official flows 26,867 28,527 28,102 24,710 26,826 22,326 19,756 18,883 23,670 24,652 20,592 Long-term loans (2) 11,918 12,224 12,594 11,072 9,564 5,758 4,840 5,065 8,878 9,321 5,402 Grants (3) 14,949 16,304 15,509 13,639 17,263 16,567 14,916 13,818 14,792 15,332 15,191 Private flows 6,636 8,266 10,124 13,224 22,122 25,045 33,603 31,227 15,108 2,223 4,581 Bank lending (4) 3,876 1,986 4,711 952 1,763 1,301 3,335 4,155 -3,765 -7,273 -7,296 Bond financing 142 1,734 -103 435 623 2,304 3,854 5,409 5,315 -2,841 2,787
Portfolio equity flows 416 33 499 4,564 10,727 7,617 8,846 2,671 649 2,616 2,528
Foreign direct investment (net) 2,201 4,514 5,016 7,273 9,008 13,824 17,569 18,993 12,910 9,721 6,562
Memo item
Short-term debt 7,464 1,962 5,200 -6,035 27 9,286 8,894 2,116 -13,757 -901 -254
Notes: 1. Source: World Bank, Global Development Finance 2002, database.
2. Includes "Net Flow of Long-Term Debt: Public & Publicly Guaranteed: Official Creditors" 3. Excludes technical assistance
1. An overview of private capital flows to low-income countries
Private capital flows to low-income countries have fallen across the board, with massive withdrawals of bank lending and even bond finance and, strikingly, a sharp drop in FDI as well. This contrasts with the experience of emerging markets and middle income developing countries more generally, where the collapse has focused on bank lending and FDI has continued to rise, as discussed above. The reversal in long-term bank lending began in 1998 in the aftermath of the Asian Crisis. Following average net new lending of $4bn in 1996 and 1997, there were net repayments of $3.5bn in 1998 more than doubling to $7.7bn in 1999. As shown in Table 3, the total repayments of long-term loans in 1998 and 1999 exceeded the total cumulative net lending over the period 1994 to 1997. This sharp reversal was compounded by a massive withdrawal of short-term loans (see memo item in Table 3). The net withdrawal of short-term lending in 1998 reached $13.7bn – almost fully offsetting the net inflows of long-term capital from all sources that year.
Bond finance to low- income countries also turned negative in 1999, following a string of large inflows in previous years. The downward trend in portfolio equity flows began earlier. Equity inflows dropped from an average of more than $9bn in 1994-96 to less than $2bn in 1997-99.
As briefly sketched out above, and as reflected in Table 2, and Graph 1, capital flows to emerging countries have suffered a major change since the East Asian crisis. According to IMF data from the October 2001 World Economic Outlook, net private capital flows to emerging market economies, which had peaked to almost $240 billion in 1996 (having grown consistently throughout the first half of the 1990's), more or less halved to around $120 billion in 1997, fell by around 40% to around $70 billion in 1998, fell a bit further in 1999 and collapsed to practically zero in 2000, and are projected by the IMF to be negative in 2001 (the most recent data for the latter is in the November 2001 IMF Emerging Market Quarterly). Emerging market current accounts have as a result also shifted dramatically, from significant deficits to very large surpluses, since 1999.
Table 2. Emerging Market Economies: Net Capital Flows (billions of US dollars)
1993 1994 1995 1996 1997 1998 1999 2000 2001(1) 2002(2)
Total
Private capital flows, net 139.1 147.5 205.5 234.4 119.1 69.1 58.6 0.5 -1.4 71.0 Private direct investment, net 57.6 81.4 97.5 120.0 145.8 155.9 153.1 147.3 162.7 158.2 Private portfolio investment, net 87.6 112.8 43.8 87.8 48.1 -2.0 31.7 1.5 -0.2 24.0
Other private capital flows, net (3)
-6.1 -46.8 64.2 26.7 -74.8 -84.9 -126.2 -148.3 -163.9 -111.2
Official flows, net 50.3 5.5 24.1 0.1 62.2 55.4 9.5 1.4 19.6 -3.5 Change in reserves - 64.3 -69.8 -117.7 -109.1 -61.9 -44.4 -87.6 -112.7 -81.5 -83.8 Memo item Current account -117.3 -72.7 -91.6 -95.7 -70.0 -52.6 39.1 128.1 69.6 14.5 (1) Estimated (2) Forecast (3)
Mainly net bank lending. Net bank lending is net lending minus variations of deposits in international banks and estimates; p projection
Source: IMF World Economic Outlook , October 2001
Graph 1 P r i v a t e C a p i t a l F l o w s t o E m e r g i n g E c o n o m i e s ( i n U S $ b n ) - 5 0 0 5 0 1 0 0 1 5 0 2 0 0 2 5 0 1 9 8 0 1 9 8 1 1 9 8 2 1 9 8 3 1 9 8 4 1 9 8 5 1 9 8 6 1 9 8 7 1 9 8 8 1 9 8 9 1 9 9 0 1 9 9 1 1 9 9 2 1 9 9 3 1 9 9 4 1 9 9 5 1 9 9 6 1 9 9 7 1 9 9 8 1 9 9 9 2 0 0 0 2 0 0 1 T o t a l P r i v a t e S e c t o r , n e t
As we will discuss in more detail below, there has also been an important change in the structure of private flows to emerging markets. These flows are now dominated by FDI (see again Table 2), which are the only significant source of supply of private capital to the total of emerging markets. According to data in the IMF 2001
International Capital Markets Report, this is particularly true for the Western Hemisphere and somewhat less the case for Asia, as in the latter net portfolio flows play a relatively large role (though smaller than FDI).
Compared to the experience of emerging market countries, the most striking and disturbing feature of the recent trends in private capital flows to low- income countries has been the sharp fall in foreign direct investment inflows. After climbing every year in the 1990s to reach a peak of almost $20bn in 1997, FDI inflows fell by almost half to less than $10bn in 1999. These changes are examined in more detail in the section that follows on FDI flows.
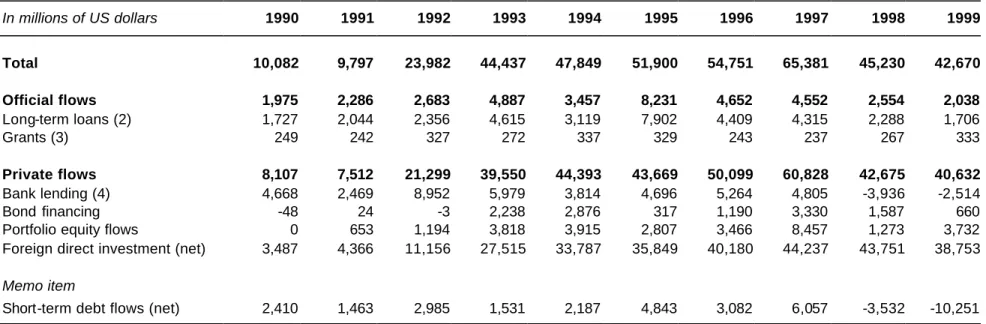
China has attracted around one- fifth of all private capital flows to developing countries in the 1990s. As shown in Table 4a, private flows to China increased strongly in the first half of the 1990s, peaking at $60bn in 1997, before falling back sharply to $42bn in 1998. The fall was due, in part, to a reversal in long-term bank lending, as net borrowing turned sharply negative in 1998 and 1999 (this was accompanied by a massive withdrawal of short-term bank lending, as shown in the memo item of Table 4). In addition, there was a collapse in bond finance and a sharp fall in equity investment. The impact of these declines was, however, limited by the dominance of FDI in total inflows. Indeed, FDI accounted for three-quarters of total net private inflows in the peak year 1998 and almost one-hundred percent in 1998 and 1999.
Table 3a: Net long-term resource flows to China, 1990-1999 (1) In millions of US dollars 1990 1991 1992 1993 1994 1995 1996 1997 1998 1999 Total 10,082 9,797 23,982 44,437 47,849 51,900 54,751 65,381 45,230 42,670 Official flows 1,975 2,286 2,683 4,887 3,457 8,231 4,652 4,552 2,554 2,038 Long-term loans (2) 1,727 2,044 2,356 4,615 3,119 7,902 4,409 4,315 2,288 1,706 Grants (3) 249 242 327 272 337 329 243 237 267 333 Private flows 8,107 7,512 21,299 39,550 44,393 43,669 50,099 60,828 42,675 40,632 Bank lending (4) 4,668 2,469 8,952 5,979 3,814 4,696 5,264 4,805 -3,936 -2,514 Bond financing -48 24 -3 2,238 2,876 317 1,190 3,330 1,587 660
Portfolio equity flows 0 653 1,194 3,818 3,915 2,807 3,466 8,457 1,273 3,732
Foreign direct investment (net) 3,487 4,366 11,156 27,515 33,787 35,849 40,180 44,237 43,751 38,753
Memo item
Short-term debt flows (net) 2,410 1,463 2,985 1,531 2,187 4,843 3,082 6,057 -3,532 -10,251
Notes: 1. Source: World Bank, Global Development Finance 2001, database.
2. Includes "Net Flow of Long-Term Debt: Public & Publicly Guaranteed: Official Creditors" 3. Excludes technical assistance
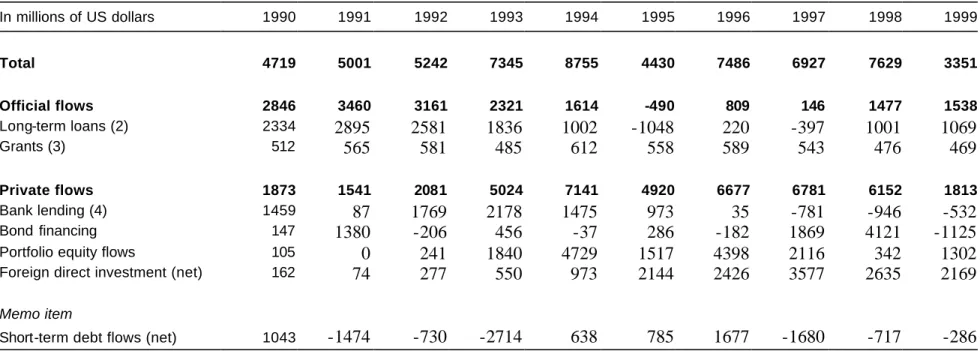
Table 3b: Net long-term resource flows to India, 1990-1999 In millions of US dollars 1990 1991 1992 1993 1994 1995 1996 1997 1998 1999 Total 4719 5001 5242 7345 8755 4430 7486 6927 7629 3351 Official flows 2846 3460 3161 2321 1614 -490 809 146 1477 1538 Long-term loans (2) 2334 2895 2581 1836 1002 -1048 220 -397 1001 1069 Grants (3) 512 565 581 485 612 558 589 543 476 469 Private flows 1873 1541 2081 5024 7141 4920 6677 6781 6152 1813 Bank lending (4) 1459 87 1769 2178 1475 973 35 -781 -946 -532 Bond financing 147 1380 -206 456 -37 286 -182 1869 4121 -1125
Portfolio equity flows 105 0 241 1840 4729 1517 4398 2116 342 1302
Foreign direct investment (net) 162 74 277 550 973 2144 2426 3577 2635 2169
Memo item
Short-term debt flows (net) 1043 -1474 -730 -2714 638 785 1677 -1680 -717 -286
Notes: 1. Source: World Bank, Global Development Finance 2001, database.
2. Includes "Net Flow of Long-Term Debt: Public & Publicly Guaranteed: Official Creditors" 3. Excludes technical assistance
Private inflows to India were, by contrast, stable in 1998, but then fell very sharply in 1999. As shown in Table 3b, FDI flows fell back somewhat in 1998-99 from their peak in 1997. While private flows to India proved resistant to the immediate fall out of the Asian crisis, the sharp contraction of the flow of international bond finance to developing countries that occurred in 1999 did have an effect, as India experienced a sharp reversal of bond financing leading to a drop in private inflows overall.
2. Foreign direct investment
Foreign direct investment is the dominant form of private capital flow to developing countries, accounting for about 70 percent of private flows to developing countries as a whole and a significantly higher percentage of private flows to low-income
countries. It is therefore particularly important to understand how these flows have evolved in recent years. The data analysed in the first part of this section were provided by UNCTAD, from the UNCTAD Handbook of Statistics 2001.
It is important to emphasise, as discussed above, that these data do not fully capture the flows of direct investment experienced by developing countries. As discussed in Annex 1, Bhinda, Griffith-Jones, Leape and Martin (1999) show that direct
investment flows are exceedingly difficult to monitor due to the problems of
measuring and identifying flows through institutions such as bureaux de change and even banks. Although it is impossible to identify the scale of the under- or
mis-recording with any degree of precision, case studies suggest that the underreporting of direct investment flows can easily amount to several percentage points of GDP. Thus, while the UNCTAD data on FDI remain the most reliable source of data for
international comparisons and analysis, they, like the World Bank data, must be used with caution.
The surge in foreign direct investment – and in private capital flows generally – in the 1990s is well-documented, as is the even greater surge in direct investment into developing countries. While the analysis below focuses on normalised levels of these flows as percentages of gross fixed capital formation (GFCF) and of GDP, it is useful first to examine the changes over time in the levels of direct investment flows and how these have been distributed across countries. Since both GFCF and GDP are relatively stable over time, it is by direct examination of the changing levels of FDI in low- income countries that we obtain the clearest picture of the trends and patterns in these flows.
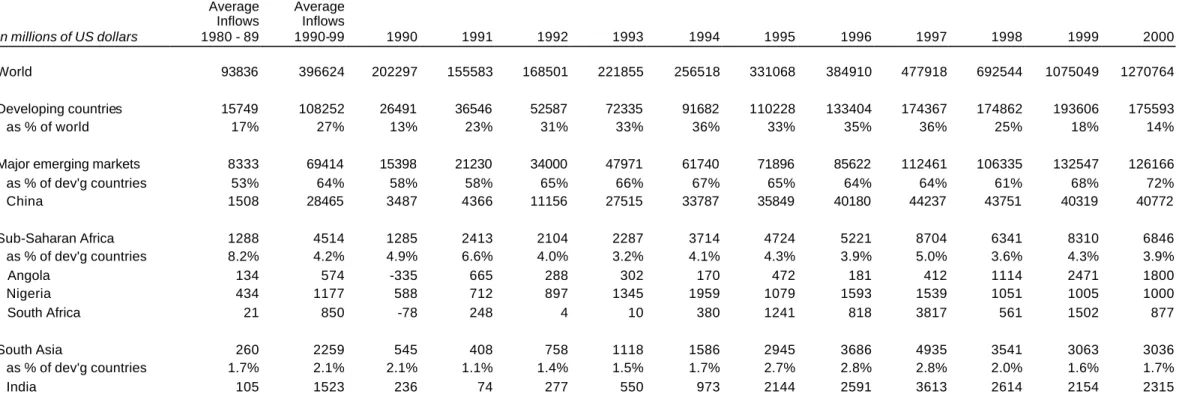
As shown in Table 4, annual inflows of direct investment into developing countries in the 1990s averaged $108bn (compared to $16bn in the 1980s). Indeed, the level of direct investment to developing countries increased every year in the 1990s, reaching $194bn in 1999.
An examination of the share of worldwide direct investment flows going to developing countries reveals a somewhat different picture, especially in the most recent period. UNCTAD data show that developing countries’ share of world direct investment flows averaged 27 percent in the 1990s (compared to 17 percent in the 1980s), peaking at 37 percent in 1997. This rise reflected, in part, the gathering pace of privatisation programmes in developing countries.
Since 1997, however, the share has dropped by more than half, reaching 14 percent in 2000. The declining developing country share is, in part, the result of the global mergers and acquisitions boom in 1998-2000, in which developing countries played only a very minor role. But the effects of the Asian crisis and of the LTCM-Russian crisis, and their aftermath, are also evident: apart from a short-lived increase in 1999, FDI flows to developing countries have not increased since 1997 while flows to developed countries have almost quadrupled.
Much of the increase in direct investment flows to developing countries in the 1990s was the result of a sharp rise in the investments flowing to a handful of the largest economies. The major emerging market countries together accounted for about two-thirds of the $93bn rise in average flows to developing countries between the 1980s and 1990s, with China alone accounting for $27bn of the rise. China’s share of total FDI flows to developing countries peaked at 38 percent in 1993, before falling to less than a quarter in recent years.
Direct investment flows to the major emerging markets have also proved robust to the downturn in flows to other developing countries since the Asian crisis as discussed below. Flows have risen strongly over the period, from $86bn in 1996 to $126bn in 2000. Much of the increase has gone to the major Latin American economies,
together with Taiwan and, especially, Korea, with flows to China and India remaining flat over the past five years.
Table 4: Inflows of foreign direct investment, 1990 – 2000 In millions of US dollars Annual Average Inflows 1980 - 89 Annual Average Inflows 1990-99 1990 1991 1992 1993 1994 1995 1996 1997 1998 1999 2000 World 93836 396624 202297 155583 168501 221855 256518 331068 384910 477918 692544 1075049 1270764 Developing countries 15749 108252 26491 36546 52587 72335 91682 110228 133404 174367 174862 193606 175593 as % of world 17% 27% 13% 23% 31% 33% 36% 33% 35% 36% 25% 18% 14%
Major emerging markets 8333 69414 15398 21230 34000 47971 61740 71896 85622 112461 106335 132547 126166
as % of dev'g countries 53% 64% 58% 58% 65% 66% 67% 65% 64% 64% 61% 68% 72% China 1508 28465 3487 4366 11156 27515 33787 35849 40180 44237 43751 40319 40772 Sub-Saharan Africa 1288 4514 1285 2413 2104 2287 3714 4724 5221 8704 6341 8310 6846 as % of dev'g countries 8.2% 4.2% 4.9% 6.6% 4.0% 3.2% 4.1% 4.3% 3.9% 5.0% 3.6% 4.3% 3.9% Angola 134 574 -335 665 288 302 170 472 181 412 1114 2471 1800 Nigeria 434 1177 588 712 897 1345 1959 1079 1593 1539 1051 1005 1000 South Africa 21 850 -78 248 4 10 380 1241 818 3817 561 1502 877 South Asia 260 2259 545 408 758 1118 1586 2945 3686 4935 3541 3063 3036 as % of dev'g countries 1.7% 2.1% 2.1% 1.1% 1.4% 1.5% 1.7% 2.7% 2.8% 2.8% 2.0% 1.6% 1.7% India 105 1523 236 74 277 550 973 2144 2591 3613 2614 2154 2315
The robustness of direct investment flows to the major emerging markets since the Asian crisis has not, however, been shared by the low-income developing countries. As shown in Table 1, FDI flows to low- income countries in 2000 were only a third of the 1997 levels.
An analysis of flows to Sub-Saharan Africa and to South Asia confirms this downward trend among low- income countries. As shown in Table 5, FDI flows to Sub-Saharan Africa as a whole have been volatile in the late 1990s. Virtually all of this volatility has, however, been due to just two countries: South Africa and Angola. Excluding those countries and Nigeria, FDI inflows to the region have declined since 1998, although less sharply than for low- income countries as a whole (see Leape, 2002, for a more detailed analysis of capital flows to Africa).
FDI flows to South Asia have dropped more sharply since 1997, with falls in all countries (see Table 4). After increasing almost 1500 percent between 1990 and 1997, direct investment flows to India have fallen back 40 percent in the last three years. Flows to the rest of the region have decreased by 30 percent over the same period.
If, however, we examine the magnitude of FDI flows in terms of recipient country GDP and gross fixed capital formation (GFCF), a different picture emerges. Annual FDI inflows to Sub-Saharan Africa, according to the UNCTAD data shown in Table 5, averaged just over three percent of GDP in the 1990s – on a par with flows to developing countries as a whole and substantially higher than the figures for the major emerging markets (two percent of GDP) or for developed countries (1.2 percent). As a share of gross fixed capital formation, FDI flows to Sub-Saharan Africa averaged 11 percent in the 1990s, more than double the percentage for developed countries (excluding the high M&A-driven figures at the end of the 1990s). These figures appear inconsistent with the high levels of risk in low- income countries, especially in Africa – a theme that is explored in more depth in section III.
The apparent inconsistency is, in part, a reflection of the low levels of fixed investment in Sub-Saharan Africa. More important, however, is the different
composition of direct investment in Africa compared to other regions. Leape (2002) shows that almost exactly half of the stock of US direct investment in Sub-Saharan Africa in 2000 was petroleum-related. Moreover, this percentage has increased from only a third in 1990, indicating that a substantial fraction of new direct investment into Sub-Saharan Africa in the 1990s was in the petroleum sector. This contrasts with the diversification of FDI flows to poor countries generally during the 1990s, where the share of the mineral- and oil-exporting countries in total FDI to the poor countries dropped from almost half in 1991 to 20 percent in 1997 (GDF 2002).
Table 5: FDI inflows as a percentage of GDP and of Gross Fixed Capital Formation FDI as % of GDP FDI as % of GFCF Average 1980-89 Average 1990-99 Average 1980-89 Average 1990-99 World 0.7 1.4 3.2 6.6 Developing countries 1.3 3.2 6.0 12.8
Major emerging markets 0.7 2.0 2.9 7.5
China 0.5 4.1 1.5 11.2 Sub-Saharan Africa 1.3 3.1 7.3 10.9 Angola 2.2 10.1 19.3 55.6 Nigeria 1.4 3.9 14.1 26.1 South Africa 0.0 0.7 0.0 3.7 South Asia 0.4 1.0 1.1 3.8 India 0.0 0.4 0.2 0.4
Source: Data supplied by UNCTAD, from forthcoming Handbook of Statistics, 2001.
The countries of South Asia have experienced lower levels of foreign direct investment than other developing countries, whether we look at FDI inflows as a fraction of GDP or of GFCF. FDI inflows averaged just one percent of GDP in the 1990s – less than one-third the level in developing countries as a whole (see Table 5). A similar picture emerges from a comparison of FDI inflows to gross fixed capital formation, where the share averaged less than four percent. Indeed, over the 1990s, FDI inflows into developing countries (and to Sub-Saharan Africa) more than doubled as a percentage of GDP – but rose by less than 25 percent in South Asia. The same picture emerges in even starker form as regards FDI flows into India. Measured as a fraction of GDP, FDI flows to India in the 1990s averaged only 0.4 percent – one-eighth the average for developing countries generally. As a fraction of GFCF, FDI was even less important, at less than a twentieth the average developing country level.
FDI flows to China present a very different picture. From insignificant levels in the 1980s, direct investment into China surged in the first half of the 1990s. As shown in Table 6, FDI to China as a share of GDP was twice the average for the major
emerging markets, and well above the average for developing countries. Foreign direct investment into China accounted for more than a tenth of average gross fixed capital formation in the 1990s, again exceeding the average for emerging markets by a significant margin.
Policy reforms and direct investment flows
The potential for sharply increasing FDI flows to low- income countries through policy reforms has been illustrated by the experience of Bangladesh in the 1990s. Bangladesh removed several restrictions on foreign investors – including prior approval requirements and restrictions on profit repatriation and on equity stakes – in
the early 1990s.1 FDI inflows then increased more than tenfold in 1997 (from $13mn in 1996 to $141mn in 1997) and continued at the new higher levels in 1998 and 1999. Although the energy sector has been the major recipient of these flows, manufacturing and service industries have received almost one-third of the new inflows. It is,
however, important to note that FDI flows to Bangladesh remain very small relative to the size of the economy, at less than one- half of one percent of GDP at their peak in 1998.
While liberalisation of restrictions on investors is clearly essential to attracting investment, they are far from sufficient. Numerous studies have identified unstable political and economic environments as a key impediment to long-term investment (see, for example, Hess, 2000, for a discussion of the issue in Southern Africa). Such instability creates problems of imperfect information, as investors face greater uncertainty in their expectations of future prices and future policies. Instability also leads to missing markets, as the resulting range of possible contingencies inhibits firms from entering into long-term contracts.
Many sources of economic and political instability are, however, amenable to action by governments and societies. Resolution of long-standing political conflicts can yield dramatic benefits. So, too, can macroeconomic stabilisation and greater policy
consistency. The transformation in Mozambique, for example, has been associated with a six- fold rise in inward direct investment, compared to a rise of less than threefold for developing countries generally. The political and economic stabilisation in Uganda led to a similar rise in direct investment inflows over the same period, while that in Tanzania has been associated with a tenfold increase. Equally dramatic was the impact of the democratic transition in South Africa, which was associated with an even larger proportionate increase in direct investment inflows over the period, albeit from a particularly low base in the early 1990s.
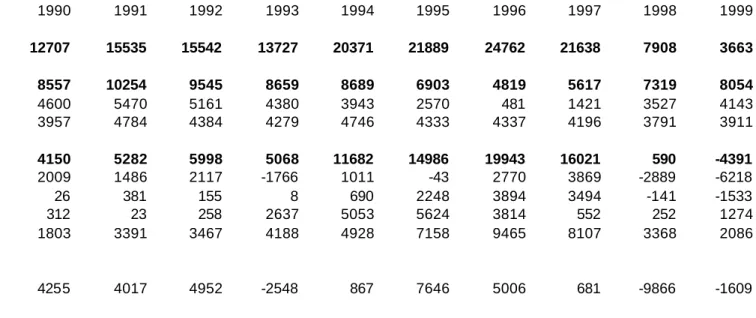
Table 6a,b,c provides further evidence of the importance of sound policy in attracting foreign direct investment. Table 6a show the net long-term resource flows to severely-indebted low- income countries, excluding the “original” and “enhanced” HIPC countries. Here the trends identified above for low-income countries as a whole (Table 2) come out even more strongly. Not only did private flows to these severely-indebted low- income countries collapse in 1998 (falling to a negligible £590mn from $16bn the previous year and $20bn in 1996), but they then turned strongly nega tive in 1999, with a net outflow of $4.4bn in private capital.
An examination of the composition of inflows shows a staggering withdrawal of long-term banking lending, with outflows in 1998-99 equal to some four-fifths of total cumulative inflows in the previous eight years. This outflow of long-term bank lending was accompanied by an equally dramatic outflow of short-term bank lending, an outflow of bond finance and a collapse in portfolio equity. Most surprisingly – and in contrast with the experience of emerging markets, as noted above - the data show a collapse in FDI inflows, with a drop of almost 80 percent between 1996 and 1999. Indeed, the reversal of private capital flows to these countries has been so dramatic
1
that more than half of all official assistance to these countries in 1999 was absorbed by repayments to private banks and bondholders.
Table 6a: Net long-term resource flows to severely-indebted low-income countries (excluding HIPC countries), 1990-1999 In millions of US dollars 1990 1991 1992 1993 1994 1995 1996 1997 1998 1999 Total 12707 15535 15542 13727 20371 21889 24762 21638 7908 3663 Official flows 8557 10254 9545 8659 8689 6903 4819 5617 7319 8054 Long-term loans (2) 4600 5470 5161 4380 3943 2570 481 1421 3527 4143 Grants (3) 3957 4784 4384 4279 4746 4333 4337 4196 3791 3911 Private flows 4150 5282 5998 5068 11682 14986 19943 16021 590 -4391 Bank lending (4) 2009 1486 2117 -1766 1011 -43 2770 3869 -2889 -6218 Bond financing 26 381 155 8 690 2248 3894 3494 -141 -1533
Portfolio equity flows 312 23 258 2637 5053 5624 3814 552 252 1274
Foreign direct investment (net) 1803 3391 3467 4188 4928 7158 9465 8107 3368 2086
Memo item
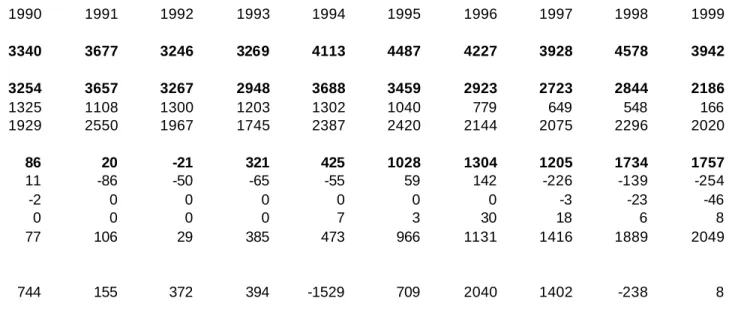
Table 6b: Net long-term resource flows to original HIPC countries, 1990-1999 In millions of US dollars 1990 1991 1992 1993 1994 1995 1996 1997 1998 1999 Total 3340 3677 3246 3269 4113 4487 4227 3928 4578 3942 Official flows 3254 3657 3267 2948 3688 3459 2923 2723 2844 2186 Long-term loans (2) 1325 1108 1300 1203 1302 1040 779 649 548 166 Grants (3) 1929 2550 1967 1745 2387 2420 2144 2075 2296 2020 Private flows 86 20 -21 321 425 1028 1304 1205 1734 1757 Bank lending (4) 11 -86 -50 -65 -55 59 142 -226 -139 -254 Bond financing -2 0 0 0 0 0 0 -3 -23 -46
Portfolio equity flows 0 0 0 0 7 3 30 18 6 8
Foreign direct investment (net) 77 106 29 385 473 966 1131 1416 1889 2049
Memo item
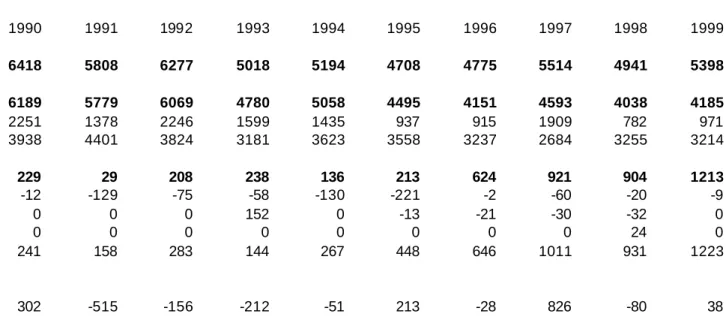
Table 6c: Net long-term resource flows to enhanced HIPC countries, 1990-1999 In millions of US dollars 1990 1991 1992 1993 1994 1995 1996 1997 1998 1999 Total 6418 5808 6277 5018 5194 4708 4775 5514 4941 5398 Official flows 6189 5779 6069 4780 5058 4495 4151 4593 4038 4185 Long-term loans (2) 2251 1378 2246 1599 1435 937 915 1909 782 971 Grants (3) 3938 4401 3824 3181 3623 3558 3237 2684 3255 3214 Private flows 229 29 208 238 136 213 624 921 904 1213 Bank lending (4) -12 -129 -75 -58 -130 -221 -2 -60 -20 -9 Bond financing 0 0 0 152 0 -13 -21 -30 -32 0
Portfolio equity flows 0 0 0 0 0 0 0 0 24 0
Foreign direct investment (net) 241 158 283 144 267 448 646 1011 931 1223
Memo item
Short-term debt 302 -515 -156 -212 -51 213 -28 826 -80 38
Notes: 1. Source: World Bank, Global Development Finance 2001, database.
2. Includes "Net Flow of Long-Term Debt: Public & Publicly Guaranteed: Official Creditors" 3. Excludes technical assistance
By contrast, Tables 6b and 6c show that the HIPC countries – both those in the “original” group and those in the “enhanced” group – experienced sharp increases in FDI inflows in recent years, which in both cases almost doubled between 1996 and 1999. These increases resulted in a steady rise in private capital inflows over the period, despite the small withdrawals of bank lending that occurred.
The contrasting experiences of the HIPC countries and the non-HIPC
severely-indebted low- income countries appears to provide evidence of the success of HIPC in attracting new private capital flows. On closer examination, however, the role of HIPC in stimulating the increasing flows is less clear. In the first instance, private capital flows, especially debt flows, to the original and enhanced HIPC countries in the first half of the 1990s were negligible – in contrast to the significant lending that took place to the non-HIPC severely- indebted low- income countries, with the result that there was simply less private capital to be withdrawn when the Asian crisis struck. Indeed, relative to previous debt inflows, the reversal of debt flows to the original HIPC countries was, if anything, greater in magnitude than the reversal experienced by the non-HIPC countries.
More importantly, the “outperformance” in direct investment flows to the original and enhanced HIPC countries – compared to the non-HIPC severely- indebted low- income countries – dates from 1997, which is before the impact of or even eligibility for HIPC (especially in the case of the “enhanced” countries) would have been anticipated by potential investors. It seems likely that HIPC status has conferred additional credibility on the economic reforms undertaken by the participating countries. However, on the basis of these data, one cannot reject they hypothesis that it is the good policy environment – for which HIPC was a reward – that has been more important in attracting increasing private capital inflows.
It is worth noting that the costs of instability can be just as great as the benefits of stabilisation, and tend to be felt more quickly. The current turmoil in Zimbabwe has led to a collapse in investment inflows, from a peak of $444mn in 1998 to $30mn in 2000.
The only significant exception to this pattern is natural resource-driven investment flows, which have proved relatively robust to political and economic instability. Angola, for example, has continued to attract substantial oil-related investments, despite the civil war. It is important to recognise that natural resource-driven
investments differ from other investments in important ways. The output is destined for world markets, and wholly independent of the domestic market. The returns are therefore typically in hard currency and often kept offshore in escrow accounts. The investments are carried out in enclaves where it is feasible for the investor to provide any needed infrastructure and protection. And the level of returns is generally high enough to enable the investor to buy the necessary political support from rent-seeking factions and politicians. For all of these reasons, mineral- and oil-related investment is relatively robust to the types of risk that would typically discourage investment in other sectors. This, in turn, helps to explain the relatively high level of FDI to Sub-Saharan Africa, especially relative to GDP and GFCF, in the face of the array of risks discussed more fully in section III below.
By contrast, investments aimed, at least in part, at producing for the domestic market; investments in the manufacturing and service sectors; investments aimed at building linkages with small and medium- sized enterprises – all of these depend critically on economic and political stability. Efforts to increase long-term investment into low-income countries must therefore pay close attention to this issue.
The foregoing examination of FDI inflows has revealed a degree of diversity among low- income countries. While the role of mineral and oil- related investments has been discussed in explaining the relatively high level of FDI in Sub-Saharan Africa, the low level of FDI in the poor countries of South Asia remains noteworthy. Against this background, it is striking that the countries of South Asia have, in recent years, achieved average growth rates twice as high as those in Sub-Saharan Africa. While an examination of the reasons for this divergent growth experience goes far beyond the scope of this paper, it is worth noting that this underscores the crucial importance of the productivity of investment.
More importantly, the data presented above demonstrate that private capital flows to low- income countries have collapsed since 1997, as debt outflows have been
compounded by steep declines in FDI.
These declines are particularly disturbing in light of the view expressed by market participants that FDI is the most attractive vehicle for investment in low- income countries, especially in Sub-Saharan Africa. Indeed, one senior market participant said: “FDI may be the only likely future flow to low- income countries.”2 An
explanation given by another market participant of why investors should prefer to go into low- income countries via FDI rather than via portfolio investment is that the former allows them more control which they see as particularly important, given that according to their perception, there is insufficient rule of law, imperfections in corporate governance and, especially, insufficient protection of minority investors. In this light, if the recent declines in FDI to low- income countries persist, they ma y herald a sharp reduction in the flow of private capital generally.
The sharp falls in direct investment to low- income countries add a new urgency to the question of how the demand for long-term assets in low- income countries can be increased. Part of the answer appears to lie in addressing a set of issues relating to developed country investors. Another part of the answer seems, as illustrated by the above review of several “success stories” from Africa, to lie in policy reforms – and, in particular, sustained efforts to achieve political and economic stabilisation – in the recipient countries. A detailed consideration of these issues – relating to developed-country investors and to recipient developed-country policies – is presented in Section III below.
Before proceeding to those issues, however, we turn to an examination of the
experience of emerging markets during the recent downturn in capital flows. As noted earlier, emerging market experience is highly relevant to that of low- income
countries. In the first instance, the more developed and more liquid emerging country markets typically provide the first indications of shocks that will later affect
developing countries more generally. More importantly, the emerging markets also
2
provide insights into the issues likely to face low- income countries as their capital markets, and their economies more generally, continue to develop.
In contrast to the pattern identified above in low-income countries, FDI to emerging markets has, in recent years, played a stabilising role, partly offsetting outflows of debt finance. However, FDI flows are increasingly hedged.
Within emerging markets, there has been not just a drastic fall in but also a dramatic change in the structure of flows. FDI to emerging markets, which had trip led since the early 1990's to peak at $155 billion in 1998, remained constant at that high level. It is since 1998 also the only significantly high source of foreign capital inflow for
emerging markets. This change in the structure of flows, with far greater importance for FDI, is overall a very positive development.
Important caveats are necessary even for FDI. The first one is that there is a risk that FDI even to emerging markets may not be sustained at its' current high levels. This is both because of changes in the developed economies and because the "easy phase," of FDI purchasing companies that are being privatised or buying large attractive
companies already in the private sector, may gradually come to a close. In successful dynamic economies or sectors, this phase may be followed by additional FDI to take account of profitable opportunities of expansion (e.g. as occurred in telecoms in several Latin American countries), or greenfield investment. However, in less dynamic economies or sectors, FDI may just decline in a second phase. (See recent Report on FDI by ECLAC, 2002)
The second caveat has been explored less in the literature, but it has in fact become a major new issue.3 It relates to the fact that multinational companies, especially those producing for the domestic market, can hedge the foreign exchange risk, either for their profit remittances or even up to the level of their capital. This may reduce the positive net foreign exchange impact of the FDI; this may be done for example, by purchasing US $ or US $ denominated government paper in the country (e.g. Brazil, Mexico), or by hedging off-shore. It is particularly problematic if companies
dramatically increase their hedging of exchange rate risk, at a time when a
devaluation becomes likely; as there may be no-one willing to "take the other side", this may lead to an outflow of foreign exchange, and thus put pressure on the exchange rate. Though the intention is to hedge and not to speculate, the impact on reserves and the exchange rate may be the same. Reportedly, this trend has been a major one in recent years, especially in Latin America and has contributed to significantly deepen pressures on devaluation. A source of concern is that such hedging takes place both with fixed and floating exchange rate regimes.
The mechanisms through which such hedging by foreign direct investors takes place can be problematic in several ways (see Dodd, 2001). A common instrument for such hedging are foreign exchange forwards and swaps. Such transactions involve both a short and long position. Ideally, a dealer in such transactions faces markets with participants willing to buy and sell in equal amounts. However, often in developing countries (for example, when expectations of devaluation increase), dealers in such foreign exchange derivatives face a one-sided or imbalanced market in which most
3
participants wish to be short the local currency. This may make it difficult or expensive for dealers to lay-off their long positions by selling short to others in the derivatives markets. As a result, either the forward exchange rate must deteriorate sufficiently to compensate the dealer and other risk takers for holding greater amounts of the long positions or s/he must find other means to manage risk.
One such method used in imbalanced markets is for dealers to create a synthetic short forward or swap contract through the use of the local and foreign credit markets. To do this, the dealer borrows in the local currency credit market, uses the loan to buy foreign currency spot and then lends it abroad, ideally matching the maturity for all three transactions. In the process of creating the synthetic short forward position in order to make a market in foreign exchange derivatives, the dealer has generated a capital outflow by borrowing at home and lending abroad. Thus, in the context of imbalanced markets, with more participants willing to hold short, rather than long positions at certain rates, hedging can generate capital outflows. Thus, should the foreign direct investor hedge the full value of the invested principal, then the hedging process can temporarily neutralise or net-out the capital inflow.
3. Bank lending: water flows upwards
In sharp contrast to FDI, whose levels has remained high since the East Asian crises, net international bank lending to developing countries has not only collapsed but become highly negative during the 1997- 2001 period (see Table 7) as well as
previous Tables. (See also BIS Quarterly Review, June 2002, which shows continued decline of lending to emerging markets through 2002).
Table 7: International banks' involvement with developing countries
June 1998 Dec 2000 %change
(US $ BN) (US $ BN) (at annual rate)
All developing countries
Loans outstanding 924 739 - 8.8
Other assets* 110 155 14.7
Loans by subsidiaries in local
currency 248 435 25.2
*Includes holding of debt securities, some derivative positions and equities. Source: Hawkins (2001) and BIS data
The decline was across the board as relates to all developing country regions, but far deeper in crisis-hit East Asian economies. As shown in Table 1 above, low- income countries suffered a particularly dramatic reversal of bank lending. The main reason is banks' greater perception of the risks of lending to developing countries, especially to Asia. The main reason for the increased perception of - and aversion to - risk in international lending for developing countries comes from the frequency and large scale of recent crises. In interviews, bankers argue that currency mismatch is too
dangerous for both lenders and borrowers, given recent experience in crises. A secondary reason is that (once recession or lower growth hit countries), their demand for international loans fell. Another reason fo r the decline in international bank lending seems to be lower demand for international financing, as sovereigns and companies in emerging markets see domestic financing as safer.
As Kumar and Persaud (2001) argue persuasively for investors, it seems also to be true for bank lenders that at any point in time their appetite for risk is in one of two states: risk loving or risk averse. As emphasised in our introduction, this leads to an endogeneity of risk in low- income and developing countries, stemming from the decisions of developed country investors and lenders. Recent experience, and particularly the losses made in Russia and on developing country corporates4
(especially in the East Asian crises countries), has contributed to bankers' aversion to developing country risk. This is occurring in a context where banks have become more generally risk sensitive and therefore more reluctant to assume risk. This is related to greater emphasis on shareholder value, which forces banks to reassess the balance of their activities against the criterion of rate of return, and not the volume of business. This pressure on shareholder value is being further encouraged by the growing importance of, and competition from, capital markets. Increasingly banks behave more like portfolio investors, and use similar instruments such as credit risk derivatives. Furthermore, an increasing trend amongst banks to use VAR models not only increase risk sensitivity but also according to some analysts, contribute to herding and pro-cyclicality.
A second, positive major change is that the average maturity of bank loans has increased. Thus, for all developing countries, the ratio of short-term to total debt fell from 54% in 1996 to 46.5% in 2000; the decline was particularly sharp for East Asia and the Pacific, where according to Work Bank data, it fell during the period from 1996 to 2000. One reason for this change is that borrowers have, as a result of the painful experiences of sudden loss of bank credit during recent crises, become reluctant to depend excessively on short term loans. Indeed, reportedly5 several countries have adopted specific guidelines aimed at restricting short-term borrowing by banks and lengthening debt maturities. Some banks interviewed, argued that they would like to increase their short-term exposure, especially to large banks (which they consider safe), but there is insufficient country demand.
In the case of low- income countries, especially in Sub-Saharan Africa, banks have traditionally concentrated on short term lending, typically related to trade finance, and have - on the whole - avoided medium term international bank lending. Their
reluctance to make such medium term loans to poor countries has increased, even if the country itself has improved its fundame ntal and structural features. However, some banks expressed interest in making small loans to SSA low- income countries, particularly if these are related to the payment business or if there is a package, which involves World Bank/export credit agencies loans or guarantees, and where the private bank lends a fairly small proportion, e.g. 25%. Banks continue to lend to creditworthy low- income countries like India and China.
4
Interview material 5
A third major recent change (see again Table 2), related to the previous ones, is that international banks have been significantly increasing lending via domestic
subsidiaries in local currency. This is made possible by the dramatic increase in foreign ownership by international banks of bank subsidiaries in developing countries, that is, banks “crossing the border.”6 Greater foreign ownership of banks is partly also a result of recent crises; these crises have significantly reduced the entry costs for foreign banks, not only through currency devaluations, but because crises led to an erosion of net worth of banks.7 From the perspective of international banks, lending through subsidiaries has the advantage of allowing better quality control from lending officers located in specific emerging economies. However, the main advantages for the bank is avoiding a currency mismatch, and thus exchange rate risk.
These loans are funded locally via deposits in domestic currency. Though some bankers argue that local currency lending by foreign subsidiaries could potentially be complementary to international bank lending,8 recent trends suggest the opposite, that is a substitution effect. Indeed, several bankers argue that there is a large
redistribution of banks' overall emerging markets portfolios, in which banks have substituted onshore for offshore lending. From the perspective of developing countries, this may have some advantages, e.g. of stronger and more efficient banks, as well as some smaller vulnerability to crises. For example, in a recent study of private capital flows to Africa, Leape (1999) argues that the presence of foreign-owned banks can facilitate the transfer of skills in risk management and credit analysis and of good regulatory practice, and increase the quality of loans, as increased competition improves credit decisions and reduces margins. All of these factors can reduce vulnerability to crisis and, more generally, increase the resilience of financial systems.9
However, “crossing the border” also has costs and other disadvantages. The cost, which can be very significant, is a smaller capital inflow to the developing country (with a one-off purchase via FDI of banks replacing a far larger stream of
international bank lending). The potential disadvantages are that domestic lending by international bank subsidiaries may have certain biases not suited for developing countries. For example, in comparison with the domestic banks which they have replaced by purchasing them, they may be more focussed on lending mainly to large companies, and less oriented to lending to SMEs, which generate a high proportion of employment in developing countries. Furthermore, they may attach more priority to consumer lending (e.g. credit cards), especially to middle and high- income persons, and less priority to lending to companies, especially for long term investment. Given the need in development countries for higher and more efficient investment, this may be very problematic.10 Indeed, Leape (1999) finds that foreign banks in Africa have tended to focus primarily on profitable niche markets in high value consumer and corporate business, thereby undermining the profitability of the indigenous banking sector. In addition, experience in Africa has shown that foreign banks can also increase the vulnerability to crisis – as happened when the collapse of BCCI and of Meridian Banks triggered broader crises of confidence in the financial sectors in
6
Lubin, 2001 7
Lubin, op. cit.
8
Interview material 9
Leape (1999), pp. 145-6 10
several countries.11 The effects on development in different categories of developing countries, of these new trends - increased bank foreign ownership, and of bank lending “crossing the border” - needs further careful empirical research.
While “crossing the border” has thus been an important factor in Africa, the same has not been true in China and India, where foreign ownership in the financial sector continues to be subject to stringent controls. In both cases, the incentives to liberalise foreign ownership have been much weaker. In addition to the historical resistance in both countries to foreign ownership, it is likely that the absence of regional integration as a policy objective and the relative lack of vulnerability to financial crisis have also played a role. Looking forward, however, it is likely that the incentives to facilitate foreign ownership in the financial sector will increase over time, and “crossing the border” may well become an important phenomenon in the coming years. A question that will then arise is to what extent the availability of domestic finance from
international banks will slow the pace not only of international bank lending but also of foreign direct investment flows into China.12
There is another somewhat related change, which is banks' increase in fee-based activities (such as supporting bond issuance), which reflects banks aspirations for high returns, without adding assets to their balance sheet (which require more capital); it also reflects greater unwillingness to taking risks on their own balance sheets.
To conclude, the major reversal of international bank lending in the years following the Asian crisis clearly has a temporary element, largely linked to the memory of recent crises and reinforced more recently by the slowdown in the world economy and its' negative effects on developing countries' prospects. If crises stop occurring, the memory of them fades and the world economy recovers, this temporary element could be reversed.
However, more structural - and therefore more permanent - elements seem to play a significant role in the decline of international bank lending to developing countries. The main one seems to be inc reased ownership by international banks of subsidiaries in developing countries, which allows them to "cross the border" in their lending, with loans in local currency. Though such local currency lending could be complemented by international lending, the re may be a strong incentive for banks not to do so on a significant scale, especially given increasing emphasis on risk sensitivity and the relatively high level of exchange rate risk in international lending to developing countries.
4. Portfolio Flows
a. Equity Flows
Portfolio equity flows to developing countries, which had grown significantly between 1990-1997, fell after the East Asian crisis, though the decline was far less dramatic than that of bank lending; flows then grew briefly especially to Asia, before starting to fall again;13 furthermore, equity flows have become increasingly
11
Leape, op. cit.., p. 146. 12
We thank David Lubin for a useful discussion of these issues. 13
Source: IMF International Capital Markets. 2001. IIF Capital Flows to Emerging Market Economies. Sept 2001
concentrated in very few developing countries, practically all of which are middle-income. Thus, in 2000, according to the World Bank Global Development Finance 2001, just four countries - Brazil, China, Mexico and Turkey - accounted for around 85% of all equity flows to developing countries. Of these four, only one, China, is low- income. Furthermore, the volatility of equity flows remains an issue. As the World Bank, points out, in three of the recent crises - Mexico, East Asia and Russia, mutual funds (which represent some of the most significant equity investors in emerging markets) withdrew large sums of money.14
Recent trends in portfolio equity flows to developing countries are in sharp contrast with global cross-border equity portfolio flows which have increased dramatically; indeed, according to Persaud (2001), those have risen fivefold from $268 billion in 1995 to an estimated $1.100 billion in 2000. Thus developing countries have a far lower percentage of global equity flows than in the mid 1990's.
The process of allocation of investors' funds to invest in equity - globally and in developing countries - is quite complex, particularly as it involves different actors. We will very briefly outline it here, as this helps analyse recent changes. Institutional investors - such as pension funds and insurance companies - as well as retail investors (wealthy individuals) and charities, are major actors in investment globally. In the case of pension funds, the ultimate responsibility for allocating funds falls on their trustees. However, particularly in the US and the UK, trustees rely on the advice of consultants, who advise on how - given the structure of their liabilities - they should broadly allocate their assets. Once the broad allocative decisions are taken, one or several fund managers are chosen. These fund managers may have global, regional or country mandates; they may specialise in bonds and/or equities. In the case of
investment in developing countries, these may be a small part of a global fund, they may take the form of specialised funds for all emerging markets, they may be regional ones (e.g. for Latin America, for the Far East, Sub-Saharan Africa or Eastern Europe), or there may even be country funds.
One of the more important trends detected,15 is that since the mid 1990's there has been a sharp reduction of so called dedicated investors: this refers both to emerging market country funds, which have practically disappeared, and a decline in regional emerging market funds. This latter trend seems particularly clear for Sub-Saharan Africa funds. A far higher proportion of equity flows going to emerging markets therefore is via so called "cross-over investors," that is those originating from global funds, where a very small proportion of their portfolios goes to emerging markets. This trend is problematic, because dedicated investors tend to have a more long-term commitment than cross-over investors, and therefo re have lower rotation and
volatility.16
As regards an explanation of the evolution of equity flows to developing countries; the nineties was described by one fund manager17 as "a history of two halves." In the first half of the nineties, there was great optimism about the prospect for emerging
14
Global Development Finance 2001. See also Griffith-Jones (2001), for a review of the evidence on the role of mutual funds in the East Asian crisis.
15
Interview material 16
Interview material and IMF International Capital Markets, op cit. 17
markets, with the expectation that higher returns would compensate for higher risks, and with the perception that emerging markets offered an interesting opportunity for portfolio diversification due to their low correlation with developed economies. As a result equity flows to EMs grew systematically.
The optimism even extended to Sub-Saharan Africa, which was called then "the last frontier of emerging markets."18 However, even then, the lack of liquid secondary markets for African securities remained a major obstacle. Indeed, even South Africa, looked to by many as a potential Pan-African secondary securities market, has suffered from poor liquidity.
However, since the East Asian and other crises, this optimism has declined, and so have the equity flows. The main reasons given are that in the second half of the 1990's, volatility in emerging markets was very high, returns were not only very low, (and on occasions negative), but also lower than in the developed markets, and finally - as these stock markets become more integrated into global financial markets - correlation between emerging and developed markets increased; thus the gains from diversification declined. As a result, the promise that emerging markets would offer a higher economic growth and as a result, high returns and no correlation to compensate for higher risk was not fulfilled; and the risks were certainly seen as high, as one crisis in emerging markets followed another with alarming speed.
There seems to be particularly little interest in investing in low- income countries in Sub-Saharan Africa, as overall disappointment with EMs was reflected in perceptions of low- income countries, even though they themselves did not have currency crises. One reason given for the unwillingness to invest in Sub-Saharan Africa was lack of sufficient and sufficiently regular data. Fund managers and traders argue that to take a risk, they need to understand it, which in their context means to quantify it. It is, however, unclear to what extent improvement in data (though clearly a necessary condition), would be a sufficient one.19 Amongst the additional pre-conditions highlighted for equity flows to grow to SSA was mainly sustained growth; as second order factors, improved corporate governance and better rule of law was emphasised (see also discussion below in section III).
There emerged also an additional, more structural factor that inhibited equity flows. This relates to the fact that - from the point of view of portfolio investors -
there are not "sufficient" large companies left to invest in. Many of the most attractive, large and profitable companies (e.g. telecoms, energy and others) have already been sold to foreign direct investors; this is particularly the case in Latin America. As a result, there is no room for portfolio investors. The remaining companies are seen as relatively too small.
Finally, at the time of writing, there was an important cyclical (and thus hopefully temporary) element in portfolio equity flows. This relates to projected low-growth in developing countries, linked to slow world growth and to the uncertainty following the September 11 events. Several fund managers expressed the view that once growth
18
For a more detailed discussion, see Bhinda, Griffith-Jones, Leape and Martin, Private Capital Flows to Africa, Fondad, The Hague, 1999.
19