FY2014-15 Colorado Skills for Jobs Report Page 1
L
EGISLATIVE
R
EPORT ON
THE
S
KILLS FOR
J
OBS
A
CT
J
ANUARY2015
1560 Broadway, Suite 1600Denver, Colorado 80204(303) 866-2723
FY2014-15 Colorado Skills for Jobs Report Page 2 Contents Executive Summary ... 4 Introduction ... 4 National Trends ... 6
Colorado’s Supply and Demand for Educated and Trained Workers ... 6
Colorado’s Top Jobs: Supply and Demand ... 11
Occupational Demand by Credential Level ... 17
Mid-level ... 17
Bachelor’s and Graduate Level ... 18
Two and Four Year Public Institution Profiles ... 19
Recommendations ... 23
References ... 27
Appendix A: Colorado’s Top Jobs List ... 28
Appendix B: Technical Information ... 33
Calculations ... 33
Limitations ... 33
Estimates for Potential Gap Occupations ... 35
FY2014-15 Colorado Skills for Jobs Report Page 3
This report was prepared by the Colorado Department of Higher Education (DHE) pursuant to the requirements of §23-1-130 Colorado Revised Statutes.
For more information please contact:
Dr. Lauren Victor, Talent Development Research and Policy Analyst with the Colorado Department of Higher Education and Colorado Workforce Development Council, at 303-866-2363 or by email at [email protected]
FY2014-15 Colorado Skills for Jobs Report Page 4
Executive Summary
In accordance with 23-1-130 C.R.S., the Skills for Jobs report was prepared by the Colorado Department of Higher Education. This report explores the state’s anticipated workforce needs and the number of postsecondary credentials that are being issued, identifying any workforce needs that may not be met by education and training programs.
Colorado has a highly educated workforce and experts project that more jobs will continue to demand some level of postsecondary education (Carnevale, Smith & Strohl, 2013). The state unemployment rate is also lower for people who have a postsecondary credential than for those who have a high school degree or less.
In 2013, public institutions in Colorado awarded 52,715 certificates and degrees, a 6.0 percent increase from the year prior. Over five years, postsecondary completions have seen an average annual growth rate of 5.8 percent. Looking at completion figures from both public and private postsecondary institutions, if the number of credentials awarded continues to increase, we are on a trajectory to meet the CCHE
Master Plan targets for awards granted in Colorado.
In alignment with the Talent Pipeline report, we have isolated a selection of jobs with high projected growth rates and openings, while offering a sustainable living wage. While not exhaustive of occupations that offer opportunities for Coloradans, it provides a glimpse into promising industries in our state overall and can help guide our efforts in developing our state’s workforce talent in various sectors. Jobs on this list are concentrated in construction/extraction, healthcare, finance and information technology (IT) occupation clusters. See complete list in Appendix A. While not exhaustive of all skills gaps, when analyzing related completions to average annual openings by occupation group, data show that we are potentially not meeting job openings for a number of skilled trades, mid-level and bachelor’s level IT, bachelor’s level finance, and graduate/professional level healthcare positions.
Recommendations include continuing efforts to,
Use and improve state data sets and data alignment across agencies so as to better understand aggregate trends and use data to address policy questions;
Develop effective career pathways, prioritizing a focus on fields in high demand and offer good employment opportunities for Coloradans;
Closely examine and address supply-demand relationships in areas such as healthcare, IT and skilled trades;
Build strong industry-institution partnerships;
Find ways to increase postsecondary success for our fastest growing demographic groups; and
Provide students and families with the tools and knowledge to make informed educational decisions.
FY2014-15 Colorado Skills for Jobs Report Page 5
As Colorado continues to grow and evolve, it is important for our state to have a nuanced understanding of economic and educational forces, and to be able to develop the educational and training opportunities that meet the needs of individual workers and the demands of the economy. In light of the Great Recession, the increasing cost of postsecondary education for the consumer, and a decade of wage stagnation for the majority of workers, the public and policy makers alike want to make informed decisions regarding the roles of postsecondary training and education in their lives and communities. While this report relies on recent postsecondary education and workforce patterns, it also ties in labor market projections to estimate where we may or may not be meeting industry demand for educated and trained workers. In turn, we hope this report sheds light as to where our anticipated high demand and high growth fields are, and whether credentials are being awarded that align with the economic needs of our state.
Pursuant to statute (23-1-130 C.R.S.), the Colorado Department of Higher Education (DHE) is required to submit a report concerning the state workforce need projections and credential production. In fulfillment of this requirement, this report identifies trends in the state’s anticipated workforce needs and the number of degrees, certificates, and other credentials that have been or are expected to be produced. This report will be submitted to the Education Committees of the Senate and House of Representatives, the Economic and Business Development Committee of the House of Representatives, the Business, Labor, and Technology Committee of the Senate, and the Governor. Additionally, it will be sent to every public postsecondary governing board and be made available through the Department of Education to the state’s public, private, and charter schools and districts, as well as be publicly available on the DHE website.
This report covers the following:
Outlines national trends regarding postsecondary education and workforce needs, alongside Colorado-specific facts and figures;
Assesses the state’s anticipated workforce needs and the number of degrees, certificates, and other credentials that institutions issue; and
Identifies workforce needs, at the macro level, which may or may not be met through postsecondary educational offerings in Colorado.
Certainly, a report such as this has its limitations in scope. While we do orient this report as a statewide analysis, we recognize that unique regional trends exist. As part of our state’s efforts to provide relevant information to interested stakeholders, we would like to recognize two other informational tools that are also available on related topics. The Colorado Workforce Development Council, in collaboration with the Colorado Department of Higher Education, the Colorado Department of Labor and Employment, the Colorado Department of Education, the Office of Economic Development and International Trade, the Office of State Planning and Budgeting and the State Demography Office at the Department of Local Affairs, recently released
FY2014-15 Colorado Skills for Jobs Report Page 6
website, which provides the public with median earnings trends in Colorado for postsecondary completers one, five and ten years following graduation.
National Trends
In recent years there has been a nationwide surge of research, reports and media attention surrounding postsecondary education and employment, as both the educational and economic landscapes of our country have shifted considerably in recent history. Nationwide, it has been projected that by 2020, 65 percent of all jobs will require postsecondary education (Carnevale, Smith & Strohl, 2013). Colorado’s projected workforce requirements even exceed the national average with 74 percent of all jobs requiring some level of postsecondary education/training by 2020. By these numbers, Colorado ranks third nationally in terms of our anticipated postsecondary training needs (Carnevale et al., 2013).
The national and Colorado-based conversations on workforce readiness and fulfilling employers’ workforce needs have begun to shift perspectives on long held assumptions and biases toward different kinds of postsecondary education, and the alignment of pathways to supporting the success of youth and adults alike. According to research from Georgetown University’s Center on Education and the Workforce on nationwide trends, when the projected postsecondary credential requirements for jobs in 2020 are more specifically defined, 36 percent of jobs will demand a baccalaureate degree or higher (or 42 percent of jobs in Colorado), while 30 percent will require a lesser degree of postsecondary training akin to an associate’s degree or certificate award (or 32 percent for Colorado) (Carnevale et al., 2013).
Ultimately, at the individual and state level, we all benefit from a well-educated workforce. Education supports an individual’s employability and economic security. That individual can then afford to engage in the local economy through purchasing goods and services and paying taxes. Furthermore, during economic downturns, those with lower levels of educational attainment experience the most significant declines in employment and greater wage deterioration (Grusky, Red Bird, Rodrigues & Wimer, 2013), indicating one such way that a postsecondary education can often serve as an economic shield.
Colorado’s Supply and Demand for Educated and Trained Workers
Colorado’s economy is one of the strongest in the nation, with an unemployment rate of 4.0 percent as of December 2014 (Colorado Department of Labor and Employment, 2015). The last time the state’s unemployment rate was this low was October 2007. Data show that unemployment rates are lower for people with a postsecondary credential as compared to those without any postsecondary educational experience (Current Population Survey, 2014). Unemployment in 2014 in Colorado hovers at 4.4 percent for people with some college or an associate’s degree and at 3.1 percent for
FY2014-15 Colorado Skills for Jobs Report Page 7
an adult with a bachelor’s degree or higher—lower than the unemployment rate for high school graduates (4.7 percent) and for those with less than a high school education (8.9 percent). Average earnings continue to be higher for those with higher levels of education (U.S. Census Bureau, 2013).
Table 1: Colorado Unemployment and Earnings by Education Level
Educational Attainment Unemployment Rate Median Earnings ($) Less than high school graduate 8.9% 21,624 High School graduate 4.7% 30,011 Some college or associate's degree 4.4% 33,594
Bachelor's degree 3.1% 46,891
Graduate or professional degree 61,730
Source: U.S. Census Bureau, 2013 American Community Survey, 1-year estimates; Current Population Survey, 2014
In addition, Colorado has a workforce with one of the highest proportions of non-routine analytical and interpersonal skills—that is, skills such as critical thinking, social perceptiveness and creativity that are engaged in by educated and highly adept workers. Economies with high proportions of workers who typically use high-level analytical and interpersonal skills are positioned for better performance in the present and future as technologies evolve (Colorado Office of State Planning and
Budgeting, 2014). Maintaining a high share of workers with these types of non-routine
skills will help sustain Colorado’s economic performance.
Overall, Colorado has a highly educated population relative to the rest of the nation, with 68 percent of adults having some college experience or a postsecondary credential and nearly 46 percent holding an associate’s degree or higher (Figure 1), yet we also have an economy that demands a highly educated workforce. Experts project that by 2020, 74 percent of jobs in Colorado will require some level of postsecondary education or training (Carnevale et al., 2013) (see Table 2). The Colorado Department of Higher Education has also been targeting a 66 percent postsecondary certificate or degree attainment level for Coloradans ages 25 to 34 by 2025 (for more information, see the Colorado Commission on Higher Education Master
FY2014-15 Colorado Skills for Jobs Report Page 8
Figure 1: Colorado Educational Attainment, Adults 25 Years and Older
Source: U.S. Census Bureau; 2011-2013 American Community Survey, 3-year estimates
Table 2: Georgetown Projected Annual Job Openings Distribution by Education Level in Colorado
Education Level Required for Occupation
Percentage Distribution of
Job Openings Annual Avg. Openings
Less than HS 7% 6,700
HS Degree 20% 20,100
Some College/No Degree 23% 22,600
Associate's Degree 9% 8,400
Bachelor's Degree 29% 28,200
Master's or better 13% 12,400
Source: Carnevale et al., 2013
While Colorado’s adult population overall has a high educational attainment level, there are significant disparities in educational attainment levels by race/ethnicity. Exemplifying this gap is the difference in educational attainment for our Hispanic and non-Hispanic white population in Colorado: 19 percent of Hispanic adults have a college degree whereas 52 percent of non-Hispanic white adults have a degree (U.S. Census Bureau, 2013). By 2040, the non-white share of our primary working adult population (ages 25 to 64) is projected to be 43 percent (in 2010 it was 26 percent) (State Demography Office, 2013). Thus our state’s diversifying racial/ethnic composition will also mean more layers of support will likely be needed for students, especially those from underserved populations who tend to have lower educational attainment rates, in order to achieve higher levels of academic success. These factors may impact the long-term sustainability of our educated workforce, and thus the development of our state economy.
One variable that complicates analysis of a state’s workforce supply are interstate migration patterns. On average, three-quarters of Colorado residents graduating from a public postsecondary institution are found in our workforce within the year
Less than high school 9.6% High school graduate 22.0% Some college, no degree 22.8% Associate's degree 8.3% Bachelor's degree 23.6% Graduate or professional degree 13.7%
FY2014-15 Colorado Skills for Jobs Report Page 9
following graduation. However, entry into our state’s workforce varies based on residency status, program major and degree level. Some graduates will continue their education and delay entry into the workforce, some will pursue opportunities out-of-state, some will leave and then return to the state for employment years later. Typically, people with higher levels of education tend to have higher levels of geographic mobility, so while we may lose a portion of our educated Coloradans to out-of-state opportunities, our state still attracts a large share of highly educated people. While we have consistently been able to attract qualified talent from outside of Colorado, we must also anticipate an increase in interstate and global competition for these workers as older skilled workers continue to retire in large numbers. See the
Talent Pipeline Report for additional analysis of related demographic information.
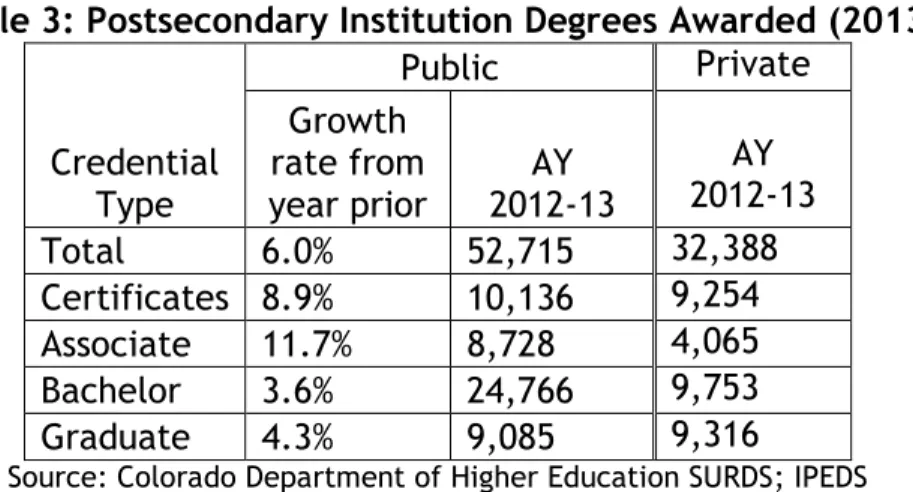
Our country’s current rate of producing college-educated workers increases by one percent annually; in order to meet projected demand, experts deem that our country must increase this rate to 2.6 percent annually (Carnevale & Rose, 2011). In 2013, public institutions in Colorado awarded 52,715 certificates and degrees, a 6.0 percent increase from the year prior. Maintaining this trajectory will help us meet our state’s educational attainment goals.
Table 3: Postsecondary Institution Degrees Awarded (2013)
Credential Type Public Private Growth rate from year prior 2012-13 AY AY 2012-13 Total 6.0% 52,715 32,388 Certificates 8.9% 10,136 9,254 Associate 11.7% 8,728 4,065 Bachelor 3.6% 24,766 9,753 Graduate 4.3% 9,085 9,316
Source: Colorado Department of Higher Education SURDS; IPEDS
As more jobs are expected to require higher levels of education in the years to come, analysts estimate that Colorado will need to increase postsecondary credential production by about two percent or about 1,000 additional degrees/credentials annually. Per the CCHE Master Plan degree and certificate production goals for both public and private postsecondary institution awards combined, we are on track to meet those goals as long as we continue to increase completions. This will require us to continue to provide services that support student and worker access to and success with educational and training opportunities.
Colorado is working to ensure we are training Coloradans for the jobs of today and tomorrow through the development of industry-led career pathways. A career pathway is a series of connected education and training programs, work experiences and student support services that enable individuals to secure a job or advance in an industry or occupation. The vehicle for creating such pathways is sector partnerships—
FY2014-15 Colorado Skills for Jobs Report Page 10
regional, industry-led partnerships of private and public partners, in a specific region, for a specific industry. The goal of sector partnerships is for private and public partners to coordinate and collaborate around the opportunities and requirements for the industry to grow in their region. Active sector partnerships have the ability to help drive the development of career pathways with education partners, so as to better meet their workforce needs.
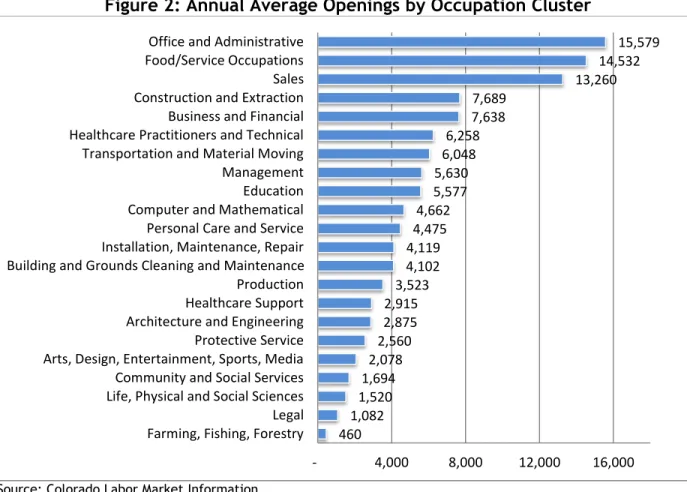
Despite potential challenges we may face in terms of future degree production, we do have one of the most highly educated workforces in the country, and an economy that continues to attract an educated workforce and motivates many to acquire additional education. As we increase our credential production, it is also important to look beneath the surface of degree levels awarded and examine the structural nuances of our degrees and credentials earned to assess if we have any gaps in certain areas of training. Colorado’s ten year labor market projections estimate just over 118,000 average annual openings due to replacement of workers and economic growth; Figure 2 depicts where annual openings are dispersed by occupation group. In the following sections we provide additional analysis related to high growth occupations and credential completions alongside projected openings for occupation groups. A complete list of occupation groups can be found here.
Figure 2: Annual Average Openings by Occupation Cluster
Source: Colorado Labor Market Information
460 1,082 1,520 1,694 2,078 2,560 2,875 2,915 3,523 4,102 4,119 4,475 4,662 5,577 5,630 6,048 6,258 7,638 7,689 13,260 14,532 15,579
Farming, Fishing, Forestry Legal Life, Physical and Social Sciences Community and Social Services Arts, Design, Entertainment, Sports, Media Protective Service Architecture and Engineering Healthcare Support Production Building and Grounds Cleaning and Maintenance Installation, Maintenance, Repair Personal Care and Service Computer and Mathematical Education Management Transportation and Material Moving Healthcare Practitioners and Technical Business and Financial Construction and Extraction Sales Food/Service Occupations Office and Administrative
FY2014-15 Colorado Skills for Jobs Report Page 11
Colorado’s Top Jobs: Supply and Demand
This report uses labor market data from Colorado’s Office of Labor Market Information to identify jobs that meet three criteria: projected high openings, above average growth rates and typically offering a living wage for the average family size. This is not an exhaustive list of occupations that offer opportunities for Coloradans; rather, it offers a glimpse into some promising industries in our state overall and can thereby help guide our efforts in developing our state’s workforce talent in various sectors. One such approach is through the use of sector strategies, which are being implemented and are emerging in use across the state. A sector partnership is an industry-specific regional partnership led by business in partnership with economic development, education and workforce development. Through sector partnerships, the development of career pathways is a natural progression. A career pathway is a series of connected education and training programs, work experiences and student support services that enable individuals to secure a job or advance in an industry or occupation.
Many occupations that do not exist today may be in high demand in the near future, so we look to this list to provide us with a sense of fields where we can anticipate burgeoning opportunity. We’ve delineated the occupations by typical education requirements for entry. The first table shows mid-level occupations that are classified as requiring some college, an associate’s degree or extensive postsecondary training for employment; the second table shows occupations that typically require a bachelor’s or graduate degree for employment. The complete list of top jobs can be found in Appendix A.
This table includes related completions (per 2013 Integrated Postsecondary Education Data System data) alongside projected annual openings by occupation, when available, as some occupations do not have specific educational/training pathways or some completion types are not recorded in the IPEDS data set (such as some apprenticeships or industry certificates). Completion figures do not account for completers who may already be participating in the workforce or new or emerging industries/occupations that one cannot account for. While regional differences do exist, for the purposes of this report we focus on a statewide perspective. In instances where completions may appear to lag or match average openings, further examination of a potential supply-demand gap is recommended to better understand talent development strategies that should be implemented.
Based on current Colorado labor market data, occupations on this list are highly concentrated in construction and extraction, healthcare, business and finance, and information technology (Figure 5). Eighty-one percent of job openings on this list are for occupations that typically require some level of postsecondary education for entry, whether it is an apprenticeship or college credential.
FY2014-15 Colorado Skills for Jobs Report Page 12
Figure 3: Share of Openings in Top Jobs List by Occupation Cluster
For the purposes of this report, we expanded our definition of STEM occupations beyond that of the more limited occupation codes for computer, math, engineering and science professionals to align with the Brookings Institution definition, which is based on actual skill levels in the areas of science, technology/computers, engineering and/or mathematics as typically required to perform an occupation.1 Fifty-five percent of the jobs on this list are considered STEM per the Brookings Institution definition of STEM occupations. STEM jobs that are represented on this list are highly concentrated in IT, healthcare and finance occupations (Figure 6).
1
Brookings has conducted analysis of all occupations using O*NET skills scores, and has defined STEM occupations as those that require above average skill/knowledge levels in science, technology, engineering and/or mathematics areas. This definition thus includes not only occupations in the science, computer, math and
engineering job clusters, but includes jobs in other fields such as healthcare, skilled trades and finance occupations. Management, 12% Business/Finance, 14% IT, 13% Architecture/Engineering, 5% Life/Physical/Social Sciences, 2% Community/Social Services, 3% Legal, 3% Education, 1% Arts/Media/Design, 1% Healthcare, 15% Building/Grounds Cleaning and Maintenance, 1% Sales, 4% Office/Administrative Support, 1% Construction/Extraction, 16% Installation/Maintenance/ Repair, 3% Production, 0% Transportation/Material Moving, 5%
FY2014-15 Colorado Skills for Jobs Report Page 13
Figure 4: Top Jobs: Number of Annual STEM Job Openings by Occupation Cluster
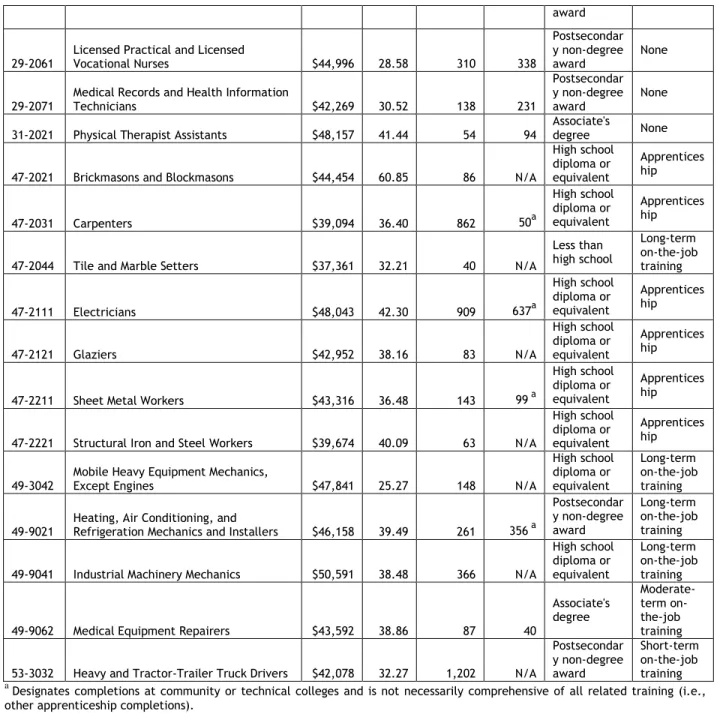
Table 4: Mid-Level Top Jobs
Oc cu pat io n Cod e Oc cu pat io n M ed ia n A nn ua l W ag e Tot al P erc en t Ch an ge Tot al A nn ual A ve ra ge Op en in gs Re la te d Com pl et ion s (20 13 ) En try Ed uca tio n Le ve l Trai nin g Le ve l
13-1022 Wholesale and Retail Buyers, Except Farm Products $44,321 24.36 93 N/A
High school diploma or equivalent Long-term on-the-job training
15-1134 Web Developers $64,572 37.32 195 * Associate's degree None
17-3012 Electrical and Electronics Drafters $59,951 35.70 40 * Associate's degree None
19-4031 Chemical Technicians $43,559 33.02 43 N/A
Associate's degree Moderate-term on-the-job training
19-4041 Geological and Petroleum Technicians $56,455 52.49 54 4
Associate's degree Moderate-term on-the-job training 19-4091 Environmental Science and Protection Technicians, Including Health $45,191 39.42 88 94 Associate's degree None 23-2011 Paralegals and Legal Assistants $50,513 32.85 269 243 Associate's degree None 27-4011 Audio and Video Equipment Technicians $47,188 26.77 57 22
Postsecondar y non-degree award Short-term on-the-job training
29-1126 Respiratory Therapists $57,112 32.08 77 91 Associate's degree None
29-1141 Registered Nurses $68,083 30.79 2,172 2,447 Associate's degree None
29-2021 Dental Hygienists $80,793 29.74 224 94 Associate's degree None
29-2032 Diagnostic Medical Sonographers $75,912 56.39 58 25 Associate's degree None 29-2034 Radiologic Technologists and Technicians $57,932 29.92 137 263 Associate's degree None 29-2055 Surgical Technologists $49,551 39.85 85 90 Postsecondary non-degree None
152 259 306 662 862 950 1516 1551 3069 3629 4066 0 500 1,000 1,500 2,000 2,500 3,000 3,500 4,000 4,500 Building/Grounds Cleaning and Maintenance
Transportation/Material Moving Education Life/Physical/Social Sciences Installation/Maintenance/Repair Management Architecture/Engineering Construction/Extraction Business/Finance Healthcare IT STEM openings
FY2014-15 Colorado Skills for Jobs Report Page 14
award
29-2061 Licensed Practical and Licensed Vocational Nurses $44,996 28.58 310 338
Postsecondar y non-degree
award None
29-2071 Medical Records and Health Information Technicians $42,269 30.52 138 231
Postsecondar y non-degree
award None
31-2021 Physical Therapist Assistants $48,157 41.44 54 94 Associate's degree None
47-2021 Brickmasons and Blockmasons $44,454 60.85 86 N/A
High school diploma or equivalent Apprentices hip 47-2031 Carpenters $39,094 36.40 862 50a High school diploma or equivalent Apprentices hip
47-2044 Tile and Marble Setters $37,361 32.21 40 N/A
Less than high school Long-term on-the-job training 47-2111 Electricians $48,043 42.30 909 637a High school diploma or equivalent Apprentices hip 47-2121 Glaziers $42,952 38.16 83 N/A High school diploma or equivalent Apprentices hip
47-2211 Sheet Metal Workers $43,316 36.48 143 99 a
High school diploma or equivalent
Apprentices hip
47-2221 Structural Iron and Steel Workers $39,674 40.09 63 N/A
High school diploma or equivalent
Apprentices hip
49-3042 Mobile Heavy Equipment Mechanics, Except Engines $47,841 25.27 148 N/A
High school diploma or equivalent Long-term on-the-job training 49-9021 Heating, Air Conditioning, and Refrigeration Mechanics and Installers $46,158 39.49 261 356 a
Postsecondar y non-degree award Long-term on-the-job training
49-9041 Industrial Machinery Mechanics $50,591 38.48 366 N/A
High school diploma or equivalent Long-term on-the-job training
49-9062 Medical Equipment Repairers $43,592 38.86 87 40
Associate's degree Moderate-term on-the-job training 53-3032 Heavy and Tractor-Trailer Truck Drivers $42,078 32.27 1,202
N/A Postsecondar y non-degree award Short-term on-the-job training a
Designates completions at community or technical colleges and is not necessarily comprehensive of all related training (i.e., other apprenticeship completions).
* Indicates an inadequate number of shared completions across multiple occupations
(N/A) Indicates specific programs do not crosswalk to this SOC, it is difficult to ascertain which completers would enter this occupation, or there are no related programs at an institution.
Table 5: Bachelor’s and Graduate Degree Level Top Jobs
Oc cu pat io n Cod e Oc cu pat io n M ed ia n A nn ua l W ag e Tot al P erc en t Ch an ge Tot al A nn ual A ve ra ge Op en in gs Re la te d Com pl et ion s (20 13 ) En try Ed uca tio n Le ve l Trai nin g Le ve l
11-1021 General and Operations Managers $100,444 26.79 1,906 N/A Bachelor's degree None
11-2021 Marketing Managers $128,515 25.96 123 N/A Bachelor's degree None
FY2014-15 Colorado Skills for Jobs Report Page 15
11-3031 Financial Managers $127,375 28.20 270 N/A Bachelor's degree None
11-3121 Human Resources Managers $117,739 35.06 89 N/A Bachelor's degree None
11-9021 Construction Managers $85,377 27.26 413 N/A
Bachelor's degree Moder ate-term on- the-job trainin g 11-9031 Education Administrators, Preschool and Childcare Center/Program $44,133 29.64 42 N/A Bachelor's degree None 11-9033 Education Administrators, Postsecondary $78,874 24.21 122 N/A Master's degree None 11-9111 Medical and Health Services Managers $98,109 31.84 219 N/A Bachelor's degree None 11-9151 Social and Community Service Managers $65,387 25.18 71 N/A Bachelor's degree None
13-1051 Cost Estimators $58,343 42.61 403 N/A Bachelor's degree None
13-1081 Logisticians $71,851 46.83 158 N/A Bachelor's degree None
13-1111 Management Analysts $75,025 36.31 575 N/A Bachelor's degree None
13-1121 Meeting, Convention, and Event Planners $41,492 39.36 167 N/A Bachelor's degree None 13-1151 Training and Development Specialists $59,984 29.36 243 N/A Bachelor's degree None
13-2011 Accountants and Auditors $65,393 30.04 2,116 * Bachelor's degree None
13-2041 Credit Analysts $59,466 32.92 74 * Bachelor's degree None
13-2051 Financial Analysts $73,125 30.69 233 * Bachelor's degree None
13-2052 Personal Financial Advisors $70,637 27.74 159 * Bachelor's degree None
15-1121 Computer Systems Analysts $84,779 39.31 623 * Bachelor's degree None
15-1122 Information Security Analysts $83,140 59.29 116 * Bachelor's degree None
15-1132 Software Developers, Applications $92,975 36.61 1,118 * Bachelor's degree None 15-1133 Software Developers, Systems Software $100,404 40.93 611 * Bachelor's degree None
15-1141 Database Administrators $93,541 29.18 123 * Bachelor's degree None
15-1142 Network and Computer Systems Administrators $77,122 25.51 435 * Bachelor's degree None
15-1143 Computer Network Architects $98,215 24.79 157 * Bachelor's degree None
15-2031 Operations Research Analysts $85,644 42.89 52 165 Bachelor's degree None
17-1011 Architects, Except Landscape and Naval $70,192 32.78 183 N/A
Bachelor's degree Interns hip/re sidenc y 17-1012 Landscape Architects $69,456 26.19 47 52 Bachelor's degree Interns hip/re sidenc y
17-1022 Surveyors $58,866 25.72 52 N/A Bachelor's degree None
17-2051 Civil Engineers $79,854 32.56 386 475 Bachelor's degree None
17-2061 Computer Hardware Engineers $101,896 28.68 203 82 Bachelor's degree None
17-2071 Electrical Engineers $87,000 26.85 183 186 Bachelor's degree None
FY2014-15 Colorado Skills for Jobs Report Page 16
17-2171 Petroleum Engineers $130,961 73.49 172 150 Bachelor's degree None
19-2021 Atmospheric and Space Scientists $92,484 31.55 103 56 Bachelor's degree None 19-2041 Environmental Scientists and Specialists, Including Health $73,586 29.22 183 150 Bachelor's degree None 19-2042 Geoscientists, Except Hydrologists and Geographers $100,296 43.65 191 220 Bachelor's degree None
21-1014 Mental Health Counselors $40,048 32.17 209 N/A
Master's degree
Interns hip/re sidenc y 21-1021 Child, Family, and School Social Workers $42,026 24.72 268 538 Bachelor's degree None
21-1022 Healthcare Social Workers $50,401 33.73 119 N/A Master's degree None
21-1023 Mental Health and Substance Abuse Social Workers $39,620 28.36 95 N/A Bachelor's degree None
21-1091 Health Educators $52,694 29.67 43 N/A Bachelor's degree None
23-1011 Lawyers $115,367 24.61 649 523
Doctoral or professional
degree None
25-1071
Health Specialties Teachers,
Postsecondary $107,224 47.36 253 N/A
Doctoral or professional degree
None
25-1072 Nursing Instructors and Teachers, Postsecondary $59,817 46.68 53 N/A
Doctoral or professional
degree None
25-1121 Art, Drama, and Music Teachers, Postsecondary $51,939 25.05 81 N/A
Doctoral or professional
degree None
27-1025 Interior Designers $44,127 30.19 85 165 Bachelor's degree None
27-3042 Technical Writers $65,659 28.46 88 N/A
Bachelor's degree Short-term on- the-job trainin g
27-3091 Interpreters and Translators $47,642 69.75 122 N/A
Bachelor's degree Short-term on- the-job trainin g
29-1031 Dietitians and Nutritionists $54,622 30.40 47
235 Bachelor's degree Interns hip/re sidenc y 29-1051 Pharmacists $119,883 27.52 226 246 Doctoral or professional degree None 29-1067 Surgeons $187,369 24.12 53 * Doctoral or professional degree Interns hip/re sidenc y
29-1071 Physician Assistants $89,379 42.09 126 72 Master's degree None
29-1122 Occupational Therapists $76,746 33.64 129 34 Master's degree None
29-1123 Physical Therapists $72,824 40.19 313 225
Doctoral or professional
degree None
29-1129 Therapists, All Other $58,984 29.35 54 N/A Bachelor's degree None
FY2014-15 Colorado Skills for Jobs Report Page 17
156 professional degree
29-1171 Nurse Practitioners $95,250 37.75 124 91 Master's degree None
29-9011 Occupational Health and Safety Specialists $73,914 26.64 71 N/A
Bachelor's degree Short-term on- the-job trainin g
53-2011 Airline Pilots, Copilots, and Flight Engineers $106,168 37.45 182 77
Bachelor's degree Moder ate-term on- the-job trainin g * Indicates an inadequate number of shared completions across multiple occupations
(N/A) Indicates specific programs do not crosswalk to this SOC, it is difficult to ascertain which completers would enter this occupation or there are no related programs at an institution.
Occupational Demand by Credential Level
This section presents an overview of where potential gaps exist in certain occupation areas by credential level based on a snapshot of current completion levels alongside current projected openings. Projections of job openings are certainly not a guarantee that such demand will arise, but we are using them in this report to help guide our attention in prioritizing further exploration of various fields. Here we examine projected openings for occupation clusters as defined by Standard Occupational Codes (SOC) by level of postsecondary education. We use three education levels: mid-level
(e.g., certificates, associate’s degrees), bachelor’s level and graduate level. Limitations to this analysis are outlined in Appendix B, along with additional information and data tables.
Mid-level
Mid-level completions correspond to jobs that typically require more than a high school education, but less than a bachelor’s degree (such as associate’s degrees or certificates and credentials acquired at community and technical colleges). Fields with notable gaps are consistent with last year’s findings. While there may be unique discrepancies in supply and demand at individual occupation levels, there appear to be inadequate completions for computer-related occupations (e.g., computer user support specialists, web developers), 2 various skilled trades (e.g., industrial machinery mechanics) and science technicians (e.g., geological and petroleum technicians), in particular.
2 For IT occupations, additional analysis of specific technical skills that are in high demand by industry is also important. Some coding languages are currently seen in job postings at higher rates than others, and these languages change, as well.
FY2014-15 Colorado Skills for Jobs Report Page 18
Per the Brookings Institution definition of STEM occupations, all of the computer-related and 97 percent of science technician openings are for STEM jobs. For job openings in the construction/extraction, and installation, maintenance and repair occupation groups, STEM job openings hover around 50 percent of jobs in these categories. Three percent of jobs included in the mid-level transportation and material moving jobs are defined as STEM.
Production occupations (such as plant operators and machinists) have particularly
high aged workforces, so it is important to train the next generation of skilled workers. In September 2012, the U.S. Department of Labor awarded a $25 million grant to a consortium of Colorado community colleges to develop advanced manufacturing programs; in addition, HB 13-1165 was passed in 2013, authorizing the creation of Manufacturing Career Pathways. There are currently five active manufacturing sector partnerships and statewide organizations, such as Manufacturer’s Edge and the Colorado Advanced Manufacturing Alliance, that are collaborating around a variety of resources to build out regional and statewide career pathways.
Bachelor’s and Graduate Level
At the baccalaureate and graduate level there are a number of occupation groups that showed potential insufficient completions to related industry demand. Because the highly educated workforce is quite mobile, many of these graduates have the option to pursue opportunities in other states. Consistent with last year’s findings, data show we are likely not producing enough graduates trained to enter financial occupations (e.g., accountants, financial analysts), computer-related occupations (e.g., programmers, computer systems analysts) or healthcare occupations (e.g., physicians, occupational therapists). Certain areas of specialization for K-12 educators (e.g., math, special education) continue to be in high demand and rural districts continue to report challenges in retaining a teaching workforce; the Colorado Department of Education and DHE have targeted initiatives in place to develop a stronger educator pipeline to the rural areas in the state.
While data show that overall engineering degree completions meet projected job openings, engineers in particular are often recruited out-of-state, and this may impact how many graduates we are able to retain in-state. Occupation groups that we may risk maintaining current graduate-level educational attainment levels of workers include financial and IT workers. Of additional note, many of these occupation areas— such as finance, engineering, architecture and skilled healthcare practitioners—are occupation clusters that tend to be more skewed to older age workers. This is important to consider as we plan and implement talent development strategies, especially as we continue to gain distance from the last recession, and as baby boomers continue to retire.
Examination of potential deficits in completions for the graduate/professional level group of healthcare practitioners is complicated by the fact that many of these jobs
FY2014-15 Colorado Skills for Jobs Report Page 19
could require upwards of ten years of schooling, and the healthcare industry will continue to evolve in staffing structures as practices and technology change. However, there are also many variables that impact these completion figures for physicians in particular, such as the limited number of residency positions nationwide and current funding structures. This is then compounded by the impending baby boomer population that will face increasing healthcare needs, as well as by that of the potential increase in practitioner demand as a result of more insured patients under the Affordable Care Act. Colorado is currently participating in a National Governor’s Association policy academy to support mechanisms for the more targeted development of our state’s healthcare workforce, and there are nine active or emerging healthcare sector partnerships and most have identified workforce as a critical issue on which to focus.
Per the Brookings definition of STEM occupations, the majority of job openings in these occupation groups (finance, IT, healthcare, air transportation) with potential supply-demand gaps are considered STEM occupations. Eighty-six percent of bachelor’s level finance occupations and 87 percent of graduate level healthcare occupations are defined as STEM. All bachelor’s level computer-related and air transportation occupations are defined as STEM. While national conversation circles around low representation of females employed in computer science occupations, women also complete related computer and information technology degrees at far lower numbers than men. Of the 2013 computer/IT degrees awarded, 18 percent were earned by females; relatedly, 26 percent of workers in a computer-related STEM occupation are female. Similar gender ratios can be found for completions for aviation programs (15 percent female graduates).
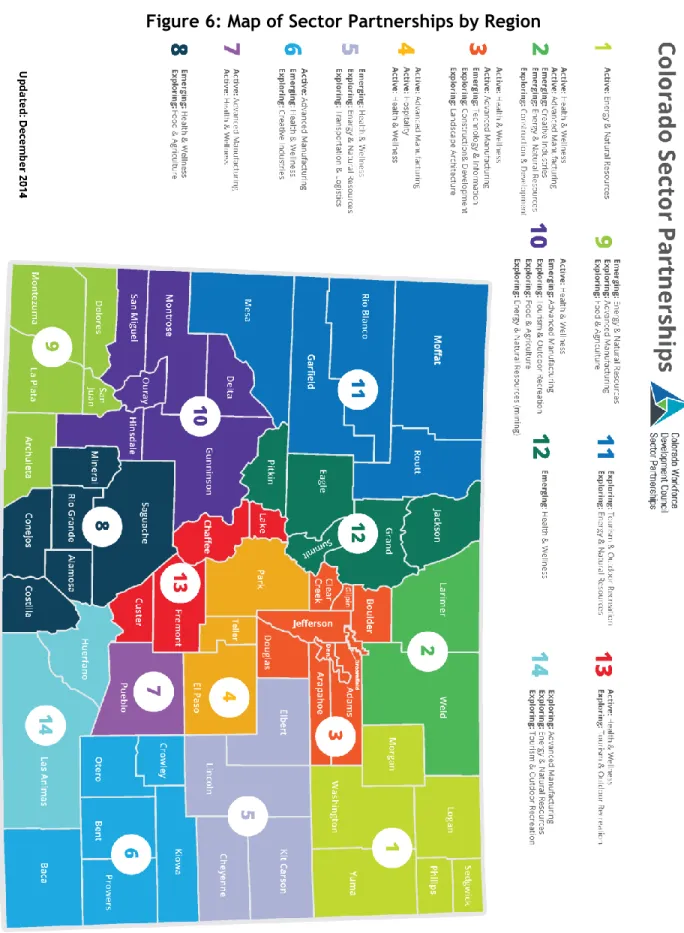
Two and Four Year Public Institution Profiles
Per additional evaluation as proposed by the Colorado Commission on Higher Education Master Plan, this report also includes the roles and missions, locations and service areas of public colleges and universities. Colorado is a state with diverse regions and regional economies and, as such, many Colorado state agencies use a common planning and management regional guideline, dividing the state into 14 regions. The first map below (Figure 7) orients us to main and satellite campus locations of two and four year institutions overlaying Colorado’s planning and management regions. The second map (Figure 8) shows sector partnerships by region, demonstrating where current and emerging industries exist across our state. Alongside supply-demand analysis, these maps provide a reference for potential institution-industry partnerships by regional need. Appendix C includes a table outlining each institution’s location, role and mission. While of course there is inter-regional activity, whether it be economic, educational or otherwise, all of our regions have one or more public postsecondary institutions that can play a role in serving region-specific demands. Seven regions have both community college and four year institution campuses (regions 2, 3, 4, 7, 8, 9, 11), one region has only a four year
FY2014-15 Colorado Skills for Jobs Report Page 20
institution (region 10) and five regions have only main and/or satellite community college campuses (regions 1, 5, 6, 12, 13, 14).
FY2014-15 Colorado Skills for Jobs Report Page 21
Figure 5: Map of Colorado Public Colleges and Universities and Regional Designations
FY2014-15 Colorado Skills for Jobs Report Page 22
FY2014-15 Colorado Skills for Jobs Report Page 23
Recommendations
The state of Colorado has an interest and commitment to educating its residents for meaningful and instrumental roles in its burgeoning economy. While this report looks toward the future and, based on current data and information, makes inferences regarding prospects for Colorado, there is certainly room for a change of course in this fast evolving world. We conclude this report with various recommendations of issues and concerns that should be in our line of sight as we participate in, design and develop our state’s economies and educational networks.
In considering means to implement these recommendations it is important to consider the work Colorado has done over the last four years toward alignment of education, workforce development and economic development to meet industry needs. According to Executive Order B2010-012, the Colorado Workforce Development Council (CWDC) is responsible for ensuring effective alignment of workforce development, education and economic development initiatives related to talent development for Colorado's businesses.
The Colorado Blueprint laid the foundation for an aggressive economic development plan for the State of Colorado, including Core Objective V, Educate and Train the Workforce of the Future, which is led by the Colorado Workforce Development Council (CWDC), the state’s Workforce Investment Board. This is a collaborative approach of many partners including (but not limited to) CDHE, Colorado Department of Education, Colorado Department of Labor & Employment, Colorado Department of Human Services, Colorado Department of Corrections, Colorado Community College System and Career & Technical Education, and the Office of Economic Development and International Trade, as well as local and regional partners of each of these state agencies. Through this structure, CWDC is convening leaders and subject matter experts to develop aligned solutions, leverage resources and utilize data and industry input to ensure effective outcomes.
Analysis should be based on state-level or regional data rather than national-level data when available
Coloradans, in general, are better educated than people from other states, but that does not mean we are better prepared to meet our specific workforce needs. The job openings that need to be filled in Colorado both now and in the next decade are more likely to require postsecondary credentials than in most other states. We must focus on Colorado-specific data or we are at risk of failing to plan adequately, potentially producing an excess of graduates with certain skills and a shortage of graduates with much needed skills.
FY2014-15 Colorado Skills for Jobs Report Page 24
Strengthen data sharing relationships between Colorado’s Department of Labor and Employment, Department of Education and Department of Higher Education
Each of the Colorado Departments, Labor and Employment, Education and Higher Education, gather and store vast quantities of data that would facilitate greater planning and coordination among institutions and employers so that workforce needs will be met and graduates will have full employment opportunities. Current information may need to be supplemented, however, with more detail about specific regional market needs and important distinctions within broad occupation categories. These agencies have been and continue to work toward connecting K-12, postsecondary education and labor data to better understand aggregate trends and address policy questions and measure effectiveness of initiatives.
Develop effective career pathways
While we are producing postsecondary graduates, we still are not graduating enough in certain program areas that meet the demands of our state’s economy. Research has shown that countries with higher levels of educational attainment offer diverse pathways, as well as connect employers to the educational process to prepare students for certain careers (Symonds, Schwartz & Ferguson, 2011). Our state does have various industry-led career pathways in place and is planning to formally implement more. It is important to highlight the significance of this work and the essential continued support of it if we are to educate Coloradans and support their success in our state. As our state develops various career pathway tracks, we should bear in mind that places for entry and re-entry can be helpful for those who initially enter a field at a lower educational level and later desire to obtain additional credentials to enhance career opportunities (such as, one may have an accounting technician credential, but eventually pursues a bachelor’s degree in finance/business, or a licensed vocational/practical nurse completed a one or two year program initially, but eventually pursues a registered nursing degree, etc.).
In addition to the creation of specific career paths in demand by industry, focus should be put on the current effort of state and local partners that are working to create a statewide tapestry of career pathways including all high demand occupations and opportunities for all Coloradans. This statewide Career Pathway System is currently receiving technical assistance from the U.S. Department of Adult and Vocational Education and has potential for integrating the various career paths, as well as the work of all education and workforce development partners.
Continue to closely examine and address the supply-demand relationships in high growth/high demand areas such as healthcare, IT, skilled trades and finance
This report has highlighted various areas where there may be gaps in the supply of graduates that correlate with specific occupations or occupation clusters. Various types of healthcare practitioners, IT professionals, financial specialists and skilled
FY2014-15 Colorado Skills for Jobs Report Page 25
trades workers have appeared in both the list of jobs with projected high growth rates and openings, as well as in general fields with potential supply-demand gaps.
Currently, Colorado has five active healthcare sector partnerships, five active manufacturing sector partnerships and additional emerging partnerships in progress. For instance, existing sector partnerships (industry-specific regional partnerships) are addressing the supply-demand relationship and acute healthcare workforce shortages in the state. The Greater Metro Denver Healthcare Partnership serves as a pilot for the creation of Career Pathway templates in building out a statewide Career Pathway System. An overview of this strategic alliance can be found here:
http://www.youtube.com/user/DenHealthPartnership
Continue to build strong industry-institution partnerships
When we look globally to best practices in cultivating an educated workforce that fulfill economic demand, strong industry-institution partnerships and earn-and-learn models continue to stand out as effective strategies for many kinds of career pathways. Often, we think of these models as connected to the skilled trades, and as we develop additional programs in advanced manufacturing, we should be aware of educational models that encourage completion rates and smooth transitions into employment. It is worthwhile to look towards innovative and adaptable business concepts that are particularly oriented towards real world skills that specific employers and fields want.
Colorado is recognized nationally as a leader in bringing industry together with education, workforce development and economic development to address these issues. Colorado’s Sector Strategies, which support regional Sector Partnerships (see map on page 22), integrate the work of economic development and the needs of industry with education and workforce partners and efforts. The resulting outcomes are comprehensive career pathways that include all levels of education, training, applied learning, connections to work experience opportunities and placement in jobs.
Find ways to increase postsecondary success for Colorado’s fastest growing demographic groups
As Colorado faces an increasing demand for well-educated and credentialed graduates of postsecondary institutions to meet the workforce demands of the future, it also faces a rapidly changing demographic in its K-12 primary and secondary pipeline. An increasing percentage of those students are members of minority groups and face other risk factors, such as being low-income and coming from families where they will be the first to pursue higher education. In the past, those groups have not found postsecondary success at the same rate as their white peers. Colorado will not meet the workforce needs of the future unless it can improve the rate at which members of those underserved groups graduate from high school are ready to enroll in college-level classes, enroll in and persist through certificate or degree completion, and enter
FY2014-15 Colorado Skills for Jobs Report Page 26
the workforce. For that to happen, Colorado must be prepared to invest resources not only into high quality academic programs, but also toward financial aid, controlling college costs so as to maintain reasonable tuition and fees and providing academic support systems to help students successfully complete their chosen programs of study.
Provide students and families with the tools and knowledge to make informed decisions
It is crucial to provide students and their families with the tools and information to support them through their decision-making processes regarding postsecondary education. By providing accessible information regarding completion rates, the job market, unemployment rates and the like to interested stakeholders, there is the opportunity for completions and economic demands to better align. Ultimately, if we can help students and jobseekers know where opportunities likely exist, then we can help them spend their education dollars wisely.
Conclusion
Overall, whether or not we are “meeting the numbers” is less of an issue than whether our institutions are able to maintain the momentum to provide a high quality education for all students. It is critical that our colleges and universities across Colorado focus on delivering high-quality graduates so that Colorado employers continue to respect and seek out the credentials of Colorado-educated graduates. Further developing partnerships between Colorado’s postsecondary institutions and Colorado’s employers is critical to the advancement of our state’s economy.
FY2014-15 Colorado Skills for Jobs Report Page 27
References
Berger, N. and Fisher, P. (2013). A well-educated workforce is key to state
prosperity. Washington, D.C.: Economic Analysis and Research Network. Retrieved
from http://www.epi.org/publication/states-education-productivity-growth-foundations/
Carnevale, A. P., Jayasundera, T. and Cheah, B. (2012). The college advantage:
Weathering the economic storm. Washington D.C.: Center on Education and the
Workforce, Georgetown University. Retrieved from http://cew.georgetown.edu/collegeadvantage/
Carnevale, A. P., and Rose, S. J. (2011). The undereducated American. Washington, D.C.: Center on Education and the Workforce, Georgetown University. Retrieved from http://cew.georgetown.edu/undereducated/
Carnevale, A. P., Smith, N. and Strohl, J. (2013). Recovery: Job growth and
education requirements through 2020. Washington, D.C.: Center on Education and
the Workforce, Georgetown University. Retrieved from http://cew.georgetown.edu/recovery2020/
Colorado Office of State Planning and Budgeting. (September 2014). The Colorado
economic outlook.
Grusky, D. B., Red Bird, B., Rodriguez, N. and Wimer, C. (2013). How much protection does a college degree afford? The impact of the recession on recent
college graduates. Washington, D.C.: The Pew Charitable Trusts. Retrieved from
http://www.pewstates.org/uploadedFiles/PCS_Assets/2013/Pew_college_grads_reces sion_report.pdf
Science, Technology, Engineering, and Mathematics Education: Assessing the
relationship between education and the workforce. GAO-14-374. Washington, D.C.:
May, 2014.
Symonds, W. C., Schwartz, R. and Ferguson, R. F. (2011). Pathways to prosperity:
Meeting the challenge of preparing young Americans for the 21st century.
Cambridge, MA: Pathways to Prosperity Project, Harvard University Graduate School of Education.
FY2014-15 Colorado Skills for Jobs Report Page 28
Appendix A: Colorado’s Top Jobs List
O cc up at io n Code O cc up at io n Media n A nnua l Wa ge T ot al Pe rc ent Chang e 2013 -2 02 3 T ot al A nnua l A vera ge O penings R ela ted Com plet io ns (2 01 3) Entry Educa ti on Lev el A dd it io na l T ra ini ng Lev el
11-1021 General and Operations Managers $100,444 26.79 1,906 N/A Bachelor's degree None
11-2021 Marketing Managers $128,515 25.96 123 N/A Bachelor's degree None
11-3021 Computer and Information Systems Managers $132,917 28.13 267 N/A Bachelor's degree None
11-3031 Financial Managers $127,375 28.2 270 N/A Bachelor's degree None
11-3121 Human Resources Managers $117,739 35.06 89 N/A Bachelor's degree None
11-9021 Construction Managers $85,377 27.26 413 N/A Bachelor's degree
Moderate-term on-the-job training 11-9031 Education Administrators, Preschool and Childcare Center/Program $44,133 29.64 42 N/A Bachelor's degree None 11-9033 Education Administrators, Postsecondary $78,874 24.21 122 N/A Master's degree None 11-9111 Medical and Health Services Managers $98,109 31.84 219 N/A Bachelor's degree None 11-9141 Property, Real Estate, and Community Association Managers $67,334 30.07 177 N/A High school diploma or
equivalent None
11-9151 Social and Community Service Managers $65,387 25.18 71 N/A Bachelor's degree None 13-1022 Wholesale and Retail Buyers, Except Farm Products $44,321 24.36 93 N/A High school diploma or
equivalent
Long-term on-the-job training
13-1051 Cost Estimators $58,343 42.61 403 N/A Bachelor's degree None
13-1081 Logisticians $71,851 46.83 158 N/A Bachelor's degree None
13-1111 Management Analysts $75,025 36.31 575 N/A Bachelor's degree None
13-1121 Meeting, Convention, and Event Planners $41,492 39.36 167 N/A Bachelor's degree None 13-1151 Training and Development Specialists $59,984 29.36 243 N/A Bachelor's degree None
13-2011 Accountants and Auditors $65,393 30.04 2,116 * Bachelor's degree None
13-2041 Credit Analysts $59,466 32.92 74 * Bachelor's degree None
13-2051 Financial Analysts $73,125 30.69 233 * Bachelor's degree None
13-2052 Personal Financial Advisors $70,637 27.74 159 * Bachelor's degree None
13-2082 Tax Preparers $44,913 24.59 93 * High school diploma or
equivalent
Moderate-term on-the-job training
15-1121 Computer Systems Analysts $84,779 39.31 623 * Bachelor's degree None
15-1122 Information Security Analysts $83,140 59.29 116 * Bachelor's degree None 15-1132 Software Developers, Applications $92,975 36.61 1,118 * Bachelor's degree None 15-1133 Software Developers, Systems Software $100,404 40.93 611 * Bachelor's degree None
15-1134 Web Developers $64,572 37.32 195 * Associate's degree None
15-1141 Database Administrators $93,541 29.18 123 * Bachelor's degree None
FY2014-15 Colorado Skills for Jobs Report Page 29
Administrators
15-1143 Computer Network Architects $98,215 24.79 157 * Bachelor's degree None
15-1151 Computer User Support Specialists $50,782 33.79 636 * Some college, no degree
Moderate-term on-the-job training 15-2031 Operations Research Analysts $85,644 42.89 52 165 Bachelor's degree None 17-1011 Architects, Except Landscape and Naval $70,192 32.78 183 N/A Bachelor's degree Internship/residency 17-1012 Landscape Architects $69,456 26.19 47 52 Bachelor's degree Internship/residency
17-1022 Surveyors $58,866 25.72 52 7 Bachelor's degree None
17-2051 Civil Engineers $79,854 32.56 386 475 Bachelor's degree None
17-2061 Computer Hardware Engineers $101,896 28.68 203 82 Bachelor's degree None
17-2071 Electrical Engineers $87,000 26.85 183 186 Bachelor's degree None
17-2081 Environmental Engineers $81,100 40.95 172 118 Bachelor's degree None
17-2171 Petroleum Engineers $130,961 73.49 172 150 Bachelor's degree None
17-3012 Electrical and Electronics Drafters $59,951 35.7 40 * Associate's degree None 17-3031 Surveying and Mapping Technicians $48,888 28.9 78 85 High school diploma or
equivalent
Moderate-term on-the-job training 19-2021 Atmospheric and Space Scientists $92,484 31.55 103 56 Bachelor's degree None 19-2041 Environmental Scientists and Specialists, Including Health $73,586 29.22 183 150 Bachelor's degree None 19-2042 Geoscientists, Except Hydrologists and Geographers $100,296 43.65 191 220 Bachelor's degree None
19-4031 Chemical Technicians $43,559 33.02 43 N/A Associate's degree
Moderate-term on-the-job training 19-4041 Geological and Petroleum Technicians $56,455 52.49 54 4 Associate's degree
Moderate-term on-the-job training 19-4091 Environmental Science and Protection Technicians, Including Health $45,191 39.42 88 94 Associate's degree None 21-1011 Substance Abuse and Behavioral Disorder Counselors $39,094 32.95 85 N/A High school diploma or
equivalent
Moderate-term on-the-job training 21-1014 Mental Health Counselors $40,048 32.17 209 N/A Master's degree Internship/residency 21-1021 Child, Family, and School Social Workers $42,026 24.72 268 538 Bachelor's degree None
21-1022 Healthcare Social Workers $50,401 33.73 119 N/A Master's degree None
21-1023 Mental Health and Substance Abuse Social Workers $39,620 28.36 95 N/A Bachelor's degree None
21-1091 Health Educators $52,694 29.67 43 N/A Bachelor's degree None
23-1011 Lawyers $115,367 24.61 649 523 Doctoral or professional
degree None
23-2011 Paralegals and Legal Assistants $50,513 32.85 269 243 Associate's degree None 25-1071 Health Specialties Teachers, Postsecondary $107,224 47.36 253 N/A Doctoral or professional
degree None
25-1072 Nursing Instructors and Teachers, Postsecondary $59,817 46.68 53 N/A Doctoral or professional
FY2014-15 Colorado Skills for Jobs Report Page 30
25-1121 Art, Drama, and Music Teachers, Postsecondary $51,939 25.05 81 N/A Doctoral or professional
degree None
27-1025 Interior Designers $44,127 30.19 85 165 Bachelor's degree None
27-3042 Technical Writers $65,659 28.46 88 N/A Bachelor's degree Short-term on-the-job training 27-3091 Interpreters and Translators $47,642 69.75 122 N/A Bachelor's degree Short-term on-the-job
training 27-4011 Audio and Video Equipment Technicians $47,188 26.77 57 22 Postsecondary non-degree award Short-term on-the-job
training 29-1031 Dietitians and Nutritionists $54,622 30.4 47 235 Bachelor's degree Internship/residency
29-1051 Pharmacists $119,883 27.52 226 246 Doctoral or professional
degree None
29-1067 Surgeons $187,369 24.12 53 * Doctoral or professional
degree
Internship/ residency
29-1071 Physician Assistants $89,379 42.09 126 72 Master's degree None
29-1122 Occupational Therapists $76,746 33.64 129 34 Master's degree None
29-1123 Physical Therapists $72,824 40.19 313 225 Doctoral or professional
degree None
29-1126 Respiratory Therapists $57,112 32.08 77 91 Associate's degree None
29-1129 Therapists, All Other $58,984 29.35 54 N/A Bachelor's degree None
29-1131 Veterinarians $78,124 26.06 127 156 Doctoral or professional
degree None
29-1141 Registered Nurses $68,083 30.79 2,172 2,447 Associate's degree None
29-1171 Nurse Practitioners $95,250 37.75 124 91 Master's degree None
29-2021 Dental Hygienists $80,793 29.74 224 94 Associate's degree None
29-2032 Diagnostic Medical Sonographers $75,912 56.39 58 25 Associate's degree None 29-2034 Radiologic Technologists and Technicians $57,932 29.92 137 263 Associate's degree None 29-2055 Surgical Technologists $49,551 39.85 85 90 Postsecondary non-degree award None 29-2061 Licensed Practical and Licensed Vocational Nurses $44,996 28.58 310 338 Postsecondary non-degree award None 29-2071 Medical Records and Health Information Technicians $42,269 30.52 138 231 Postsecondary non-degree award None 29-2099 Health Technologists and Technicians, All Other $37,305 32.92 98 N/A High school diploma or
equivalent None
29-9011 Occupational Health and Safety Specialists $73,914 26.64 71 N/A Bachelor's degree Short-term on-the-job training 31-2021 Physical Therapist Assistants $48,157 41.44 54 94 Associate's degree None 37-1012 First-Line Supervisors of Landscaping, Lawn Service, and Groundskeeping
Workers $46,593 24.7 152 N/A
High school diploma or
equivalent None
41-3099 Sales Representatives, Services, All Other $50,658 27.71 1,053 N/A High school diploma or equivalent
Short-term on-the-job training 41-9021 Real Estate Brokers $43,942 25.58 111 70 High school diploma or
equivalent None
on-FY2014-15 Colorado Skills for Jobs Report Page 31
equivalent the-job
training 43-5032 Dispatchers, Except Police, Fire, and Ambulance $40,384 26.14 156 N/A High school diploma or
equivalent
Moderate-term on-the-job training 47-1011 First-Line Supervisors of Construction Trades and Extraction Work $63,568 40.99 671 N/A High school diploma or
equivalent None
47-2021 Brickmasons and Blockmasons $44,454 60.85 86 N/A High school diploma or equivalent
Apprentices hip
47-2031 Carpenters $39,094 36.4 862 50a High school diploma or
equivalent
Apprentices hip 47-2044 Tile and Marble Setters $37,361 32.21 40 N/A Less than high school Long-term on-the-job
training 47-2071 Paving, Surfacing, and Tamping Equipment Operators $38,490 37.7 83 13 a High school diploma or
equivalent
Moderate-term on-the-job training 47-2073 Operating Engineers and Other Construction Equipment Operators $42,349 37.72 483 13 a High school diploma or
equivalent
Moderate-term on-the-job training
47-2111 Electricians $48,043 42.3 909 637 a High school diploma or
equivalent
Apprentices hip
47-2121 Glaziers $42,952 38.16 83 N/A High school diploma or
equivalent
Apprentices hip 47-2152 Plumbers, Pipefitters, and Steamfitters $48,049 42.38 483 344 a Less than high
school
Moderate-term on-the-job training
47-2181 Roofers $37,405 29.4 185 N/A Less than high school
Moderate-term on-the-job training 47-2211 Sheet Metal Workers $43,316 36.48 143 99 a High school diploma or
equivalent
Apprentices hip 47-2221 Structural Iron and Steel Workers $39,674 40.09 63 N/A High school diploma or
equivalent
Apprentices hip 47-4099 Construction and Related Workers, All Other $37,276 37.38 48 38 a High school diploma or
equivalent
Moderate-term on-the-job training 47-5011 Derrick Operators, Oil and Gas $49,693 52.18 66 N/A Less than high school Short-term on-the-job
training 47-5012 Rotary Drill Operators, Oil and Gas $55,577 52.04 84 N/A Less than high school
Moderate-term on-the-job training 47-5013 Service Unit Operators, Oil, Gas, and Mining $43,450 56.56 353 N/A Less than high school
Moderate-term on-the-job training 47-5071 Roustabouts, Oil and Gas $37,075 52.95 252 N/A Less than high school
Moderate-term on-the-job training 49-3042 Mobile Heavy Equipment Mechanics, Except Engines $47,841 25.27 148 N/A High school diploma or
equivalent
Long-term on-the-job training