NBER WORKING PAPER SERIES
THE SKILL COMPOSITION OF IMMIGRANTS AND THE GENEROSITY OF THE WELFARE STATE: FREE VS. POLICY-CONTROLLED MIGRATION
Alon Cohen Assaf Razin Working Paper 14459
http://www.nber.org/papers/w14459
NATIONAL BUREAU OF ECONOMIC RESEARCH 1050 Massachusetts Avenue
Cambridge, MA 02138 October 2008
¸˛We would like to thank Karel Mertens and Efraim Sadka for useful comments. The views expressed herein are those of the author(s) and do not necessarily reflect the views of the National Bureau of Economic Research.
NBER working papers are circulated for discussion and comment purposes. They have not been peer-reviewed or been subject to the review by the NBER Board of Directors that accompanies official NBER publications.
© 2008 by Alon Cohen and Assaf Razin. All rights reserved. Short sections of text, not to exceed two paragraphs, may be quoted without explicit permission provided that full credit, including © notice,
The Skill Composition of Immigrants and the Generosity of the Welfare State: Free vs. Policy-Controlled Migration
Alon Cohen and Assaf Razin NBER Working Paper No. 14459 October 2008
JEL No. F15,F2,F22
ABSTRACT
The paper analyzes the effect of the generosity of the welfare state on the skill composition of immigrants. We develop a parsimonious model in which the effect of an increase in the generosity (and taxes) of the welfare state on the skill composition of immigrants under free migration is negative. The reason is that welfare state benefits attract unskilled migrants because they contribute to tax revenues less than what they gain from benefits; and this generosity works to deter skilled immigrants, because they contribute in taxes more than in benefits. In sharp contrast, the effect of an increase in the generosity (and taxes) of the welfare state on the skill composition of migrants is positive if migration is controlled by policy. Being net contributors to the welfare state, skilled migrants can help finance a more generous welfare-state system; thus, they are preferred by the policy maker over unskilled migrants. We take the prediction of the model to cross-sectional data on source-host, OECD-EU country pairs in the year 2000. The identification strategy is to use the decomposition the source-host country pairs into two groups: one group, a "free migration" group, source-host country pairs within the EU, and another group, "policy-controlled migration" group, the pairs from non-EU countries into the EU. We find evidence in support of the predictions of the parsimonious model, that the generosity of the welfare state adversely affects the skill-composition of migrants under free migration; but it exerts a more positive effect under controlled migration, relative to the free migration regime.
Alon Cohen
Eitan Berglas School of Economics
Tel Aviv University, Tel Aviv 69978, Israel [email protected] Assaf Razin Department of Economics Cornell University Uris 422 Ithaca, NY 14853 and NBER [email protected]
is positive if migration is controlled by policy. Being net contribu-tors to the welfare state, skilled migrants can help …nance a more generous welfare-state system; thus, they are preferred by the policy maker over unskilled migrants. We take the prediction of the model to cross-sectional data on source-host, OECD-EU country pairs in the year 2000. The identi…cation strategy is to use the decomposition the source-host country pairs into two groups: one group, a "free migra-tion" group, source-host country pairs within the EU, and another group, "policy-controlled migration" group, the pairs from non-EU countries into the EU. We …nd evidence in support of the predictions of the parsimonious model, that the generosity of the welfare state adversely a¤ects the skill-composition of migrants under free migra-tion; but it exerts a more positive e¤ect under controlled migration, relative to the free migration regime..
1
Introduction
The paper addresses the e¤ect of the generosity of the welfare state on the skill composition of immigrants.
Free migration has been one of the important qualities of the integration of Europe into the European Union. Freedom of movement, and the ability to reside and work anywhere within the EU, are one of the fundamental rights to which member states of the EU are obligated towards each other.1 1Despite the legal provision for the free movement of labor among EU-15 (the old
member countries), the level of cross-border labor mobility is low. Reasons cited for this include the existence of legal and administrative barriers, the lack of familiarity with other European languages, moving costs, ine¢ cient housing markets, the limited portability of
In contrast, labor mobility into the EU members states from non EU states, is still restricted by national policies. This di¤erence in policy regimes across EU and non EU states provides an opportunity to test theory predictions about key di¤erences between free and policy-controlled migration.
The di¤erences in migration policies are also tightly linked to the generos-ity of the welfare state. For example, an impetus for relaxing migration re-strictions by EU member states, towards non-EU countries, is that birth rates dwindle and life expectancy goes on rising. Consequently, EU native born population is both declining and ageing. A declining productive workforce needed to …nance the increased economic burden of the costly welfare-state institutions, puts a downward pressure on output growth. One alternative is to adopt more liberal migration policies, especially towards skilled migrants, solidifying the …nancial soundedness of the welfare state. Unskilled migrants, in contrast, which are usually heavy users of the bene…ts of the welfare state, may put further strains on the welfare state. Therefore, voters in an ageing welfare state may opt for a migration policy which will be more liberal and also upgrade the skill composition of migration.2
pension rights, problems with the international recognition of professional quali…cations and the lack of transparency of job openings. The expansion of the EU to 25 member states in May 2004, was accompanied by concerns over the possibility of a wave of migration – particularly of the low-skilled –from the then ten new member states to the EU-15.
2The Financial Times puts it sucsinctly: "Over the next 10 years Germany faces a
demographic disaster and immigrantion could be part of the solution. As the birth rate dwindles and life expectancy goes on rising, the country’s population is both declining and ageing. Unless this double-whammy is confronted head-on, the economy will collapse under the weight of an expensive welfare state that lacks the productive workforce to …nance it. Something has to be done – and fast – as Germany’s leaders and parts of
We present a parsimonious model which predicts that the generosity of the welfare state serves as a magnet to unskilled migrants, but as a deterrent to skilled migration. Furthermore, voters in relatively more generous welfare states are more likely to opt for migration policies that are more lax towards skilled migration and more tight towards unskilled migration. As a result, countries with more generous welfare systems are expected to have their skill composition of migrants biased towards unskilled migration, relative to coun-tries with less generous welfare systems, if migration is free. The opposite is true when migration is controlled by national policies. Countries with more generous welfare systems are expected to have their skill composition of mi-grants biased towards skilled migration, if its voters can restrict migration, relative to countries with less generous welfare systems.
In this paper we also confront the predictions of our theory with empirical evidence. We consider the generosity of the welfare state as an exogenous variable, and study the e¤ect of this variable on the skill composition of immigration stocks, in the cases of free and controlled migration. The EU provides a unique testing ground for the predictions of our parsimonious model, as there is more or less free migration among EU member states, whereas each EU member decides on whether, and to what extent, to restrict migration from the rest of the world.
We employ cross-sectional data from 14 EU countries and other 12 OECD its economic elite are …nally realising. And now they have come up with a last-ditch plan to avert meltdown: a plan designed to harness the untapped resources of its migrant community, whose youth, ambition and skills Germany needs to keep its economic engine running." (FT June 27, 2008). See also Brucker et al (2001).
countries in the year 2000.3 We form source-host pairs of countries where
only the EU countries (plus Norway and Switzerland) serve as host countries, whereas all the 26 countries in the sample serve as source countries. The iden-ti…cation strategy is a decomposition of the source-host pairs into two groups: a "free-migration" group (source-host pairs within the EU, plus Norway and Switzerland) and a "policy-controlled" group of countries (source-host pairs where the host countries are the same as in the former group, and the source countries are from the remaining (non EU) countries). We assume, plausibly, that this free-restricted migration decomposition, which has its origin in the integration process in Europe that started in the 1950s, could not have as one of its determinants, the eventual stock of the migrants in the EU states, some 50 years later.
The paper is organized as follows. Section 2 develops a parsimonious model of the welfare state and migration, divided into two alternative migration-regimes. In the …rst regime, political-economy equilibrium of migration is de-termined by host country, capturing the interests of the skilled and unskilled workers, as voters; in the second migration regime migration is determined by the choice of potential migrants in the source country. Section 3 discusses empirical evidence from the literature literature, focusing on the interaction between international migration and the welfare state.In section 4 we con-front the parsimonious model’s predictions with international cross section data. Section 5 presents robustness tests, and Section 6 concludes.
3We restrict attention to OECD countries in order to get a relatively homogeneous
2
Parsimonious Model of Migration
Assume a Cobb-Douglas production function, with two labor inputs, skilled and unskilled4:
Y =ALsL1u ; 0< <1 (1) where,Y is the GDP,Adenotes a Hicks-neutral productivity parameter, and Li denotes the input of skilled and unskilled labor i, where i=s; u.
The competitive wages of skilled and unskilled labor are, respectively
ws = Y =Ls (2)
wu = (1 )Y =Lu
Aggregate labor supply, for skilled and unskilled workers, respectively, is given by:
Ls= (s+ )ls (3)
Lu = (1 s+ (1 ) )lu
There is a continuum of workers, where the number of native born is normal-ized to 1; s denotes the share of native born skilled in the total native born labor supply; denotes the share of skilled migrants in the total number of migrants; denotes the total number of migrants; andli is the labor supply
of an individual with skill level i,i=s; u.
Total population (native born and immigrants) is:
N = 1 + (4)
4The parsimonious model is developed with the cross-section data is mind. The
We specify a simple welfare-state system which levies a proportional la-bor income tax of the rate , with the revenues redistributed equally to all residents (native born and migrants alike), as a demogrant, b; per capita. The demogrant captures not only a cash transfer but also outlays on public services such as education, health, etc., that are distributed to all workers, regardless of their contribution to the tax revenues.
The government budget constraint:
N b = Y (5)
The utility function for skill-typei is: ui =ci " 1 +"l 1+" " i (6)
where ci denotes consumption of an individual with skill level i, and " >0.
The individual budget constraint is:
ci =b+ (1 )liwi (7)
Individual utility maximization yields the labor supply equation:
li = (wi(1 ))" (8)
It is then straightforward to calculate the equilibrium wages:
ws =A b" 1 1 1+" (9) wu =A (1 )b" 1 1+" where: b (1 )1 ; 1 s+ (1 ) s+
To guarantee thatws> wu, we assume:
(1 s)
2.1
Policy-Controlled Migration
Assume that the host country faces a perfectly elastic supply of migrants of each one of the two skill types, so that host-country migration policy is the sole determinant of migration ‡ows. The policy is determined by the majority of the voters in the host country .We assume that the policy decisions on the tax rate, ; and the total volume of migration, ; are exogenous. We do this in order to focus the analysis on a single endogenous policy variable, the skill composition of immigrants, : Note that once ; ; are determined, then the demogrant, b, is given by the budget constraint; we thus denote the demogrant b asb( ; ); where the exogenous variable is suppressed.
The indirect utility of an individual with skill leveli is given by:
Vi( ; ) = (11) =b( ; ) + (1 )li( ; )wi( ; ) " 1 +"li( ; ) 1+" "
Di¤erentiating Equation (10), and employing the envelope theorem, yields5:
dVi( ; ) d = db( ; ) d + (1 )li(wi( ; )) dwi( ; ) d (12)
Thus, a change in the share of skilled migrants in the total number of migrants, , a¤ects the utility level through two channels. First, an increase in raises average labor productivity and thereby tax revenues. This, in turn, raises the demogrant, b. Second, an increase in , which raises the supply of skilled labor relative to the supply of unskilled labor depresses the skilled- premium in the labor market, ws wu .
We assume that only the native born is eligible to vote about migration policy, as the new migrants are yet to enter the country after the vote is taken.
If the decisive voter is unskilled, both of the above e¤ects are positive. Thus, an unskilled voter would like to set the skill-composition of migrants at a corner, = 1:
If the decisive voter is skilled, however, the two e¤ects are con‡icting: an increase in raises b but lowersws. Thus the derivative in equation (12) is
equated to zero by the skilled worker at a level of below one. This means that the share of skilled migrants preferred by a skilled voter must be lower than the share of skilled immigrants preferred by an unskilled voter. De…ning
i as the share of skilled immigrants most preferred by an individual with
skill level i in the host country,i=s; u;we get:
s < u = 1
Our goal is to …nd the e¤ect of the change in the generosity of the welfare state on the migration policy concerning . The generosity of the welfare state, captured by the demogrant, b, depends on the tax rate, (as the economy is assumed to be on the "right side" of the La¤er curve). We can readily show that:6
d u d = 0;
d s
d >0 (13)
This means that an exogenous increase in the tax rate, , would leave the skilled-only migration policy unchanged, if the decisive voter is an unskilled worker. It is simply because the unskilled median voter prefers only skilled immigrants regardless of the level of . If, however, the decisive voter is a skilled worker, an exogenous increase in the tax rate, , must change the policy concerning the skill-composition of migrants in the direction toward
a larger share of skilled immigrants. The reason is that when the tax rates rise, the redistribution burden upon a skilled decisive voter is increases, and allowing an additional skilled migrant can ease this …scal burden.
2.2
Free Migration
Assume that no restrictions are placed on migration by the policy makers in the host country. In choosing whether to migrate or not, a potential migrant of skill i compares his prospect utility, Vi, in the migration destination, to
the reservation utility, denoted by ui in the source country. There is a
con-tinuum of would be migrants, di¤erent with respect to the reservation utility level in the source country. This heterogeneity of reservation utilities in the source country stems for di¤erent traits of the potential migrants (e.g., fam-ily size, age, moving costs, forms of portable pensions, housing, cultural ties, etc.). Thus the host country faces an upward sloping supply curve, S(Vi) of
potential migrants from the source country, for each skill level.
Let ms be the number of skilled migrants, and mu is the number of
unskilled migrants. The proportion of skilled migrants, , is uniquely de…ned by: = ms mu 1 + ms mu (14)
The indirect utility function in the host country, no longer dependent on , is rewritten as: Vi( ) =b( ) + 1 1 +"(wi(1 )) 1+" (15)
reservation utilities, us( ) and uu( ):
Vi( ) =ui( ), i=s; u (16)
As the number of migrants of each skill level is determined by the supply of migrants then
#mi( ) =Si(ui( )); i=s; u:
We now turn to …nd the e¤ect of the generosity of the welfare state on the skill mixture of the immigrants. To simplify the analysis we abstract from the general-equilibrium e¤ects of migration rates and labor supplies.7 Hence, an increase in raises the demogrant,b, but lowers the net wage,wi(1 ):For
skill migrants the fall in net wage outweighs the increase in the demogrant. Thus, an increase in reduces the well-being of skill workers. Consequently, an increase in reduces the cut-o¤ reservation utility of skilled migrants, us( ): As a result, those skill migrants with reservation utilities between
the old one the new cuto¤ levels will choose not to migrate. The opposite holds true for unskilled migrants. Thus the generosity of the welfare state under free migration deters skilled migrants and attracts unskilled migrants; thereby tilting the skill composition of migration towards unskilled migrants.
We show in the appendix that: d
d <0 (17)
In sum, an exogenous increase of the tax rate, , deters skilled immigrants and attracts unskilled immigrants. An increase in raises bene…ts and lowers
7The general-equilibrium e¤ects are second-ordere. They do not a¤ect the qualitative
disposable private income. Consequently, among the net contributors to the welfare state, skilled migrants, those with high reservation wage decide not to migrate; among those who are potentially net bene…ciary from the welfare state, the unskilled workers, infra-marginally change their decision in favor of migration.
3
Empirical Evidence on Welfare Migration
The existing literature addresses the issue of how the welfare-state generos-ity works as a magnet to migrants — - the "welfare migration" phenomenon.8
Southwick (1981) shows that high welfare-state bene…t gap, between the ori-gin and destination regions in the U.S., increases the share the welfare-state bene…t recipients among the migrants. Gramlich and Laren (1984) analyze a sample from the 1980 U.S. Census data and …nd that the high bene…t regions have more welfare recipients’migrants than the low-bene…t regions. Using the same data, Blank (1988) employs a multinomial logit model to show that welfare bene…ts have a signi…cant positive e¤ect over the location choice of female-headed households. Similarly, Enchautegui (1997) …nds a positive e¤ect of welfare bene…ts over the migration decision of women with young children. Meyer (2000) employs conditional logit model as well as the comparison-group method to analyze the 1980 and 1990 U.S. Census data. He …nds signi…cant welfare induced migration, particularly for high school dropouts. Borjas (1999), who uses the same data set …nds that low skilled migrants are much more heavily clustered in high bene…t states, in
ison to other migrants or natives. Gelbach (2000) …nds strong evidence of welfare migration in 1980, but less in 1990. McKinnish (2005, 2007) also …nds evidence for welfare migration, especially for those who are located close to state borders (where migration costs are lower). Walker (1994) uses the 1990 US Census data and …nds strong evidence in support of welfare-induced migration. Levine and Zimmerman (1999) who employ data for the period 1979-1992, and estimate a probit model …nd, however, that welfare bene…ts have little e¤ect on the probability of female-headed households (the recipients of the bene…ts) to relocate.
Peridy (2006) studies migration rates in 18 OECD host countries from 67 source countries. He …nds that the host-source ratio of welfare-state bene…ts (as measured by total public spending) has a signi…cant positive e¤ect on mi-gration. De Giorgi and Pellizzari (2006) conduct an empirical investigation of migrants from outside the EU-15. Using the conditional logit approach, they …nd that welfare-state bene…ts do attract migrants. When interacted with the education level, welfare bene…ts show also a positive e¤ect on the proba-bility of the lowest group of education; whereas probabilities of the secondary and tertiary education groups are not signi…cantly a¤ected. 9 Docquier at el. (2006) study the determinants of migration stocks in the OECD countries in the year 2000, where the migrants from 184 countries are classi…ed according
9Welfare-bene…ts, for that matter, are de…ned as monthly bene…t received by a typical
40 years old person who has continuously worked and paid contributions since the age of 18, averaged over 60 months of non-employment, two earning levels relatively to the average production worker and three types of family status. The results are robust to replacing the welfare bene…ts measure with public expenditure on unemployment related bene…ts.
to three education levels.10 They …nd that the social welfare programs
en-courage the migration of both skilled and unskilled migrants. However, the unskilled are motivated by social expenditure much more than the skilled. Thus they claim that the skill composition of migrants is adversely e¤ected by the welfare-state bene…ts.
Recall that our parsimonious model predicts a di¤erential e¤ect on mi-gration and its skill composition, depending on whether mimi-gration is free or policy-controlled. Therefore, in order to obtain unbiased estimates of the generosity of the welfare state on migration (and on its skill composition), one must control for the migration regime (free versus controlled). This means that the studies of migration between states within the U.S. (such as Bor-jas (1999), for example), which are evidently con…ned to a single migration regime (namely, free migration), can produce unbiased results. Other stud-ies that employ samples that are con…ned to the policy-controlled migration regime, but at the same time employ a model of the migrants’choice, whether to migrate or not, and if so where to migrate to, are evidently inconsistent. In this case the estimates convey little information on the migrant choices (and, therefore on the welfare state as a magnet to unskilled migrants). Rather, the samle conveys information on the migration policy choices by the host coun-try. Those studies that refer to both migration regimes, without controlling for them, are not easily interpretable because they convey a mixture of in-formation on migration policies in the host country, and on the individual migrant’s migration choices in the source country.
10The data used in Section 4 is extracted from the same database which is used in
4
Empirical Analysis
4.1
Testable Hypotheses
There are two main predictions of the parsimonious model, which we like to test. First, if migration is free, the generosity of the welfare state has an adverse e¤ect on the skill composition of migrants. A typical skilled migrant is more likely to move to a less generous welfare state; and move to a less generous host country with a lower tax rate rather than to a more generous country with a higher tax rate, other things being equal. Second, in the case that the skill composition of migration is policy-controlled, then the more generous is the welfare state, the more the skill composition of migrants is tilted towards skilled migrants.
As explained before, both results hinge on the redistributive aspects of the welfare state. Under free migration, equilibrium migration re‡ects (among others) the choice of the migrants. Thus, a generous welfare state generating a …scal burden on skilled immigrants, is a deterrent for skilled migration. In the policy-controlled migration regime, however, the interest of the native-born in the host country, as is re‡ected in the voting equilibrium, are at play. Fiscal burden associated with the generosity of the welfare state, which falls on skilled native born, induces this interest group to endorse higher rates of skilled migration. The unskilled native born is in favor of maximum level of skilled migration, both for redistributive reasons and for labor complemen-tarity reasons.11
11In the data, possibly, both e¤ects exist. That is, the skill composition of immigrants
Formally, an increase in the generosity of the welfare state, as captured by the tax rate, , adversely a¤ects the skill composition of migrants, in the free-migration regime, that is ddF <0.
An increase in the generosity of the welfare state has a more pronounced e¤ect on the share of skilled migrants of total migrants when the migration-regime is policy-controlled, that is, d R
d > 0. Denote by
Fand R,
respec-tively, the skill composition of migrants in free migration regime and the policy-controlled regime. Consequently, we expect d R F
d > 0.
4.2
Identi…cation Strategy
To confront the prediction of the parsimonious model with a cross section data of source-host (developed) country pairs, we decompose the sample into two groups. The …rst group contains source-host pairs of countries which enable free mobility of labor among themselves. They also prohibit any kind of discrimination between native born and migrants, regarding labor market accessibility and welfare-state bene…ts eligibility. These are 16 Eu-ropean countries: Austria, Belgium, Denmark, Finland, France, Germany, Greece, Ireland, Italy, Netherlands, Portugal, Spain, Sweden, U.K., Norway and Switzerland. The data for this group, therefore, records bilateral migra-tion stock for any pair of these countries.
well as by the considerations of the immigrant who considers other alternative host coun-tries. Nevertheless, we expect the political economy consideration to be more dominant in restricted migration regimes than in free migration regimes. Similarly, we expect the considerations of the immigrants regarding alternative host countries to be more dominant in free migration regimes than in restricted ones.
The second group includes source-host pairs of countries, within which the source country residents cannot necessarily move freely into either of the host country without any restriction. The host countries are the same 16 countries from the …rst group; the source countries are 10 developed non-European countries: U.S., Canada, Japan, Australia, New Zealand, Israel, Taiwan, Hong Kong, Korea and Singapore.
This decomposition is key to the identi…cation strategy. It enables us to plausibly assume that migration is free among the 16 countries of the …rst group, and is e¤ectively restricted by policy controls with respect to migrants from source countries of the second group. It is plausible to as-sume that the categorizing of both groups is exogenous to our dependent variable, the skill composition of immigrants. Thus we can identify the dif-ferential e¤ect of the generosity of the welfare state on the skill composition of immigrants across the two groups (the "free migration" group and the "policy-restricted migration" group) in an unbiased way.
The reason that it is safe to assume that this decomposition is exogenous to thee dependent variable, th skill composition of immigrants, is that the European integration is the result of long term developments of multilateral treaties, whose content extends far beyond the issue of immigrants and their skill composition. The historical development of the "free migration" group goes far back. The Treaty of Paris (1951) established the European Coal and Steel Community (ECSC) and was signed by France, West Germany, Italy, Belgium, Luxembourg and the Netherlands. The underlying idea was based on supra-nationalism, aiming to help the economy of Europe and prevent future war by integrating its members together. This treaty, among other
things, enabled the right to free movement for workers in these industries. Following that, the Treaty of Rome (1957) established the European Eco-nomic Community (EEC), signed by the same 6 countries. The main aim of the EEC was to "preserve peace and liberty and to lay the foundations of an ever closer union among the peoples of Europe". This treaty also provided for the free movement of all workers within the EEC.
The …rst enlargement was in 1973, with the accession of Denmark, Ireland and the United Kingdom. In 1981 Greece has joined, and Spain and Portugal became members in 1986. Transitional periods of 6 years, postponing free labor mobility were introduced for these three countries. In 1990, after the fall of the Iron Curtain, the former East Germany became part of the EEC as part of a newly reunited Germany. The Maastricht Treaty came into force on 1 November 1993, introducing the European Union (EU), which absorbed the EEC as one of its three pillars, to be called as the European Community (EC). The agreements reiterated the free movement of persons (article 39). That is, citizens can move freely between member states to live, work, study or retire in another country. Such freedom of movement also entails the abolition of any discrimination based on nationality between workers of the member states as regards employment, remuneration and other conditions of work and employment. Austria, Sweden and Finland joined in 1995. These countries together form the EU-15 (or, the "old members states").12
12The accession treaties normally allow for the introduction of ‘transitional measures’.
For instance, transitional periods of 6 years, postponing free labor mobility were intro-duced with respect to Greece, Spain and Portugal. The transitional measures obliges the member states to declare whether they will open up their labor markets for workers from the newly accessed countries, or keep restrictions in place for several (limited) years. In
The European Economic Area (EEA) came into being on January 1, 1994. The contracting parties to the EEA agreement are Iceland, Liechtenstein and Norway - and the EU Member States along with the European Community. Switzerland is not part of the EEA. However, Switzerland is linked to the European Union by bilateral agreements. The EEA as well as the Switzerland bilateral agreements with the EU are based on the same "four freedoms" as the European Community, which includes the free mobility of labor and equal treatment clauses.13
the eastern accession of the EU-8 (Poland, Lithuania, Latvia, Estonia, the Czech Republic, Slovakia, Hungary and Slovenia) in 2004, the restrictions will de…nitely end on 30 April 2011. A similar scheme (known as ’2+3+2’on account of the possible periods of restric-tions) is in place with respect to workers from Romania and Bulgaria, which joined the EU on 1 January 2007. Most EU-15 Member States (with the exception of the United King-dom, Ireland and Sweden) took the decision after the 2004 EU enlargement to maintain restrictions on the cross-border mobility of labour from the EU-8 (Malta and Cyprus were excluded from these restrictions), which delayed the migrant ‡ow between the EU-8 and EU-15 Member States for up to seven years. Portugal, Finland, Spain and from July 2006 also Italy decided to lift restrictions, while Belgium, Denmark, France, the Netherlands and Luxembourg decided to alleviate them. The restrictions remain unchanged in Austria and Germany.
13This historical sketch is based on the descriptions in Wikipedia of the Treaties of
4.3
The Econometric Model
We specify the source-host pair migration stock by the following equation:
mes;h= e0+ 1eRs;h+ e2Bh+ 3eRs;h Bh+Xs;h 1e+Xs;hRs;h e2+u e s;h; (18) e2 fh; lg; ues;h= s;h+ es;h Rs;h = 8 < : 0; if s; h are in the EU
1; if s is not in theEU and h is in theEU whereme
s;hdenotes the ratio of the stock of migrants of skill levele, originated
in source country s and residing in host country h, to the stock of all native workers of skill level e in the source, country s;, in the year 2000; R is a dummy variable, whis is equal to 0 if the source-host pair exercise free migration between them, and 1 otherwise; Bh denotes the average bene…ts
per capita in the host country h, in the years 1974-1990. The remaining controls are denoted by Xs;h: the ratio of the stock of skilled migrants, from
source countrysin host countryhto the stock of all native skilled migrants in the source countrys, in the year 1990; a similar ratio for unskilled migrants; the log of skilled native-born workers in the host countryhin year 1990; and a similar proportion for the unskilled. We also interact all variables with the decomposition dummy variable. The coe¢ cients are depicted by the vectors,
and . The error term is denoted by ue
s;h, which can be divided into two
components: a skill independent e¤ect, s;h, and a skill-dependent e¤ect es;h.
This simple model estimates the e¤ects of the bene…ts per capita (and the other control variables) on the emigration share, m, for each skill level. Note that s;h re‡ects some omitted variables which are skill independent. In
skill-di¤erences model (a version of di¤erence-in-di¤erence model), by subtracting the two equations in (18):
ms;h = 0+ 1Rs;h+ 2Bh+ 3Rs;h Bh+Xs;h 1+Xs;hRs;h 2+ s;h
(19) where is the skill-di¤erences operator.
The dependent variable, m, can be considered as a measure for the skill composition of immigrants. The skill-di¤erences model, (19), estimates therefore relative e¤ects of the regressors over m. The higher m is, the more upgraded is the skill composition the immigrants. Hence, a positive estimation of a certain coe¢ cient indicates a positive e¤ect on the skill com-position measure of the immigrants, and vice versa.14
An important statistical feature of the model is that it eliminates part of the error term, s;h. Any variable whose impact on migration is skill
invariant, is canceled out. Additionally, by the inclusion of past migration stocks in Xs;h we are able to account for key time invariant e¤ects.
Note that the e¤ect of on F is captured in the above equation by the coe¢ cient 2. Therefore, the null hypothesis describing the e¤ect of on
F becomes
2 <0:Also, the e¤ect of on Ris captured by the coe¢ cient 2+ 3. Therefore the null hypothesis describing the the e¤ect of on
R F becomes
3 >0:
14Naturally the estimation of can be obtained directly from (18), by estimating
each skill-dependent equation separately. As all skill-dependent equations in (18) have the same determinants, the coe¢ cients are simply the respective di¤erence of the separated estimation, h and l. However, extracting the estimation for from the DD model,(19), enables us to directly test the signi…cance of the coe¢ cients which are related to the di¤erences in the levels of the explanatory variables.
A potential endogeneity problem, between the level of bene…ts in the host country, Bh , and the skill composition of the migrants, ms;h, may arise,
because skill immigrants can in‡uence the political economic equilibrium level of bene…ts.15 One way go around this problem is to take the average
level of bene…ts over a long, pre-2000, period (1974-1990), as we indeed do. Recall that we also control for past migration stock rate (in 1990). Thus only migration between 1990-2000 is to be explained by the lagged bene…t variable, a predetermined variable. Importantly, in addition, we also run IV estimation, using the legal origin in the host country (English, Scandinavian, or French-German) as instrument. The legal origin, a century old construct, was put in place without having the 2000 migration in mind. The legal origin is however, closely linked to national attitudes towards the generosity of the welfare state, and its institutional setups. It is therefore likely to be strongly correlated with Bh.
We also provide several robustness estimations, including additional vari-ables like distance, common language and others.
4.4
Data Description
Migration data are taken from Docquier and Marfouk (2006). The data set contains bilateral stock of migrants, based on census and register data, for the years 1990 and 2000. Stock variables are more attractive for analysis than ‡ows because our model describes a long-run equilibrium of migration and voting decisions. Also, as indicated by Docquier and Marfouk (2006), data on
15For a political-economy model and evidence on the e¤ect of migrants on the generosity
migration ‡ows are less reliable than stock data, because ‡ow data disregard return migration movements, which may distort the estimation. Immigrants are at working age (25+), de…ned as foreign born, subdivided into three classes of education level: low-skilled (0-8 schooling years), medium-skilled (9-12 schooling years) and high-skilled (13+ schooling years).
Data for welfare-state bene…ts per capita is based on OECD’s Analytical Database (average for 1974-1990). Social expenditure encompass all kinds of social public expenditures, in cash or in kind, including, for instance, old age transfers, incapacity related bene…ts, health care, unemployment compensations and other social expenditures. The data is PPP-converted to 1990 U.S. dollars.
4.5
Main Findings
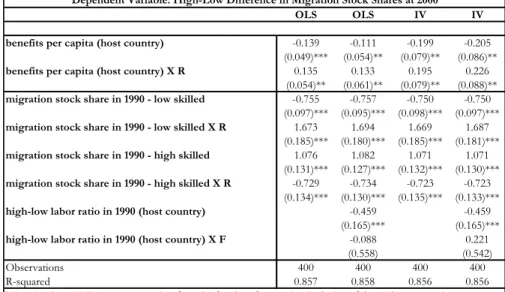
Table 1 presents the main estimation results. Columns 1 and 2 report OLS regressions results; columns 3 and 4 report IV regression results, using the legal origin of the host countries as the instrumental variable. The di¤erence between columns 1 and 3, on one hand, and columns 2 and 4, on the other hand, is in the variables of the vector Xs;h. Columns 1 and 3 contain only
the migration stock shares, skilled and unskilled, in the year 1990. Columns 2 and 4 include also the log-values of the skilled-unskilled native labor stocks ratio, in the host country, in the year 1990.
The …rst null hypothesis, is that 2 <0. It captures the migrant choices
in the free migration regime. Indeed, the coe¢ cient is negative and signi…cant in all four regressions. That is, the generosity of the welfare state adversely a¤ects the skill composition of migrants in the free migration regime. The
OLS OLS IV IV benefits per capita (host country) -0.139 -0.111 -0.199 -0.205
(0.049)*** (0.054)** (0.079)** (0.086)**
benefits per capita (host country) X R 0.135 0.133 0.195 0.226 (0.054)** (0.061)** (0.079)** (0.088)**
migration stock share in 1990 - low skilled -0.755 -0.757 -0.750 -0.750 (0.097)*** (0.095)*** (0.098)*** (0.097)***
migration stock share in 1990 - low skilled X R 1.673 1.694 1.669 1.687 (0.185)*** (0.180)*** (0.185)*** (0.181)***
migration stock share in 1990 - high skilled 1.076 1.082 1.071 1.071 (0.131)*** (0.127)*** (0.132)*** (0.130)***
migration stock share in 1990 - high skilled X R -0.729 -0.734 -0.723 -0.723 (0.134)*** (0.130)*** (0.135)*** (0.133)***
high-low labor ratio in 1990 (host country) -0.459 -0.459 (0.165)*** (0.165)***
high-low labor ratio in 1990 (host country) X F -0.088 0.221 (0.558) (0.542)
Observations 400 400 400 400
R-squared 0.857 0.858 0.856 0.856
Migration into 16 European countries, from 26 developed countries (inclusive of the 16 host countries, among which free migration is allowed);
F (R) is a dummy variable for the 16 (10) source countries whose migration into the 16 host countries is (not) free IV: legal origin of the host country (English, Scandivavian, German-French)
Robust standard errors in parentheses
* significant at 10%; ** significant at 5%; *** significant at 1%
Dependent Variable: High-Low Difference in Migration Stock Shares at 2000
Table 1: Welfare Migration: The High-Low Skilled di¤erential E¤ect between Free and Policy-Controlled Migration Regimes
magnitude of the coe¢ cient is even higher in the IV regressions than the OLS regressions. Whether we include the full set of the variables inXs;h in
the regressions (columns 2 and 4) or not (columns 1 and 3) does not seem to have much of an e¤ect on on the magnitude of the coe¢ cient.
The second null hypothesis is that 3 > 0. It indicates the
consider-ations of the host country’s voters in policy controlled migration regimes. Indeed, the coe¢ cient is positive and signi…cant in all four regressions. That is, the e¤ect of the generosity of the welfare state on the skill composition of migrants is more pronounced in the policy-controlled migration regime. The magnitude of the coe¢ cient is even higher in the IV regressions than
the OLS regressions. Again, whether we include the full set of the variables in Xs;h in the regressions (columns 2 and 4) or not (columns 1 and 3) does
not seem to have much of an e¤ect on the magnitude of the coe¢ cient. Turning to the other control variables,Xs;h, the e¤ect of low (high) skilled
migration stock rate in 1990 on the skill-composition of migration in 2000 is negative (positive) and signi…cant, in the free migration regime. An in-terpretation of this result is that in the free-migration regime there is an inertia over time for each skilled group of migrants. More unskilled migrants bring about further waves of unskilled migrants; and similarly, more skilled migrants bring about further waves of skilled migrants.
In the policy controlled migration regime, past migration of the unskilled increases the skill composition of immigrants in 2000 (past skilled migration increases the skill composition of immigrants in 2000, but less than in the free migration regime). The interpretation of this result, consistent with our model, is that having initially (i.e., in 1990) a large stock of unskilled migrants, which poses a …scal burden on the welfare state, induces its voters to opt for more skilled migrants in order to ease the burden. This explanation is supported in columns 2 and 4, where we account for the quantity of high-low skilled voters ratio, in the host countries. One can see that as this ratio is higher, the skill composition of immigrants is lower. Clearly, this outcome is in line with our model, wherein s< u.
4.6
Robustness Tests
First we replicate Table 1 with respect to the medium-skilled versus the low-skilled.
OLS OLS IV IV
benefits per capita (host country) -0.215 -0.126 -0.173 -0.152
(0.082)*** (0.082) (0.065)*** (0.068)**
benefits per capita (host country) X R 0.198 0.113 0.156 0.139
(0.082)** (0.083) (0.065)** (0.068)**
migration stock share in 1990 - low skilled -0.668 -0.666 -0.670 -0.665 (0.139)*** (0.133)*** (0.139)*** (0.132)***
migration stock share in 1990 - low skilled X R 0.130 0.133 0.132 0.132
(0.224) (0.221) (0.224) (0.221)
migration stock share in 1990 - medium skilled 0.890 0.895 0.892 0.894 (0.159)*** (0.152)*** (0.159)*** (0.151)***
migration stock share in 1990 - medium skilled X R 0.293 0.286 0.290 0.287
(0.402) (0.401) (0.402) (0.401)
medium-low labor ratio in 1990 (host country) -0.065 -0.065
(0.056) (0.056)
medium-low labor ratio in 1990 (host country) X F -1.663 -1.614
(0.485)*** (0.485)***
Observations 400 400 400 400
R-squared 0.727 0.746 0.726 0.746
Migration into 16 European countries, from 26 developed countries (inclusive of the 16 host countries, among which free migration is allowed);
F (R) is a dummy variable for the 16 (10) source countries whose migration into the 16 host countries is (not) free IV: legal origin of the host country (English, Scandivavian, German-French)
Robust standard errors in parentheses
* significant at 10%; ** significant at 5%; *** significant at 1%
Dependent Variable: Medium-Low Difference in Migration Stock Shares at 2000
Table 2: Welfare Migration: The Medium-Low Skilled di¤erential E¤ect between Free and Policy-Controlled Migration Regimes
As can be seen, the coe¢ cient of welfare bene…ts, for free migration regimes, is negative and signi…cant (in the second column, however, it is signi…cant only at 13%). The coe¢ cient of welfare bene…ts in policy con-trolled regimes is signi…cantly higher (again, with the exception of the second column).
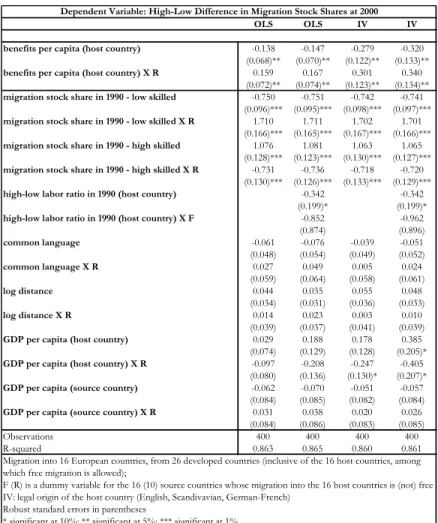
We now extend the main speci…cation so as to account for standrd vari-ables used in international immigration examinations. We include a dummy variable, accounting for common language between any source-host pairs, the log value of the great circle distance, in miles, between all source-host pairs, and the GDP per capita average in 1974-1990, in real terms converted into
PPP US$, for both the source and host countries:16
OLS OLS IV IV
benefits per capita (host country) -0.138 -0.147 -0.279 -0.320 (0.068)** (0.070)** (0.122)** (0.133)** benefits per capita (host country) X R 0.159 0.167 0.301 0.340
(0.072)** (0.074)** (0.123)** (0.134)** migration stock share in 1990 - low skilled -0.750 -0.751 -0.742 -0.741
(0.096)*** (0.095)*** (0.098)*** (0.097)*** migration stock share in 1990 - low skilled X R 1.710 1.711 1.702 1.701
(0.166)*** (0.165)*** (0.167)*** (0.166)*** migration stock share in 1990 - high skilled 1.076 1.081 1.063 1.065
(0.128)*** (0.123)*** (0.130)*** (0.127)*** migration stock share in 1990 - high skilled X R -0.731 -0.736 -0.718 -0.720
(0.130)*** (0.126)*** (0.133)*** (0.129)*** high-low labor ratio in 1990 (host country) -0.342 -0.342
(0.199)* (0.199)*
high-low labor ratio in 1990 (host country) X F -0.852 -0.962
(0.874) (0.896) common language -0.061 -0.076 -0.039 -0.051 (0.048) (0.054) (0.049) (0.052) common language X R 0.027 0.049 0.005 0.024 (0.059) (0.064) (0.058) (0.061) log distance 0.044 0.035 0.055 0.048 (0.034) (0.031) (0.036) (0.033) log distance X R 0.014 0.023 0.003 0.010 (0.039) (0.037) (0.041) (0.039)
GDP per capita (host country) 0.029 0.188 0.178 0.385
(0.074) (0.129) (0.128) (0.205)*
GDP per capita (host country) X R -0.097 -0.208 -0.247 -0.405
(0.080) (0.136) (0.130)* (0.207)*
GDP per capita (source country) -0.062 -0.070 -0.051 -0.057
(0.084) (0.085) (0.082) (0.084)
GDP per capita (source country) X R 0.031 0.038 0.020 0.026
(0.084) (0.086) (0.083) (0.085)
Observations 400 400 400 400
R-squared 0.863 0.865 0.860 0.861
Migration into 16 European countries, from 26 developed countries (inclusive of the 16 host countries, among which free migration is allowed);
F (R) is a dummy variable for the 16 (10) source countries whose migration into the 16 host countries is (not) free IV: legal origin of the host country (English, Scandivavian, German-French)
Robust standard errors in parentheses
* significant at 10%; ** significant at 5%; *** significant at 1%
Dependent Variable: High-Low Difference in Migration Stock Shares at 2000
Table 3: Welfare Migration: The High-Low Skilled di¤erential E¤ect between Free and Policy-Controlled Migration Regimes under Di¤erent Speci…cation
Again, the results are very similar to the ones presented in Table 1, where the IV estimations pronounc our theory predictions even more.
16The GDP per capita data is taken from Heston, Alan, Robert Summers and Bettina
Aten, Penn World Table Version 6.2, Center for International Comparisons of Production, Income and Prices at the University of Pennsylvania, September 2006.
5
Conclusion
Migration is often viewed as an economic force, which can mitigate the …scal burden induced by the process of aging. The reason is that an in‡ow of young working age immigrants may slow down population aging and help paying for social security. However, on the other hand, because immigrants often have low education and high fertility rates, their net …scal impact may be costly rather than bene…cial. Storesletten (2000) and Lee and Miller (2000) calibrate a general equilibrium overlapping generations model to investigates whether a reform of immigration policies could resolve the …scal problems associated with aging. Storesletten …nds that selective immigration policies, involving increased in‡ow of working-age high and medium-skilled immi-grants, can remove the need for a future …scal reform. Lee and Miller, on the other hand, base their conclusion on that immigrants have lower education and higher fertility rates than that of the native born population. Thus if more immigrants are admitted into the economy, they will ease temporar-ily the projected …scal burden associated with the retirement of the baby boomers. But the overall …scal consequences are relatively small.
Providing evidence on whether immigrants pay their way in the welfare-state is addressed in a series of in‡uential paper by Borjas (1991, 1994, 1996). Razin and Sadka (2000, 2004) address the issue of the …scal burden associated with immigrants in a pay-as-you-go …scal system. They show that the additional …scal burden could be shifted forward inde…nitely, and all cohorts of the native born in the present and in the future could gain from the initial in‡ux of unskilled migrants.17
We conclude by noting the potential for a reversed possible e¤ects that run from the skill composition of migrants to the generosity of the welfare state; and interactions between the skill composition of migrants and the generosity of the welfare state. The e¤ect of immigration on the generosity of the welfare-state is addressed by Razin, Sadka and Swagel (2002). They use data for 11 European countries during 1974-1992, and …nd that the coef-…cient of the share of immigrants in the host country population is negative in the labor tax, and welfare-state bene…ts regressions. They also …nd some evidence that the medium and high educated group among the immigrants have a positive coe¢ cient in the tax rate regression. They interpreted the result in terms of "…scal leakage" from the median voter toward unskilled mi-grants, and "…scal gift" from skilled migrants to the median voter. Facchini, Razin and Willmann (2004) treat the welfare-state bene…ts and immigration as being jointly determined. Some of their regressions show that the …s-cal -leakage e¤ect dominates the shift-in-the median voter e¤ect , but some other show the opposite. Facchini, Razin and Willmann (2004) provide an empirical study attempting to capture the interaction between tax-welfare and immigration, both as endogenous variables, so as to analyze welfare-state magnet for international data. The analysis supports the welfare-welfare-state magnet argument, when labor tax rates proxy the welfare-state program. However, if tax rates are replaced by welfare-state transfers (per capita), the results become statistically insigni…cant.
population on the size of social security bene…t per retiree turn out not to be signi…cant (Mulligan and Sala-i-Martin (1999) and Breyer and Craig (1997) and also negative (Razin, Sadka and Swagel (2002).
References
[1] Blank, Rebecca M. (1988), "The E¤ect of Welfare and Wage Levels on the Location Decisions of Female-Headed Households", Journal of Urban Economics, 24, 186.
[2] Bohn, Henning (2005), "Aging? An Update", in: Robin Brooks and Assaf Razin (eds.), The Politics and Finance of Social Security Reform, Cambridge University Press, 44-72.
[3] Borjas, George J. (1991).
[4] Borjas, George J. (1994).
[5] Borjas, George J. (1999). Heaven’s door: immigration policy and the American economy. Princeton University Press, Princeton, N.J.
[6] Breyer and Craig (1997)
[7] Brucker, Herbert, Gil Epstein, Barry McCormick, Gilles Saint-Paul, Alessandra Venturini, and Klaus Zimmermann (2001), "Managing Mi-gration in the European Welfare State," mimeo, IZA, Bonn, Germany.
[8] Brueckner, Jan K. (2000), "Welfare Reform and the Race to the Bottom: Theory and Evidence", Southern Economic Journal, 66(3), 505.
[9] De Giorgi, Giacomo and Michele Pellizzari (2006), "Welfare Migration in Europe and the Cost of a Harmonized Social Assistance", IZA Discussion Paper No. 2094.
[10] Docquier, Frederic and Abdeslam Marfouk (2006), "International Mi-gration by Educational Attainment (1990-2000)", in Ozden, Caglar and Maurice Schi¤ (eds.),International Migration, Remittances and the Brain Drain, McMillan and Parlgrave: New York.
[11] Docquier, Frederic, Oliver Lohest and Abdeslam Marfouk (2006), "What Determines Migrants’Destination Choice?", working paper.
[12] Dolmas, J., Hu¤man G.W., 2004. On the political economy of immi-gration and income redistribution. International Economic Review 45, 1129-1168.
[13] Enchautegui, Maria E. (1997), "Welfare Payments and Other Determi-nants of Female Migration", Journal of Labor Economics, 15, 529.
[14] Facchini, Giovanni, Assaf Razin and Gerald Willmann (2004), "Welfare Leakage and Immigration Policy",CESifo Economic Studies, 50(4), 627.
[15] Gelbach, Jonah B. (2000), "The Life cycle Welfare Migration Hypothe-sis: Evidence from the 1980 and 1990 Censuses", working paper.
[16] Gramlich, Edward M. and Deborah S. Laren (1984), "Migration and Income Redistribution Responsibilities", Journal of Human Resources, 19(4), 489.
[17] Hassler, J., Rodriguez Mora, J. V., Storesletten, K., Zilliboti, F., 2003. The survival of the welfare state, American Economic Review 93,. 87-112, 2003.
[18] Lee, R., Miller, T., 2000. Immigration, social security, and broader …scal impacts. The American Economic Review 90, 350-354.
[19] Levine, Phillip B. and David J. Zimmerman (1999), "An Empirical Analysis of the Welfare Magnet Debate Using the NLSY", Journal of Population Economics, 12(3), 391.
[20] McKinnish, Terra (2005), “Importing the Poor: Welfare Magnetism and Cross-Border Welfare Migration”Journal of Human Resources, 40(1), 57.
[21] McKinnish, Terra (2007), “Welfare-Induced Migration at State Borders: New Evidence from Micro-Data”Journal of Public Economics, 91, 437.
[22] Meyer, Bruce D. (2000), “Do the Poor Move to Receive Higher Welfare Bene…ts?”, unpublished paper.
[23] Ortega, F., 2005. Immigration quotas and skill upgrading. Journal of Public Economics 89, 1841-1863.
[24] Peridy, Nicolas (2006), "The European Union and Its New Neighbors: An Estimation of Migration Potentials", Economic Bulletin, 6(2), 1.
[25] Razin, Assaf and Efraim Sadka (2000). Unskilled migration: a burden or a boon for the welfare state. Scandinavian Journal of Economics 102, 463–479.
[27] Razin, Assaf, Efraim Sadka and Phillip Swagel (2002), "Tax Burden and Migration: A Political Theory and Evidence", Journal of Public Economics, 85, 167.
[28] Sala-i-Martin (1999)
[29] Southwick, Lawrence Jr. (1981), "Public Welfare Programs and Recipi-ent Migration", Growth and Change, 12(4), 22.
[30] Storesletten, K., 2000. Sustaining …scal policy through immigration. The Journal of Political Economy 108, 300-24.
[31] Walker, James. 1994. “Migration Among Low-income Households: Help-ing the Witch Doctors Reach Consensus.” Unpublished Paper.
A
Proof
We …rst show that @b( ; )@ >0: @b( ; ) @ = A (1 )" 1 + ( w"s (1 ) " 11+" 1 "(1 ) (1 + ) (1 +") (1 s+ (1 ) ) (20) (1 )w"u (1 ) " 1+" 1 " (1 + ) (1 +") (s+ ) ) >0Observe that: w"s (1 ) " 11+" >(1 )w"u (1 ) " 1+" , w"s (1 ) " 1+1" >(1 )wu" , 1 1 " 1+" (1 ) " 1 1+" >1 , 1 2" 1+" >1 , 1 >1
which is true by assumption, equation(10). Additionally, observe that:
1 "(1 ) (1 + ) (1 +") (1 s+ (1 ) ) >1 " (1 + ) (1 +") (s+ ) , (s+ ) > (1 ) (1 s+ (1 ) ) , 1 >1
which, again, is true by assumption, equation (10). Hence, it follows that
@b( ; ) @ >0.
Employing equation(??)yields:
@ws( ; ) @ = A b"(1 ) (1 + ) b" 1 1 1+" 1 (1 +") (s+ )2 <0 (21) @wu( ; ) @ = A b"(1 ) 1 (1 + ) (1 )b" 1 1+" 1 (1 +") (s+ )2 >0
which, indicates, as expected, that wages of each skill type fall with its pro-portions in the labor market.
Then it follows from the equations in the text that @Vu( ; )
@ >0:Therefore,
what is . Thus ddu = 0:When the decisive voter is a skilled individual, he opts for a skill composition of migrants, S, which is given by the …rst order
condition
Total di¤erentiation of their preferences yields: @Vp s( ; ) @ + dVp s( ; ) d d s d = 0 (22)
Given the second order condition assumption:
sign d
s
d =sign
@2Vsp( ; )
@ @ (23)
Hence, it follows that @2Vp i ( ; ) @ @ = d d [ (1 ) " ] + d d (1 )li( ) dws( ) d = (24) = (1 )" "(1 )" 1 dws( ) d w " s( ) (1 +") (1 ) " = = [ (1 )"] 1 " 1 + (1 )li( ) dws( ) d 1 +" 1 Note that 1 " 1 > 1 +" 1 , 1 1 " + 1 +" 1 >0 , 1 (1 ) >0
It then follows that @2Vip( ; )
@ @ >0:
Hence d s
d >0:
2. Observe from the equations in the text that: @Vi( ; ; ) @ = dui(mi) dmi dmi d , i2 fs; ug (25)
As dui(mi) dmi >0: sign dmi d =sign @Vi( ; ; ) @ (26) Recall that @Vi( ; ) @ = @b @ wi(wi(1 )) " = Y N wili = = wsls(s+ms) +wulu(1 s+mu) wili(1 +ms+mu) N Therefore, for the skilled migrants:
@Vs( ; ; ) @ = (1 s+ (1 ) ) N (wulu wsls) = (27) = (1 s+mu) (1 ) " N w 1+" u w 1+" s <0 ,wu < ws
which entails that ms decreases.
Whereas, for unskilled migrants: @Vu( ; ; ) @ = (s+ ) N (wulu wsls) = (28) = (s+ms) (1 ) " N w 1+" s w 1+" u >0 ,wu < ws
which entails that mu increases.
Recall that:
= ms
ms+mu
Hence, it follows that d d = dms d (ms+mu) dms d ms dmu d ms (ms+mu)2 = (29) = dms d mu dmu d ms (ms+mu) 2 <0