ISSN 1818-4952;
© IDOSI Publications, 2012
DOI: 10.5829/idosi.wasj.2012.19.04.1447
Corresponding Author: Tze San Ong, Department of Accounting and Finance, Faculty of Economics and Management,
Hedging Effectiveness of Crude Palm Oil Futures Market in Malaysia
Tze San Ong, Wei Fong Tan and Boon Heng Teh
1 1 2
Faculty of Economics and Management, University Putra Malaysia, Malaysia
1
Faculty of Management, Multimedia University Malaysia
2
Abstract: This paper investigated the hedging effectiveness of crude palm oil futures market in Malaysia from
January 2009 to June 2011 which traded under Bursa Malaysia Derivatives Berhad. Ordinary Least Squared (OLS) method was used to compute Minimum-Variance hedging ratio (MVHR), R-squared and hedging effectiveness by using daily data from settlement price of crude palm oil futures contracts and spot price of crude palm oil. The empirical results indicate that the highest hedging ratio has been observed in the February 2009 FCPO contract, 66.7660%. Meanwhile, the lowest hedging ratio occurs in June 2010 contract which is 35.7131%. In overall, Malaysia FCPO market only provides a low level of hedging effectiveness (19% - 53%) due to less volatility of CPO spot price. As a conclusion, hedging effectiveness of crude palm oil futures market in Malaysia shows a low level of hedging effectiveness. This result indicates that the spot price of crude palm oil in Malaysia is relatively stable and consistent over the period of 2009 to 2011. The outcome of this research intends to provide hedging information of the Malaysia FCPO futures market in order to cover risk exposure by holding FCPO in BMD.
Key words: Hedging effectiveness Ordinary Least Squared Minimum-Variance Hedging Ratio R-squared
INTRODUCTION commodity derivatives which is futures contracts and
Futures market has been used by arbitrageurs, commodity futures contracts.
speculators, producers and policymakers for risk Bursa Malaysia’s Crude Palm Oil Futures contract reduction purpose by predicting the spot prices in the (FCPO) first established in the Kuala Lumpur Commodity future. A stress test of any futures market is its ability to Exchange (KLCE) in 1980. Asian financial crisis in July generate prices that are efficient especially during 1997 has caused the restructuring of Malaysia derivative extremely volatile economic uncertainty periods [1]. market which undergo series of regulatory framework. Economic agents are exposed to high risks associated In November 1998, FCPO were traded in Commodity and with movements in commodities cash prices during the Monetary Exchange (COMMEX).In 2003, Bursa Malaysia trading of physical commodities. Therefore, the interest Derivatives Berhad (BMD) has been established and used and main objective of the development in commodity in trading derivative market in Malaysia. Meanwhile, futures markets is due to the demand for hedging facilities FCPO is also traded under BMD. In the year end of 2009, [2]. It is important to understand the role of commodity there is a highlight for Malaysia futures market where futures market for risk management purpose. People there is an establishment of strategic alliance partnership commonly know that the prices are fluctuating over time between BMD and Chicago Mercantile Exchange (CME) for shares, commodities and currency. So, there is Group. FCPO is a very standardized contract which is set possibility of adverse price changes in future creates risk and managed under BMD. A FCPO contract consists of arising from unforeseen price changes. A derivative is a 25 metric tonnes of palm oil. Each FCPO contract is financial contract whose price depends on, or is derived quoted in Ringgit Malaysia (RM) per metric tonne. from, the price of another asset [3]. There are two types of The tick price is RM1.00 per metric tonne. The physical options contracts. However, this study will only focus on
settlement of contracts is realized upon the maturity date risk as open interest for FCPO contracts on BMD has where the actual physical commodity is sent to the risen steadily on the back of an even mix of players in the contract buyer at the port specified by the seller [4]. futures market.
Background and Purpose of Study: In futures markets, the 2008 US credit crisis and recently Europe debt crisis
the hedging effectiveness (HE) measure has been used to had sparked concerns which would negatively influence examine the usefulness of direct hedges. The HE Malaysia’s crude palm oil (CPO) export. A hold back over measure indicates the proportion of the unhedged return the global economic growth would inevitably impact variance that can be purged through hedging when only emerging economic. Malaysian FCPO price has dropped price variability is considered. [5]. The accuracy of 44.43% in 2008 which is the biggest yearly decline ever hedging effectiveness measurement is relatively important due to global financial crisis. However, the total FCPO in efficient decision making [6]. The objective of hedging contract traded has been increased dramatically from ratio is aimed to minimize the risk by holding futures 3,003,549 contracts in 2008 to 4,008,882 contracts in 2009. contract and spot market at the same time. Hedge ratio Therefore, it is important to investigate the level of provides actual ratio information in terms of the number of hedging effectiveness after 2008 financial crisis.
units that should be held in one asset in order to offset The outcome of this research intends to provide the risk of holding/shorting one. The complexity in hedging information of the Malaysia FCPO futures market measuring hedge ratios may vary from simple native in order to cover risk exposure by holding FCPO in BMD. approaches to more complicated regression methods [7]. The derivatives can complete the market, improve Overall the best or optimal hedging approach will be a efficiency, transfer risk and discover prices. Market function of the hedging ratio in formulating the hedge. participants can use FCPO to manage price risk, speculate Ordinary Least Square (OLS) regression has been and gain immediate exposure into the commodity market. commonly recognized and suggested by researchers in
determine the optimal hedge ratio in order to measure the Literature Review: The main purpose and function of difference between the cash prices and the futures prices. hedging is that the impact of downside price movements [8]. One of the most popular portfolio hedging theories can be reduced on the value of the investment. In theory has been recommended by Ederington [9]. Figlewski [10] and in the absence of natural hedges, hedging is essential has studied the hedging performance based on as a one of the valuable activity for investors to relationship of the different sources of basis risk. The participate in. Brailsford, Corrigan, & Heaney [6] have finding has indicated that hedging performance is affected identified that hedging activity involve costs. Apart from by hedging duration and time to expiration. the direct costs associated with the hedging instrument, This study explores the hedging effectiveness of the there are related indirect costs: (i) the risks of imperfect Malaysia FCPO market. In a move to provide greater hedges through sub-optimal hedge ratios, (ii) the visibility and accessibility to international traders, BMD specification risk and basis risk and (iii) the costs of migrate its products onto the CME Globex electronic management and monitoring of the hedge position. trading platform on 20 September 2010 following BMD Hence, the costs and benefits of a hedge must be collaboration with the CME Group in 2009 in which the weighted before engaging into a hedging strategy. operator of the world’s largest derivatives exchange. Three hedging theories have been distinguished by According to media release by Bursa Malaysia dated 13 Pennings and Meulenberg [11]. An opposite but September 2011, the BMD crude palm oil futures contract equivalent position in the futures market must be taken to set a new record as of the close of mid-day trading on 13 hedge cash positions. Second theory proposes that September 2011, with a total of 4,072,384 contracts traded hedgers should act as speculators and need to be so far for 2011, surpassing the previous record of principally interested in absolute prices instead of relative 4,064,361 contracts traded for the whole of 2010. This is prices. Nowadays, the portfolio approach of hedging the highest ever number of contracts traded annually strategy has been utilized through a variance reduction since FCPO contracts started trading in 1980. Therefore, function of the hedging model when there is a risk of price this market is important to analyse because it is changes occurs. Furthermore, there is a direct relationship interesting to investigate whether Malaysian between expected returns and variance measured from the commodity futures can be as effectively used in hedging empirical results of previous studies.
The studies on measurement of return optimization of minimization which depends on the measurement of within a portfolio have become a major concern due to the or post-sample. For instant, Holmes [13] has reported risk condition that whether the variance in returns can be reduction of about 80% in direct hedges whereas reduced or optimal balance is establish between risk and Butterworth and Holmes [14] concluded that indirect return. The assumption has been made based on the hedges produce risk reductions ranging between 4% and perfect futures contract that incurs no risks [12]. However, 22% for weekly in sample hedges. Brooks and Chong the risks still exist with futures contract and it could even reported out of sample risk reduction varying between 8% affect investors on the variance of returns. Therefore, a and 15% for the currencies using the exponential moving huge interest has been drawn to the management of average model. Castelino [19] estimated in-sample risk futures exchange in order to study the impact of risks reduction of 22% and 31% for T Bills and Eurodollars toward futures contract. respectively but only 3% for corn and wheat. Figlewski In evaluating the hedging performance of a futures [10] suggested hedging can achieve risk reduction of the contract, the following three main issues are relevant and order of about 20–30% of the unhedged portfolio’s important to take into consideration: standard deviation.
Optimum Hedge Ratio: Figlewski [10] has caused an Stationary or Time-Varying Hedge Ratio: The third issue
enormous discussion in the literature for the best method is to determine a stationary or time-varying of an optimal to determine optimal hedge ratio due to the varying hedge ratio. This concern is essential due to the conclusion made in his research. Holmes [13] using UK characteristic and behaviour of time-varying hedge ratios stock indices concluded that the OLS estimated MVHR which involve frequent updating of the hedge ratio. has delivered the highest hedging effectiveness compared There are mix results have been observed. Holmes [13] to GARCH model, error correction (EC) methods and Beta reported that the optimum hedge ratio is stationary but is hedging estimation. Later, Butterworth and Holmes [14] vary over time. Later, Ferguson [20] reported that if have found that regression thinning by cut off the outliers optimum hedge ratios are stationary, the hedge ratio has caused minor impact on the hedging effectiveness for update would not enhance the hedging performance. the investment companies. Koutmos [15] has examined However, Koutmos [15] has discovered that dynamic the hedging of treasury bills and discovered that pure hedging will lead to better hedge results. Myers [17], who GARCH and OLS estimations are less effective than has examined the time varying hedges for wheat has EGARCH of the hedge ratio. Besides, Lien [16] has found that time varying hedging will just delivered minor reported that OLS-MVHR estimation delivered the worst benefits over the constant optimum hedge ratios results for hedging periods of more than 4 days as assumption.
compared with Fractionally Integrated EC, VAR and EC
models. However, Myers [17] has examined the hedge of OLS Minimum Variance Hedging Model: Ederington [9] commodity hedging and found that GARCH methods uses simple linear regression in the construction of are just slightly better compared to OLS methods. Finally relationship between the cash and futures market prices Brooks [18] examined the performance comparison for a which named as OLS hedge ratio. The positive result has few hedging models including utilization of the implied been obtained by deriving the hedge ratio from the model volatility from options contracts to find out the optimal to determine hedging effectiveness. Furthermore, the hedge through the daily observations for foreign hedging effectiveness is presented by regression which
exchange. is the R statistic. The better hedging effectiveness is
Degree of Risk Reduction: The second issue is about the simple due to the only consideration for the ability of risk
level of risk minimization obtained from the optimum minimization of the hedging strategy which has excluded hedge. The degree of risk minimization differs broadly and the existence of expected return. Besides, some previous three aspects are related to it. The first concern is to studies also revealed that hedged portfolio return is not determine whether there is a cross or a direct or indirect normally distributed.
hedge. The second concern is about the hedging on The attention of financial econometricians has been types of asset portfolio, which may be commodities or attracted by the determination of optimal hedge strategy. non-commodities. The third concern is the risk Ederington [9] has proposed an ordinary lease-squares
2
2 2 2 2 1 2 1 ( , ) pt= st+ t− ft− t−cov r rftst 2 pt st2 2ft * 1 cov( , )st ft2 t ft r r − = − regression-based method based on static hedge ratio Methodology
which also known as the minimum variance hedge ratio. Data Collection: Data are gathered from daily data on Later, Figlewski [10] has investigated the effects of basis settlement price for crude palm oil futures traded on the risk on hedging performance based on vary sources. Bursa Malaysia Derivative Berhad (BMD) and daily data He has found that the hedging performance is affected by of crude palm oil spot price from Malaysian Palm Oil the hedging period and time maturity. The study also Board (MPOB). The time period covered is from 15 concludes that the overreaction of futures price to August 2008 to 15 June 2011. FCPO contract will be changes in the spot index will be weakened if futures expired on the 15 day of the delivery month at market has been developed. noon. If the 15 is a non-market day, the maturity day will Floros and Vougas [21] have investigated the be the preceding business day. Meanwhile, the crude hedging effectiveness in Greek stock index futures market. palm oil spot price is based on daily closing price that They has examined hedge ratios by using OLS, ECM, provided by MPOB in Malaysian Ringgit per metric VECM and BGARCH (1,1) methods to determine which tonnes.
hedge ratios provides better results of hedging
effectiveness. The result from OLS has reported that the Ordinary Least Squares (OLS) Method
R-squared value of FTSE/ASE-20 is much higher than that of FTSE/ASE Mid 40. In line with that, Lien and Yang [22] has analysed the shanghai Futures Exchange. They compare the strategy of the na¿ve hedge strategy, OLS hedge strategy and BFIGARCH model. They find that OLS strategy has outperformed other models for the certain sub-period of aluminium.
Furthermore, Kavussanos and Visvikis [23] have examined the hedging effectiveness of the Greece futures markets. The conventional (OLS) model produces the highest variance minimization for daily data of in-sample hedge ratios. The VECM model has outperformed others constant hedge ratio models (na¿ve and OLS) for the FTSE/ATHEX-20 market, whereas for the OLS model has performed the best in FTSE/ATHEX Mid-40 market. The largest variance reduction has been achieved by the OLS model followed at lower values by the VECM, the na¿ve model and the VECM-GARCH.
However, Zanotti, Gabbi and Geranio [24] has analysed hedging policies implemented by using various hedge ratios approach in the case of electricity market. They have found that only time varying GARCH models delivered a noteworthy and consistent variance reduction. The higher volatility of market movement will cause the improvement in performance of dynamic hedging model in comparison to traditional hedging models when there is relatively high correlation of the standard deviation.
The OLS minimum-variance hedging strategy will be proposed and applied in this research due to the simplicity of OLS model and assume that the behaviour of hedge ratio is stationary.Kavussanos and Visvikis [23] have proven that OLS minimum-variance hedge model able to give highest hedging effectiveness for the stationary hedge. This result is consistent with previous study by Ederington [9].
th th
Minimum-Variance Hedging Ratio: In order to identify
the existence of fluctuation in CPO spot market and FCPO futures market, the optimal futures position can be measured by minimizing the variance of the spot-future portfolio. Let the actual return represented by rst on a CPO spot position for the duration of time t – 1 to time t. Furthermore, letrft represent the actual return on a CPO futures position. Therefore,E(rpt) which is expected return of a portfolio comprising one unit of the CPO spot position and unit of the CPO futures contract may be written as
E(rpt) = E(rst) – t–1E(rft) (1) where is the hedging ratio that has been identified at timer – 1 for employment in time t.
The variance of the portfolio is written as
(2) where , and represent the conditional variances of the portfolio, of the spot and of the futures positions and cov(r , rst ft) is the conditional covariance between the spot and the futures position. Hence, the optimum quantity of futures contract in the hedger portfolio is equivalent to.
(3) Optimal hedging ratio can be obtained from the fraction of the covariance between spot and futures returns and the variance of futures returns. The constant optimal hedging ratio can be measured as the estimated slope coefficient in the OLS regression if the conditional
( ) ( ) ( ) Var Var h E Var u − = 2 2 2 2 . 1 1 1 ( ) ( ) 2 ( ) ( ) S S F S F u t t h t t t t Var u Var h h h R S S R S S h F F + + + = = + − = − = − − −
variance-covariance matrix is time invariant, where can be defined as hedging ratio. The measure of the dependent variable is spot returns and the independent variance of the hedged returns to the portfolios can be variable is futures returns: done by evaluating Var( S – h F), where h, is the
r = a + r + st ft t (4) whererst is the spot return and rft is the futures returns for
period t. The OLS estimator of has represented the Hedge Ratio: The determination of hedge ratio for each minimum-variance hedging ratio. Since it is a static hedge FCPO contract is important to determine a hedging then the hedging ratio is assessed once and can be used position. The essential procedure is to simultaneously to the all hedging period [24]. hold an offsetting position in futures while taking a spot As the hedge ratio has determined, a hedged position position. Therefore, the fluctuation effect of price is constructed to produce the rate of return,RH, which is movement in the cash market can be minimized by the
given by action in the futures market. The computed hedging
R = sH t – h Ft (5) The expected return of a portfolio consist of return from where St and Ft represent spot and futures price the CPO futures contract, where is the hedge ratio as
changes [25]. mentioned in equation (1) in methodology.
Hedging Effectiveness: Following Ederington [9], the for the FCPO contracts from January 2009 to June 2011.
hedging effectiveness is represented by R-squared of the OLS regression:
st = c + b Ft + ut (6) where St is logged spot price and Ft represents futures prices at time period t and ut is the error term from OLS estimation. The R-squared of the regression line is equivalent to the effectiveness of hedge. The larger the R-squared presents the better of minimum-variance hedging effectiveness.
However, the degree of hedging effectiveness can be defined as the ratio of the variance of the unhedged position minus the variance of the hedged position, over the variance of the unhedged position:
(7) where
(8)
Var(u) and Var(h) represent variance of unhedged and hedged positions, while , are standard deviations ofS F
the spot and futures prices. The value of h and S.F
represents the covariability of the spot and futures price
t t t t
computed hedge ratio [21].
DISCUSSION
ratio in this study is static without time varying concern. single unit of CPO cash position and return from unit of
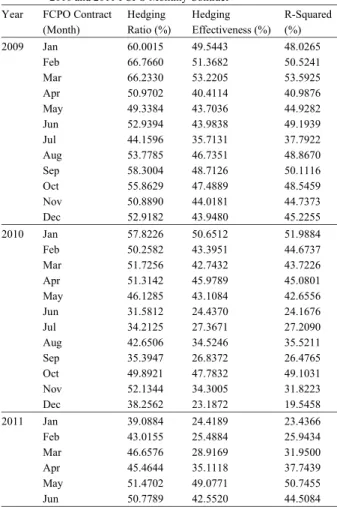
Table 1 reports the hedging ratio in percentage
Table 1: Hedging Ratio, Hedging Effectiveness and R-Squared of 2009, 2010 and 2011 FCPO Monthly Contract
Year FCPO Contract Hedging Hedging R-Squared
(Month) Ratio (%) Effectiveness (%) (%)
2009 Jan 60.0015 49.5443 48.0265 Feb 66.7660 51.3682 50.5241 Mar 66.2330 53.2205 53.5925 Apr 50.9702 40.4114 40.9876 May 49.3384 43.7036 44.9282 Jun 52.9394 43.9838 49.1939 Jul 44.1596 35.7131 37.7922 Aug 53.7785 46.7351 48.8670 Sep 58.3004 48.7126 50.1116 Oct 55.8629 47.4889 48.5459 Nov 50.8890 44.0181 44.7373 Dec 52.9182 43.9480 45.2255 2010 Jan 57.8226 50.6512 51.9884 Feb 50.2582 43.3951 44.6737 Mar 51.7256 42.7432 43.7226 Apr 51.3142 45.9789 45.0801 May 46.1285 43.1084 42.6556 Jun 31.5812 24.4370 24.1676 Jul 34.2125 27.3671 27.2090 Aug 42.6506 34.5246 35.5211 Sep 35.3947 26.8372 26.4765 Oct 49.8921 47.7832 49.1031 Nov 52.1344 34.3005 31.8223 Dec 38.2562 23.1872 19.5458 2011 Jan 39.0884 24.4189 23.4366 Feb 43.0155 25.4884 25.9434 Mar 46.6576 28.9169 31.9500 Apr 45.4644 35.1118 37.7439 May 51.4702 49.0771 50.7455 Jun 50.7789 42.5520 44.5084
In 2009, the highest hedging ratio is recorded as 66.7660% Meanwhile, these two models also show that the lowest in February contract, whereas, the lowest hedging ratio hedging effectiveness occurred in July 2009 FCPO occurs in July contract which is 35.7131%. The uptrend of contract, which is 35.7131% and 37.7922%, respectively. hedging ratio is spotted twice in 2009. First uptrend period However, the hedging effectiveness that observed within is from January to March (first quarter), which the uptrend the period of June 2010 and April 2011 are considered as hedging ratio is 60.0015%, 66.7660% and 66.2330%, low level of hedging effectiveness. Most of the hedging respectively. Second uptrend period is from July to effectiveness are spotted within the range of 20% to 40%. September (third quarter), which is 44.1596%, 53.7785% The highest hedging effectiveness has been observed in and 58.3004%, respectively. October 2010 contract at 47.7832% for Model (1) and In year 2010, the highest hedging ratio is 49.1031% for Model (2). This October 2010 contract is the observed from January contract which is 57.8226%. In only one contract that exceeded 40% of hedging contrast, the lowest hedging ratio is June contract, effectiveness within the period. Besides, the lowest 31.5812%. Hedge ratios downtrend has been hedging effectiveness based on Model (1) and (2) is observed from January contract until June contract. recorded in December 2010 contract at 23.1872% and However, the uptrend has been observed in the second 19.5458%.
half of 2009, the ratio increased from 34.2125% in July The largest difference of hedging effectiveness contract to 52.1344% in November contract. There are two between Models (1) and (2) is observed in June contract dips observed in September and December contracts, of 2009, where the difference is 5.2101%. However, the where the hedging ratio is 35.3947% and 38.2562%, smallest difference occurs on July contract of 2010, which
respectively. is only 0.1580%. In overall, the average difference of
For the first six-month in 2011, the highest and the hedging effectiveness between Model (1) and Model (2) lowest hedging ratios have been observed in May is just 0.67%. As the difference between these two contract and January contract, which amounted to models is too small, it can be considered that these two 51.4702% and 39.0884%, respectively. The uptrend of models are actually providing the similar results in hedging ratio is also observed during the period of calculating hedging effectiveness.
January to May. Further, there is a small dip in Jun The R-squared of the OLS regression as proposed in contract, which is 50.7789%. Model (2) is equivalent to hedging effectiveness as In general, the observed hedging ratios for the proven by Ederington [9]. High degree of R-squared sample period range from 31.5812% to 66.7660%. (80% to 99%) of the OLS regression is considered as
Hedging Effectiveness: The hedging effectiveness and Vougas [21]. However, Zanotti, Gabbi and Geranio [24]
R-squared computed from Model (1) and Model (2) are have found that maximum hedging effectiveness is compared to show the difference between these two observed when spot price is highly volatile. Therefore, models. These values are showed in Table 4.1. The results there is a direct relationship between hedging indicate that hedging effectiveness calculated from these effectiveness and pricing volatility. Referring to the two models is actually similar for each monthly FCPO hedging effectiveness based on Model (1) and (2) for contract. Meanwhile, these two models have given mixed FCPO in this study, it indicates that FCPO contracts in results in obtaining best hedging effectiveness. It is Malaysia are only providing average level of hedging concluded that none of the model will outperform the effectiveness (19%-53%).
other in calculating hedging effectiveness of FCPO
contracts. Year to Year Comparison from 2009 to 2011: Annually
The hedging effectiveness for Model (1) and Model average of hedging ratio, hedging effectiveness and (2) within period of January 2009 and May 2010 is R-squared have been computed for monthly FCPO considered to provide average performance in hedging contracts and the results are reported in Table 2. All the effectiveness. Most of the hedging effectiveness has results show a downward trend from 2009 to first half of fluctuated within the range of 40% to 50%. In this period, 2010. The highest average hedge ratio is observed in 2009 the highest hedging effectiveness for both models have (55.1798%), but it is dropped to 45.1142% in 2010. been observed from March 2009 FCPO contract, which is However, the average hedging ratio for the first six-month 53.2205% for Model (1) and 53.5925% for Model (2). in 2011 remains consistent at 46.0792%.
Table 2: Annually Average of Hedging Ratio, Hedging Effectiveness and R-Squared for 2009, 2010 and 2011
Average Hedging Average Hedging Average
R-Year Ratio (%) Effectiveness (%) Squared (%)
2009 55.1798 45.7373 46.8777
2010 45.1142 37.0261 36.8305
2011 (First 6 months) 46.0792 34.2608 35.7213
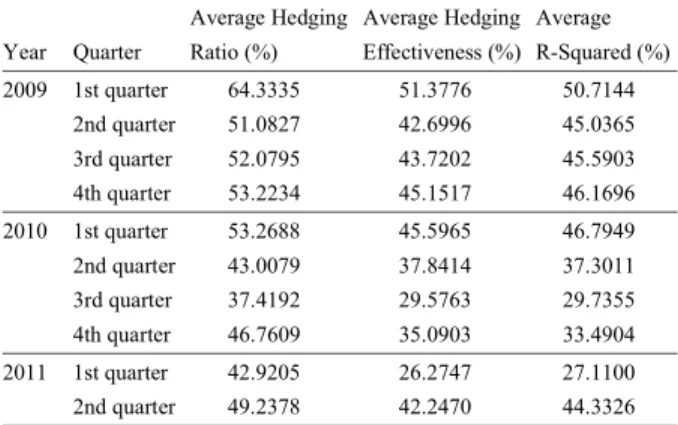
Table 3: Quarterly Average of Hedging Ratio, Hedging Effectiveness and R-Squared for 2009, 2010 and 2011
Average Hedging Average Hedging Average Year Quarter Ratio (%) Effectiveness (%) R-Squared (%)
2009 1st quarter 64.3335 51.3776 50.7144 2nd quarter 51.0827 42.6996 45.0365 3rd quarter 52.0795 43.7202 45.5903 4th quarter 53.2234 45.1517 46.1696 2010 1st quarter 53.2688 45.5965 46.7949 2nd quarter 43.0079 37.8414 37.3011 3rd quarter 37.4192 29.5763 29.7355 4th quarter 46.7609 35.0903 33.4904 2011 1st quarter 42.9205 26.2747 27.1100 2nd quarter 49.2378 42.2470 44.3326
Both the average hedging effectiveness and average R-squared have shown similar results over the sample period. The average hedging effectiveness has decreased from 45.7373% in 2009 to 37.0261% in 2010. The value declines further to only 34.2608% in the first six-month of 2011. The similar downtrend of average hedging effectiveness also observed in average R-squared. The average R-squared peaked in 2009 as 46.8777%, it is later decreased to 36.8305% in 2010 and slightly reduced to 35.7213% in first-half of 2011.
The highest average hedging effectiveness has been observed in 2009 in comparison with 2010 and 2011. This result shows the effects of credit crisis that crunched in the US financial market and further affected the global market that caused the sluggish CPO demand worldwide. As a result, the palm oil exports have slightly increased by 0.45 million tonnes and registered the total of 15.87 million tonnes in 2009. In contrast, the total production of 2009 CPO has been dropped to 17,564,937 tonnes which is 0.96% less than previous year. This is due to lower output of fresh fruit bunches which caused by weather condition such as heavy rainfall and biological stress on the trees. All this factors has mainly affected CPO pricing movement and caused higher pricing volatility in 2009 compared to 2010 and 2011.
The CPO price rose steadily with the rising of petroleum crude oil prices as a result of recovery on global economic conditions in 2010. However, the tsunami
and earthquake in Japan and financial turbulence from the debt crisis in Europe has worried the markets globally in 2011 again. Anyway, the effect of the events is not obvious during the sample period. In overall, the hedging effectiveness level has been considered as low and consistent throughout the year 2010 and 2011.
Comparison of Quarterly Average within Specific Year:
The quarterly average of hedging ratio, hedging effectiveness and R-squared has been computed and reported as in Table 4.3. In this section, the comparison will be made according to quarterly performance of a year.
Comparison of Quarterly Average in 2009: The quarterly
average of hedging ratio, hedging effectiveness and R-squared in 2009 has been shown in Table 3. The highest average hedging ratio is observed in the first quarter of 2009 at the level of 64.3335%. However, the value has dropped dramatically to the lowest point (51.0827%) in the second quarter. After that, the average hedging ratio has remained consistent over the following quarters. The value is recorded as 52.0795% and 53.2234%, respectively.
On the other hand, the average hedging effectiveness has decreased from the peak position (51.3776%) in first quarter to the trough position of 42.6996% in second quarter. However, the average hedging ratio has slightly increased to 43.7202% in third quarter and 45.1517% in fourth quarter. Meanwhile, the average R-squared is also showing a similar trend where the highest average R-squared is observed in first quarter, which is 50.7144%. But, the average R-squared later dipped to the lowest level, 45.0365% in second quarter and remained relatively consistent in third and fourth quarter, which is 45.5903% and 46.1696%, respectively.
The highest hedging effectiveness level has been shown in first quarter. This mainly caused by the US financial market credit crisis and affected the global market’s CPO demand. The weakening dollar from the bailout of banking and related insurance business has partially led to increasing dollar-based commodity prices. The market uncertainty has caused the heavy fluctuation in CPO prices in the beginning of the year. However, the CPO prices recovered with petroleum crude oil and other edible oil commodities in the third and fourth quarter. Meanwhile, the dramatically growth in Indonesia palm oil production has caused high stock levels and the gross supply growth may has threaten prices. In overall, speculative activity continues to influence the recovery of commodity prices, with petroleum still playing the
biggest role as driving force that caused the average The average hedging effectiveness has increased from hedging effectiveness consistent at average level 26.2747% in first quarter to 42.2470% in second quarter. throughout the year. Average R-squared has also increased from 27.1100% in
Comparison of Quarterly Average in 2010: The The uptrend of hedging effectiveness level in the first
movement of quarterly average of hedging ratio, hedging two quarters has been affected by the La Nina effectiveness and R-squared in 2010 has shown a ‘V’- Phenomenon 2010/11 that causing the bad weathers. Due shape trend. The average hedging ratio is having a to the La Nina phenomenon, the world production of total downturn movement for the first three quarters, where it vegetable oils had been decreased. The Malaysia palm oil has dropped from the highest point (53.2688%) in the first production has been decreased by 17.6% in the first quarter to the lowest point (37.4192%) in the third quarter. quarter compared to last quarter of 2010. The weak growth In the fourth quarter of 2010, the average hedging ratio in some of the major market, tsunami and earthquake in has bounced back to 46.7609%. Japan and financial turbulence from the debt crisis in Similar trends have been observed for both average Europe has worried the markets globally and caused the hedging effectiveness and average R-squared. The trends slow CPO demands over the first-half of 2011.
are showed in Figure 4.6. The average hedging
effectiveness peaks at 45.5965% in first quarter. However, CONCLUSION
it has decreased to 37.8414% in the second quarter and
further dropped to 29.5763%, the lowest point in the third In the financial market, commodity hedging is when quarter. The average hedging effectiveness manages to a producer or manufacturer decides to offset or eliminate recover in the fourth quarter to 35.0903%. Similarly, the risks due to the fluctuations in the raw material prices. average R-squared has dropped from the peak position A hedge is effective if price movement of the hedged item (46.7949%) in the first quarter to the lowest point and the hedging derivative roughly offset each other. (29.4904%) in the third quarter. However, the value has The higher volatility of the price movement, the higher of bounced back to 33.4904% in the fourth quarter. hedging effectiveness will be observed. In this study, the The downward trend of hedging effectiveness level hedging effectiveness of crude palm oil futures market in from first quarter to third quarter is mainly attributed by Malaysia will be studied by using OLS Minimum-Variance the high stability and consistency of world prospects that hedge ratio models.
considered as post-US credit crisis period. The CPO price The empirical results indicate that the highest rose steadily with the rising of petroleum crude oil prices. hedging ratio has been observed in the February 2009 The increasing popularity of renewable energy where CPO FCPO contract, 66.7660%. Meanwhile, the lowest hedging used to create biofuel in Europe in Europe has boosted ratio occurs in June 2010 contract which is 35.7131%. In the growth in palm oil industry. However, La Nina the comparison of annually average of hedging phenomenon was a strong event at the end of the 2010 effectiveness and R-squared for 2009, 2010 and 2011, all which caused bad weathers and disrupted the harvesting the results show a downward trend from 2009 to first-half of palm oil in Malaysia and Indonesia and threatened soy of 2010. The average hedging effectiveness has decreased planting in South America. This event has caused the oil from 45.7373% in 2009 to 37.0261% in 2010. The value palm fruits shortage and higher CPO pricing volatility. declines further to only 34.2608% in the first six-month of Thus, these events have directly caused the uptrend of 2011. The average R-squared peaked in 2009 as 46.8777%, average hedging effectiveness level for the last quarter of it is later decreased to 36.8305% in 2010 and slightly
2010. reduced to 35.7213% in first-half of 2011. In the
Comparison of Quarterly Average in 2011: The uptrend and R-Squared in 2009, the average hedging effectiveness
movements of quarterly average of hedging ratio, hedging has decreased from the peak position (51.3776%) in first effectiveness and R-squared for the first and second quarter to the trough position of 42.6996% in second quarter of 2011 are plotted in Table 4.3. The hedging ratio quarter. The average R-squared is also showing a similar has moved up from 42.9205% in the first quarter to trend where the highest average R-squared is observed in 49.2378% in the second quarter. Meanwhile, average first quarter, which is 50.7144%. In 2010, the average hedging effectiveness and average R-squared also show hedging effectiveness peaks at 45.5965% in first quarter. the same uptrend pattern as average hedging ratio. Similarly, the average R-squared has dropped from the the first quarter to 44.3326% in the second quarter of 2011.
peak position (46.7949%) in the first quarter to the lowest 7. Dunis, C. and P. Lequeux, 2000. Intraday Data and point (29.4904%) in the third quarter. Furthermore, in 2011,
the average hedging effectiveness has increased from 26.2747% in first quarter to 42.2470% in second quarter. Average R-squared has also increased from 27.1100% in the first quarter to 44.3326% in the second quarter of 2011. The hedging effectiveness and R-squared that computed by using OLS Minimum-Variance hedging ratio models have shown similar hedging effectiveness level for the same FCPO contract. This result is in-line with previous study by Floros and Vougas [21] who have observed the behaviour of R-squared and hedging effectiveness in the study of Greek stock index futures market. In overall, Malaysia FCPO market only provides a low level of hedging effectiveness (19% - 53%) due to less volatility of CPO spot price. This result is also consistent with previous study by Zanotti, Gabbi and Geranio [24] in the study of European electricity futures markets.
As a conclusion, hedging effectiveness of crude palm oil futures market in Malaysia shows a low level of hedging effectiveness. This result indicates that the spot price of crude palm oil in Malaysia is relatively stable and consistent over the period of 2009 to 2011.
REFERENCE
1. Switzer, L.N. and M. El-Khoury, 2007. Extreme Volatility, Speculative Efficiency and the Hedging Effectiveness of the Oil Futures Markets. The Journal of Futures Markets, 27(1): 61-84.
2. Liew, K.Y. and R.D. Brooks, 1998. Returns and Volatility in the Kuala Lumpur Crude Palm Oil Futures Market. The Journal of Futures Markets, 18(8): 985-999.
3. Ahuja, N.L., 2006. Commodity Derivatives Market in India: Development, Regulation and Future Prospects - Issue 2. International Research Journal of Finance and Economics, pp: 153-162.
4. Ahmad, N., 2010. Impact of Automated Trading in the Crude Palm Oil Futures Market on its Underlying Spot Market - Issue 36. International Research Journal of Finace and Economics, pp: 46-58. 5. Hauser, R.J., P. Garcia and A.D. Tumblin, 1990. Basic
Expectations and Soybean Hedging Effectiveness. North Central Journal of Agricultural Economics, 12(1): 125-136.
6. Brailsford, T., K. Corrigan and R. Heaney, 2001. A Comparison of Measures of Hedging Effectiveness: a Case Study using the Australian All Ordinaries Share Price Index Futures Contract. Journal of Multinational Financial Management, 465-481.
Hedging Efficiency in Interest Spread Trading. The European Journal of Finance, pp: 332-352. 8. Gupta, K. and B. Singh, 2009. Estimating the Optimal
Hedge Ratio in the Indian Equity Futures Market . The IUP Journal of Financial Risk Management, VI:(3)&4: 38-98.
9. Ederington, L.H., 1979. The Hedging Performance of the New Futures Markets. Journal of Finance, 34: 157-170.
10. Figlewski, S., 1984. Hedging Performance and Basis Risk in Stock Index Futures. Journal of Finance, 39: 657-669.
11. Pennings, J.M. and M.T. Meulenberg, 1997. Hedging Efficiency: A Futures Exchange Management Approach. The Journal of futures Markets, pp: 599-615.
12. Howard, C. and L. D'Antonio, 1984. A Risk-Return measure of Hedging Effectiveness. Journal of Financial and Quantitative Analysis, 19: 101-112. 13. Holmes, P., 1996. Stock-Index Futures Hedging,
Duration Effects, Expiration Effects and Hedge Ratio Stability. Journal of Business Finance and Accounting, 23(1): 63-77.
14. Butterworth, D. and P. Holmes, 2001. The Effectiveness of Stock Index Fixtures: Evidence for the FTSE-100 and FTSE-mid250 Indexes Traded in the UK. Applied Financial Economics, 11: 57-68. 15. Koutmos, G.P., 1998. Dynamic Hedging of
Commercial Paper with T-bill Futures. Journal of Futures Market, 18(8): 925-938.
16. Lien, D.T., 1999. Fractional Cointegration and Futures Hedging. Journal of Futures Markets, 19(4): 457-474. 17. Myers, R., 2000. Estimating Time-Varying Optimal Hedge Ratios on Futures Markets. Journal of Futures Markets, 20(1): 73-87.
18. Brooks, C.C., 2001. The Cross-Currency Hedging Performance of Implied versus Statistical Forecasting Models. Journal of Futures Markets, 21(11): 1043-1069.
19. Castelino, M., 2000. Hedge Effectiveness: Basis Risk and Minimum-Variance Hedging. Journal of Futures Markets, 20: 89-103.
20. Ferguson, R.L., 1998. Are Regression Approach Futures Hedge Ratios Stationary? Journal of Futures Markets, 18(7): 851-866.
21. Floros, C. and D.V. Vougas, 2006. Hedging Effectiveness in Greek Stock Index Futures Market, 1999-2001. International Research Journal of Finance and Economics, 5: 1450-2887.
22. Lien, D. and L. Yang, 2008. Hedging with Chinese 25. Ripple, R.D. and I. A.Moosa, 2007. Hedging Metal Futures. Global Finance Journal, 19: 123-138. Effectiveness and Futures Contract Maturity: The 23. Kavussanos, M.G. and I.D. Visvikis, 2008. Hedging Case of NYMEX Crude Oil Futures. Applied Financial
Effectiveness of the Athens Stock Index Futures Economics, 17: 683-689. Contracts. The European Journal of Finance,
14(3): 243-270.
24. Zanotti, G., G. Gabbi and Geranio, 2010. Hedging with Futures: Efficacy of GARCH Correlation Models to European Electricity Markets. Journal of International Financial Markets, Institutions & Money, 20: 135-148.