Cross asset class applications of functional
data analysis: Evaluation with controls for
data snooping bias
Fearghal J. Kearney B.Sc.
Internal supervisor: Dr Mark Cummins, Dublin City University Business School External supervisor: Dr Finbarr Murphy, Kemmy Business School, University of Limerick
December 2014
A thesis submitted to Dublin City University Business School in partial fullment of the requirements for the degree of Doctor of Philosophy
Declaration
I hereby certify that this material, which I now submit for assessment on the programme of study leading to the award of Doctor of Philosophy is entirely my own work, and that I have exercised reasonable care to ensure that the work is original, and does not to the best of my knowledge breach any law of copyright, and has not been taken from the work of others save and to the extent that such work has been cited and acknowledged within the text of my work.
Signed: ___________________ ID No.: 56372201
Acknowledgments
I am indebted to my supervisors, Dr Mark Cummins and Dr Finbarr Murphy. Mark and Finbarr have provided great support and guidance during the past three years, both in relation to this thesis and my broader academic training. They have helped to dramatically improve my writing and analytical skills. It has been a pleasure working with them both. The nancial support of DCU Business School and the Irish Accounting and Finance Association is gratefully acknowledged. I would like to thank Professor Liam Gallagher, Professor Ronan Powell, Professor Brian O'Kelly, Dr Hiroyuki Kawakstu, Dr Michael Dowl-ing, Mr Billy Kelly, Professor Ana-Maria Fuertes, Professor William Bertin, Mr Daire Mc-Coy, and Dr Surajit Ray for their comments, advice, and guidance during my studies. I reserve special thanks for Dr Teresa Hogan who consistently went beyond the call of duty in her former role as Director of Doctoral Studies.
I would like to thank my family, Paddy, Eileen, Cormac, Dearbhla, and Donncha for their emotional and nancial support. I am eternally grateful to my late brother Cian, who I miss each and every day, for the many nights he pulled up a chair, characteristically exuding patience and logic, just as the search for the correct integration substitution turned from challenge to frustration. Finally, I thank Davina for her warmth, friendship and love.
Contents
1 Introduction 1
1.1 Introduction . . . 1
1.2 Context and motivation . . . 1
1.3 Contribution . . . 3
1.3.1 Research questions . . . 3
1.3.2 Chapter outline . . . 6
1.4 Research dissemination . . . 9
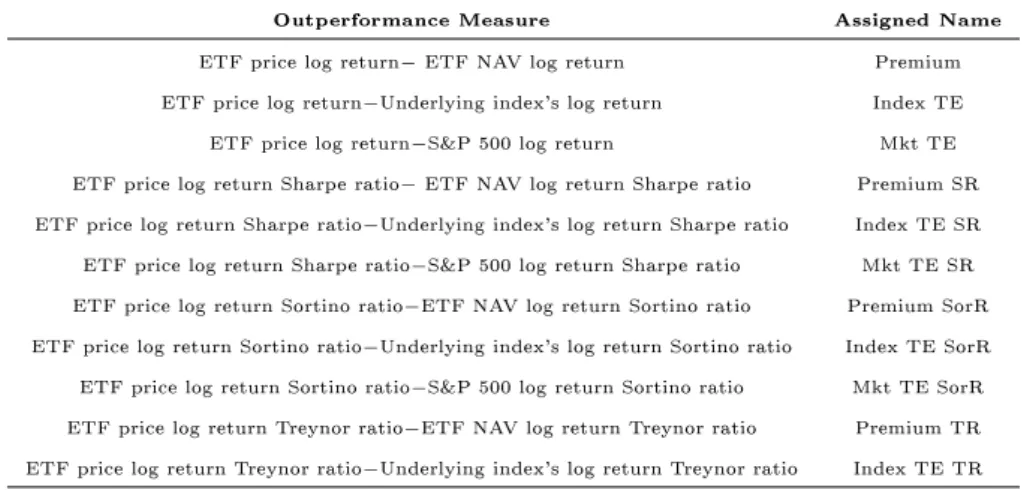
2 Outperformance in exchange-traded fund pricing deviations: Generalised control of data snooping bias 10 2.1 Introduction . . . 10
2.2 Outperformance . . . 14
2.3 Multiple hypothesis testing: data snooping bias . . . 16
2.3.1 Single-step procedure . . . 17
2.3.2 Balanced stepdown procedure . . . 18
2.3.2.1 Operative method . . . 20
2.4 Empirical analysis: framework and data . . . 21
2.5 Empirical analysis: results . . . 24
2.6 Conclusion . . . 27
3 An analysis of implied volatility jump dynamics: Novel functional data representation in crude oil markets 38 3.1 Introduction . . . 38
3.2 Methodology . . . 41
3.2.1 Implied volatility curve shape . . . 41
3.2.2 Functional data representation . . . 41
3.2.3 Merton model . . . 45
3.2.4 Delta hedging application . . . 48
3.3 Data set . . . 49
3.4 Empirical results . . . 49
3.4.1 Impact of economic factors on implied volatility . . . 49
3.4.2 Delta hedging performance . . . 54
3.5 Conclusion . . . 57
4 Forecasting implied volatility in foreign exchange markets: A robust functional linear model approach 59 4.1 Introduction . . . 59
4.2 Methodology . . . 61
4.2.1.1 Smoothing parameter . . . 63
4.2.2 Functional linear model . . . 63
4.2.2.1 Scalar response model . . . 64
4.2.2.2 Fully functional model . . . 65
4.2.3 Forecast evaluation . . . 66
4.3 Multiple hypothesis testing . . . 68
4.4 Data description . . . 69
4.5 Empirical results . . . 70
4.5.1 In-sample functional linear model t . . . 70
4.5.2 Out-of-sample forecast evaluation . . . 72
4.6 Conclusion . . . 75
5 Extracting FX forward rate term structure information: Merits of a functional method 77 5.1 Introduction . . . 77
5.2 Risk neutral ecient market hypothesis . . . 79
5.3 Methodology . . . 80
5.3.1 Scalar response model . . . 80
5.3.2 Clarida and Taylor (1997) VECM . . . 83
5.3.3 Forecast evaluation . . . 84
5.3.4 Multiple hypothesis testing . . . 85
5.4 Data and empirical results . . . 87
5.4.1 Data . . . 87 5.4.2 Numerical comparison . . . 87 5.4.3 Hypothesis tests . . . 90 5.5 Conclusion . . . 94 6 Conclusion 95 Bibliography 98
List of Figures
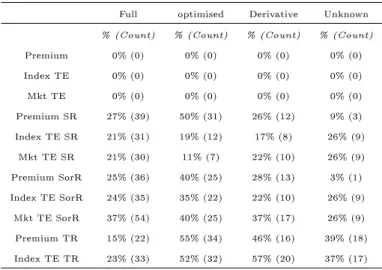
2.1 % of ETFs with specic outperformance measures . . . 34
2.2 % of ETFs displaying outperformance by geographic focus . . . 36
2.3 % of ETFs displaying outperformance by industry focus . . . 36
2.4 % of ETFs displaying outperformance by replication type/asset class focus . 37 3.1 Typical crude oil implied volatility curve (11th June 2010) . . . 42
3.2 Implied volatility curve derived from various Merton model kHat levels . . . 47
3.3 Crude oil implied volatility over time [2007-2013] . . . 50
3.4 Crude oil implied volatility slope 2007-2013 . . . 51
3.5 Crude oil implied volatility curvature 2007-2013 . . . 52
3.6 ˆkproxy used over time . . . 54
4.1 Fully functional model tting bivariate regression coecient . . . 71
4.2 Scalar response model tting regression coecient . . . 72
List of Tables
2.1 Data set properties . . . 29
2.2 Outperformance measures . . . 29
2.3 Signicant sample summary statistics . . . 30
2.6 ETFs outperformance by replication type . . . 30
2.4 ETF outperformance by geographic focus . . . 31
2.5 ETF outperformance by industry . . . 32
2.7 ETFs displaying specic outperformance by asset class . . . 33
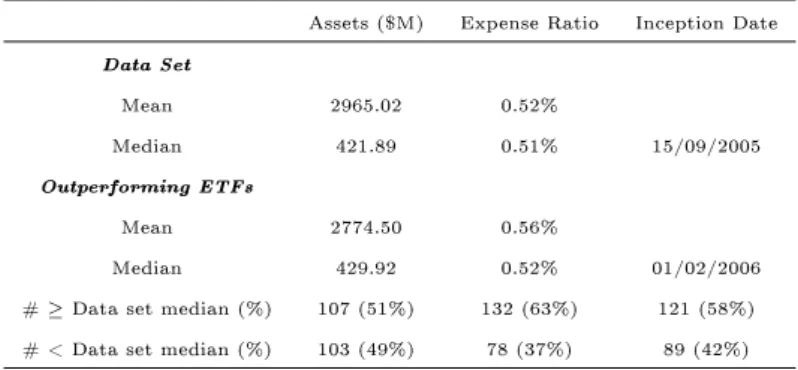
2.8 Outperformance by asset/ER/inception date . . . 33
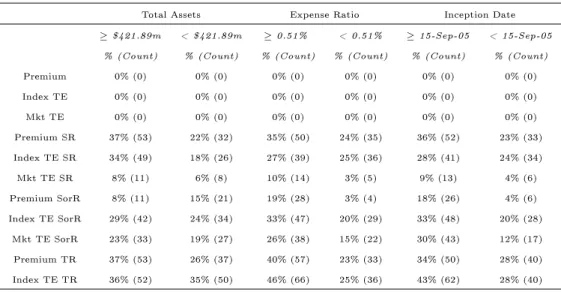
2.9 ETFs outperformance by total assets/expense ratio/inception date . . . 34
2.10 Top 10 ETFs by mean daily outperformance . . . 35
3.1 Delta hedging results . . . 56
4.1 Fully functional model tting R2 statistic values . . . 73
4.2 Scalar response model (SR) tting R2 statistic and F-Ratio values . . . 74
4.3 Scalar response (SR), AR, GARCH, and ARFIMA models out-of-sample forecast evaluation measures (Delta=50) . . . 75
5.1 Results of forecasting exercises: Dollar-Euro . . . 88
5.2 Results of forecasting exercises: Dollar-Sterling . . . 88
5.3 Results of forecasting exercises: Dollar-Yen . . . 89
5.4 Signicant outperformance: Dollar-Euro . . . 91
5.5 Signicant outperformance: Dollar-Sterling . . . 92
5.6 Signicant outperformance: Dollar-Yen . . . 93
1 Scalar response (SR), AR, GARCH, and ARFIMA models out-of-sample forecast evaluation measures (Delta=10) . . . 106
2 Scalar response (SR), AR, GARCH, and ARFIMA models out-of-sample forecast evaluation measures (Delta=25) . . . 106
3 Scalar response (SR), AR, GARCH, and ARFIMA models out-of-sample forecast evaluation measures (Delta=75) . . . 107
4 Scalar response (SR), AR, GARCH, and ARFIMA models out-of-sample forecast evaluation measures (Delta=90) . . . 107
Cross asset class applications of functional data
analysis: Evaluation with controls for data
snooping bias
Fearghal J. Kearney
Abstract
This thesis applies functional data analysis techniques to address a number of specic research questions in nancial markets. Data snooping bias controls are adopted in parallel to provide statistical robustness to our inferences. Firstly, we conduct an investigation into U.S. exchange-traded fund outperformance during the 2008-2012 period. The funds are tested for net asset value premium, underlying index and market benchmark outperfor-mance. The study serves as a platform to showcase the data snooping bias problem and application of generalised multiple hypothesis testing techniques, in advance of their use for functional data analysis evaluation. Secondly, as the rst application of functional data analysis, we examine implied volatility, jump risk, and pricing dynamics within crude oil markets. Strong evidence is found of converse jump dynamics during periods of demand and supply side weakness. Next, we demonstrate the performance advantage over traditional benchmarks of adopting a functional linear model to forecast EUR-USD implied volatil-ity. Our ndings are shown to be robust across various moneyness segments, contract maturities and out-of-sample window lengths. The nal chapter also uses a functional data framework to produce forecasts, demonstrating how information can be extracted from forward contracts to predict future spot foreign exchange rates. The evaluation of an out-of-sample framework leads to near systematic outperformance in terms of a direct comparison of performance measures, versus both the restricted vector error correction model and random walk. Overall, this thesis highlights the usefulness of adopting insight-ful and novel functional data analysis techniques across various asset classes where multiple hypothesis testing controls provide robustness around our conclusions. Each of the studies contributes to the literature individually, with the collection emphasising the benets of adopting functional approaches to tackle a wide range of empirical nance problems.
Chapter 1
Introduction
1.1 Introduction
The core contribution of the thesis is the proposed use of functional data analysis (FDA) techniques in a cross-security nancial setting. Multiple hypothesis testing (MHT) controls are adopted in parallel to robustly identify instances of outperformance. We demonstrate the power and exibility of the statistical techniques by applying them across four distinct asset classes, namely, exchange-traded funds (ETFs), crude oil options, foreign exchange implied volatility, and foreign exchange forward rate term structure. We outline the use of recent innovations in controlling for the MHT problem when seeking to identify ETF outperformance and use functional data analysis techniques to examine implied volatility, jump risk, and pricing dynamics within crude oil markets. Furthermore, we combine both FDA and MHT techniques to characterise and forecast underlying processes; forecasting EUR-USD implied volatility and extracting the informational content from the forward rate term structure for multiple currencies.
1.2 Context and motivation
Functional data analysis (FDA) provides a framework to produce and interpret func-tional representations of the process underlying a data set. Funcfunc-tional data analysis begins with the assumption that there exists an underlying function that generates the observa-tions. In addition, it is assumed that the underlying function is smooth in some sense, so that there is a link between consecutive observations. The process is dened over a con-tinuum, where continuum values are generally represented in terms of time or space. This continuous property distinguishes FDA from other common multivariate techniques which seek to model and forecast nancial processes based solely on the discrete observations observed in the data set. In this thesis the functions are dened over the domain spanned by both the moneyness and deltas of option contracts, and the tenors of forward contracts. The resultant functions serve to characterise the implied volatility curve and forward rate term structure.
Functional data analysis is adopted for this thesis as it boasts many advantages; it accurately captures underlying smooth process dynamics, there is no assumed parametric structure, it is computationally ecient, and it results in a representation that can be evaluated on an arbitrarily ne grid (Ramsay and Silverman 2005). Another signicant feature that we exploit to obtain a proxy for jump risk, is that the continuous function can be dierentiated at any point to obtain the slope and other higher order derivatives. Func-tional variants of many tradiFunc-tional multivariate techniques are available with a number of applications in the bio-mechanical literature benetting from functional data frameworks. However, it has only recently been exploited for nancial analysis with studies by Benko et al. (2009) and Muller et al. (2011) highlighting its usefulness in characterising implied and realised volatility processes, respectively. We adopt a distinct functional framework to also forecast implied volatility, and further employ functional techniques to characterise the forward rate term structure in foreign exchange markets. The framework can be used as an exploratory tool to represent and analyse a nancial data set in innite dimensional space, such as conducted for crude oil options but also to predict the future evolution of nancial market processes.
When constructing a functional data object, a vector of n bases, denoted φ1, ..., φn,
must rst be specied. The decision of which basis system to specify is driven by the underlying data's known characteristics. For instance, when modelling periodic data, a Fourier basis expansion, comprised of successive sine/cosine terms, is most commonly ap-plied. However, neither the implied volatility or forward curves exhibit strong cyclical variation, so we choose exible B-splines for the basis function system. B-spline represen-tation oers a number of strengths, as outlined in de Boor (2001). They are essentially a number of polynomials joined together smoothly at xed points called knots. The number and positioning of the knots are derived from knowledge of the complexity of the under-lying process over particular ranges. Computations with B-splines are extremely ecient as at any one point along the curve they simplify to a polynomial that can be easily eval-uated. Adjusting the order of the spline allows for the estimation of derivatives of any degree. Functional structures are approximated as a weighted linear combination of these bases. We employ a number of distinct functional regression specications to forecast these structures. Classical linear models seek to describe the dependency between a response variable and a specied set of predictors. In classical regression, scalar values are used for both the explanatory and response variables. However, in functional linear regression at least one of the observed variables is a curve.
The motivation for incorporating multiple hypothesis testing controls is to account for the issue of data snooping bias. This ensure that the conclusions drawn around the use of our functional data frameworks in the applied studies are as robust as possible. Data snooping bias, in this context, is the problem whereby under näive analysis statistically signicant outperformance relationships may be identied by pure chance alone. When conducting a number of hypothesis tests simultaneously on the same data set one runs the risk of uncovering random artefacts as statistically signicant relationships. This is
due to inherent correlations observed between members of any random data set. The false discovery of such random artefacts can inhibit risk management and the pricing and hedging of derivatives. Data snooping bias links directly to the broader issue of multiple hypothesis testing in statistical and econometric applications where the issue is commonly referred to as the multiple comparisons problem. Data snooping bias is well addressed in scientic and medical elds but largely ignored in empirical nance literature. A number of quantitative studies employ such procedures. Sullivan and Timmermann (1999), Hsu and Kuan (2005), Park and Irwin (2007), Marshall et al. (2008), and Qui and Wu (2008) apply the reality check bootstrap test of White (2000) to evaluate the protability of a wide range of technical trading rules commonly used in industry. Further to this, Hsu et al. (2010) employ a stepwise extension of the superior predictability test of Hansen (2005) to re-evaluate the protability of technical trading rules. The methodologies used in previous studies raise concerns around the validity of the inferences drawn, insofar as they lack data snooping bias controls and in many cases conduct less formal hypothesis tests. This can greatly mislead an investor's portfolio selection. Addressing this issue is important as it calls into question, and potentially undermines, the ndings and conclusions in the literature. A major contribution of the thesis to the literature is the utilisation of a generalised data snooping bias procedure in the performance appraisal setting. We apply the generalised balanced stepdown procedure of Romano and Wolf (2010), which serves as an improvement over the more conservative seminal reality check bootstrap test of White (2000) and the superior predictive ability test of Hansen (2005). The generalised balanced stepdown procedure of Romano and Wolf (2010) boasts a greater ability to reject false null hypotheses as well as oering balance in the sense that all hypotheses are treated equally in terms of power. It also allows for subsequent iterative steps to identify additional hypothesis rejections. The technique is outlined in Chapter 2, and is also applied in Chapters 4 and 5.
1.3 Contribution
1.3.1 Research questions
We will now outline the reasons for our choice of asset class concentrations and research questions. Exchange-traded funds (ETFs) are variants of mutual funds that rst came to prominence in the early 1990s. ETFs allow market participants to trade index portfolios, similar to how individual investors trade shares of a stock. They seek to track the value and volatility of an underlying benchmark index through the construction of portfolios replicative of the index's constituents. They were rst traded on the Toronto Stock Ex-change in 1989 and today's market boasts over 1,220 U.S. traded ETFs.1 In relation to the
analysis of ETF outperformance, the majority of research conducted to date has centered on data sets comprising small numbers of large ETFs, single ETF families or industries,
1Investment company institute June 2012 ETF report:
with measurements being applied inconsistently across the diering studies, inhibiting ef-fective cross comparison. This thesis amends that, primarily through the use of a large, diverse sample size, which incorporates many sectoral and internationally focused indices. We investigate a large number of ETF attributes and their ability to dictate net asset value premium, underlying index and market benchmark outperformance. The eect of replication type and asset class focus on ETF performance for instance has not been rig-orously tested in the literature and as such we incrementally contribute in this way. This work may be of interest to a variety of stakeholders. Firstly, investigating ETF outper-formance is signicant from an academic perspective as it furthers our understanding of the market's pricing dynamics. Secondly, the wider investment community would benet from the work as an aid in identifying specic ETF cohorts suitable to individual portfolio requirements. Lastly, despite it not being the primary focus of this study, the data snoop-ing bias issues raised oer broader insights to arbitrageurs by emphasissnoop-ing the importance of controlling for data snooping bias in order to robustly identify mispricings and trading signals.
Oil futures are the most actively traded commodity derivatives. An average of one million light sweet crude oil futures and option contracts are traded every day according to the CME group.2 The past 10 years have seen elevated levels of price volatility in these
markets. Strong economic pressures have been observed on both the demand side and the supply side, during the global nancial crisis and the Arab Spring respectively. Increased price volatility in oil markets causes profound economic management and socio-political issues, not only impacting those participants who invest directly in commodities but also the consumers of rened oil products. There is a large body of literature demonstrating the importance of incorporating jumps into models seeking to capture risk premia and economic shocks. Traditional geometric Brownian motion based models, such as Black and Scholes' (1973) diusion model, do not capture price jumps, which are movements that become more prevalent during periods of increased market turbulence. For this reason we employ the use of the Merton (1976) model in line with Yan (2011). Yan (2011) proposes the use of implied volatility slope information to estimate jump risk. He shows, both directly and indirectly, the applicability of the at-the-money implied volatility slope as a proxy for the average jump amplitude in equity markets. We seek to answer a similar question in crude oil markets. Further contributions relate to the employment of FDA-obtained Merton model parameters for portfolio hedging where we compare the calculated results with the standard Black-Scholes delta hedging strategy.
Observed implied volatility diers across option contracts, dependent on both money-ness and expiry date. As well as being a transformation of the option price, and a key parameter in many asset pricing formulae, implied volatility is also of interest due to its informational content (see Corrado and Miller 2006, Taylor et al. 2010, Muzzioli 2010, and Garvey and Gallagher 2012). Yu et al. (2010) demonstrate this by nding superior results using implied volatility to predict future return volatility of stock index options,
when compared to traditional benchmark models in over-the-counter (OTC) and exchange markets. One such OTC market is that of foreign exchange (FX) options. FX is the largest asset class in the world with the Bank for International Settlements reporting that trading levels in FX markets averaged $5.3 trillion per day.3 Many stakeholders are exposed to FX
risk including banks, speculators, traders, multinational rms, importers, and exporters. Modelling foreign currency cash ows, investment decisions, and hedging strategies, are all greatly dependent on expectations of future FX movements. Relative to previous studies forecasting the volatility of returns, there is a relative paucity of literature predicting the evolution of implied volatility.
We add to the existing FX implied volatility literature through the novel proposal of a functional data analysis-based forecasting model to predict the evolution of the implied volatility function. The aim is to determine and forecast the function that characterises the implied volatility relationship among option contracts. Both the scalar response/functional explanatory and functional explanatory/functional response linear models of Ramsay and Silverman (2005) are utilised for the analysis, with the forecasts compared to traditionally proposed benchmarks of Gonclaves and Guidolin (2006) and Konstantinidi et al. (2008), in an out-of-sample testing framework. We not only contribute from an academic per-spective, where insights into the dynamics of implied volatility aid our understanding of option markets, but also from a market practitioner perspective, due to the study's po-tential hedging and speculation implications. We contribute further by incorporating the use of a contributory data vendor. This mitigates the idiosyncratic risk, as highlighted by Chalamandaris and Tsekrekos (2014), associated with obtaining quotes from a single market participant.
Meese and Rogo (1983a,b) ascertain that standard exchange rate models do not have the ability to beat forecasts implied by the random walk in the short run. In an attempt to explain this, Engel and West (2005) and Engel et al. (2008) demonstrate that such models imply a near random walk process for the exchange rate, so their power to beat the random walk in out-of-sample forecasts is low. Furthermore, it has been demonstrated that the forward rate is not the optimal predictor of future spot rates (Hansen and Hodrick 1980, Frankel 1980, Bilson 1981, Frankel and Rose 1995, and Taylor 1995). Despite this, the question as to whether or not there is information imbedded in forward FX rates persists. Clarida and Taylor (1997) seek to answer this by moving beyond such single-equation methods and conclude that forward premia information is in fact considerable. Their restricted vector error correction model (VECM) constitutes the leading challenger to the seminal work of Meese and Rogo (1983a,b). The approach is applied in a dynamic out-of-sample forecasting framework resulting in root mean squared error and mean absolute error metrics over 50% lower than those implied by the random walk. The results are conrmed by Clarida et al. (2003) and Sager and Taylor (2014), who establish statistically signicant outperformance across dierent data sets. Our study adds to the existing literature seeking to extract the informational content of forward foreign exchange rates through the novel
proposal of a functional data analysis-based forecasting model.
In relation to extracting the informational content of the FX forward curve, we con-tribute by moving the problem to a functional space to improve on the forecasting perfor-mance achieved by previous leading benchmark models. To this aim, we adopt the scalar response model proposed in Ramsay and Silverman (2005) where the innite dimensional beta coecient is specied with a functional principal component basis to solve the under-determination issue. Specically, we determine the underlying process that characterises the forward rate term structure to establish dependency relations between forward rates and future spot exchange rates. The exible functional data approach accurately captures the forward rate term structure process, whilst mitigating the need to impose restrictive data structure assumptions on the exchange rate system. For comparative purposes with previous studies, we initially present a direct comparison of forecasting performance mea-sures. However, we then apply formal tests to identify instances of statistically signicant outperformance for the scalar response model over both the VECM and random walk benchmarks. We rst test the hypothesis of forecasting outperformance by implementing a simple t-test of performance measures dierentials. In an important extension of the
literature we contribute by incorporating controls for the multiple comparisons problem in testing forecast performance. Further to this, our framework tests if exchange rates are in fact predictable and if the simple risk neutral ecient market hypothesis holds.
1.3.2 Chapter outline
Chapter 2, Outperformance in exchange-traded fund pricing deviations: Generalised con-trol of data snooping bias, conducts an investigation into exchange-traded fund (ETF) outperformance during the 2008-2012 period, utilising a data set of 288 U.S. traded secu-rities. ETFs are tested for net asset value (NAV) premium, underlying index and market benchmark outperformance, with Sharpe, Treynor, and Sortino ratios employed as risk-adjusted performance measures. A key contribution is the application of an innovative generalised stepdown procedure in controlling for data snooping bias.
Chapter 2 key questions:
• What ETFs display a net asset value premium? • What ETFs outperform their underlying index? • What ETFs outperform market wide benchmarks?
• How do specic groupings of ETFs dier in terms of outperformance?
• Energy, Precious Metals, Real Estate and Leisure industries beat the market on a
risk adjusted basis.
• Powershares DB Silver and iShares Silver Trust substantially outperform.
• 63% and 79% of Global and International ETFs respectively, show premium Sharpe
Ratio outperformance with only 10% for US funds.
• ETFs exhibiting high expense ratios or recent inception dates have a greater tendency
to outperform their index.
Chapter 3, An analysis of implied volatility jump dynamics: Novel functional data repre-sentation in crude oil markets, proposes a framework to produce and interpret functional objects that characterise the underlying dynamics of oil future options. The functional data analysis framework is used to examine implied volatility, jump risk, and pricing dynamics within crude oil markets. Examining a WTI crude oil sample for the 2007-2013 period, which includes the global nancial crisis and the Arab Spring, strong evidence is found of converse jump dynamics during periods of demand and supply side weakness. This is used as a basis for an FDA-derived Merton (1976) jump diusion optimised delta hedging strategy, which exhibits superior portfolio management results over traditional methods.
Chapter 3 key questions:
• What is the link between the shape of the implied volatility smile and underlying
economic events in crude oil markets?
• Does the implied volatility curve slope contain information useful in specifying the
average jump amplitude for crude oil options, in a similar manner to what Yan (2011) has shown to be the case for stock returns?
• Can information contained in the implied volatility smile slope be exploited to
im-prove portfolio hedging techniques?
Chapter 3 key ndings:
• Strong evidence is found of converse jump dynamics during periods of demand and
supply side weakness
• An FDA-derived Merton (1976) jump diusion optimised delta hedging strategy
exhibits superior portfolio management results over traditional methods
Chapter 4, Forecasting implied volatility in foreign exchange markets: A robust functional linear model approach, utilises functional data analysis techniques to characterise and forecast implied volatility in foreign exchange markets. The process of interest in this study is that of the EUR-USD daily implied volatility curve. Superior prediction of the evolution
of the implied volatility process is exhibited. This evaluation is performed under a rigorous out-of-sample testing framework that controls for the multiple comparisons problem.
Chapter 4 key questions:
• Can functional linear model techniques be used to characterise and forecast implied
volatility in foreign exchange markets?
• How does the performance of the functional data analysis approach compare to
tra-ditionally employed benchmark models of Gonclaves and Guidolin (2006) and Kon-stantinidi et al. (2008)?
• Are the ndings robust across various moneyness segments, contract maturities and
out-of-sample window lengths?
Chapter 4 key ndings:
• Our FDA techniques uncover predictable patterns in implied volatility
• We robustly demonstrate the performance advantage of adopting an FDA framework
when predicting future implied volatility
• We empirically demonstrate that the specication of a scalar response model provides
a superior implied volatility t over the fully functional model.
Chapter 5, Extracting FX forward rate term structure information: Merits of a functional method, seeks to extract the informational content of the forward rate term structure through the implementation of a functional principal component-based scalar response model. The diculty of beating the random walk in forecasting spot FX rates is well documented, with the restricted VECM of Clarida and Taylor (1997) providing the primary challenge. Our out-of-sample framework leads to near systematic outperformance in terms of a direct comparison of performance measures, versus both the VECM and random walk.
Chapter 5 key questions:
• Can we extract the informational content of forward foreign exchange rates through
a functional PCA-based forecasting model?
• How does the performance of the functional PCA-based approach compare with both
the random walk and the Clarida and Taylor (1997) VECM?
• Does the forward rate term structure contain information about the evolution of spot
exchange rates?
• Our scalar response model leads to near systematic outperformance in terms of a
direct comparison of performance measures, coupled with multiple instances of truly signicant outperformance versus both the random walk and Clarida and Taylor (1997) VECM
• Our results indicate that the forward rate term structure contains statistically
sig-nicant information about the evolution of the spot exchange rate
• We provide additional evidence supporting the rejection of the simple risk neutral
ecient market hypothesis
Chapter 6 outlines the major conclusions drawn from the work.
1.4 Research dissemination
This thesis resulted in a paper that was published in the Journal of Financial Markets; Kearney, F., M. Cummins, and F. Murphy. 2014. Outperformance in exchange-traded fund pricing deviations: Generalized control of data snooping bias. Journal of Financial Markets 19:86-109. A manuscript based on Chapter 3 received a revise and resubmit decision from The North American Journal of Economics and Finance (ranked 16th/89 in the Business, Finance category of the Thomson Reuters ISI list). It has since been amended, in line with the version presented here and will be resubmitted in the near future. Chapters 4 and 5, Forecasting implied volatility in foreign exchange markets: A robust functional linear model approach and Extracting FX Forward Rate Term Structure Information: Merits of a Functional Method, are both working papers and will be submitted soon. Research from this thesis have been presented at the Inniti Conference, Prato 2014, the Inniti Conference, Aix-en-Provence 2013, the Irish Society of New Economists (ISNE) Conference, UCC 2012, the ISNE Conference, NUIM 2013, the ISNE Conference, NUIG 2014, the DCU brown bag seminar, and the DCU doctoral colloquium. This research also resulted in the award of the DCU Business School scholarship and separately, in the receipt of the Irish Accounting and Finance Association research funding bursary.
Chapter 2
Outperformance in exchange-traded
fund pricing deviations: Generalised
control of data snooping bias
2.1 Introduction
Exchange-Traded Funds (ETFs) are variants of mutual funds that rst came to promi-nence in the early 1990s. ETFs allow market participants to trade index portfolios, similar to how individual investors trade shares of a stock. They seek to track the value and volatility of an underlying benchmark index through the construction of portfolios replica-tive of the index's constituents. They were rst traded on the Toronto Stock Exchange in 1989 and today's market boasts over 1,220 U.S. traded ETFs.1 Investors seeking ETF
outperformance may be tempted to apply a number of performance measures to a large data set of ETFs in order to test for those that are protable. Given enough tests, they are virtually certain to uncover individually signicant ETFs and may näively use these as a basis for portfolio selection decisions. However, in such a set-up, there is a likelihood that these seemingly signicant outperformers are due to mere chance alone. As the number of simultaneous tests conducted increases so too does the likelihood of such false discoveries. This issue is known as data snooping bias and must be controlled for when studying ETF outperformance. A key contribution in this study is the use of an innovative procedure, proposed in the literature, to control for this problem. The paper further uses an extensive ETF database that oers signicant geographic and sector coverage. In this way, the paper provides robust rst stage guidance to investors of where ineciencies may be and, accord-ingly, where ETFs may provide some investment advantages. The main item of note from the implementation is that, when performance is analysed on a non-risk-adjusted basis only, no funds in the sample are identied as displaying any measure of outperformance.
1Investment company institute June 2012 ETF report:
It is only the risk-adjusted performance measures that give statistically signicant outper-formance results and so the insights from these results dominate the commentary. The key takeaways from the study are, rstly, a high proportion of optimised replication, debt asset class, and global/international ETFs exhibit risk-adjusted premiums, highlighting redemption in kind ineciencies. Secondly, cross-sector and sectoral funds display broadly the same percentage of outperformance. Lastly, high expense ratio and recent inception date ETFs are more likely to exhibit index outperformance, which is of interest to investors seeking to outperform their benchmarks.
The reason for the growth in popularity of ETFs over recent years can be attributed to a number of advantages that they oer over other index-linked products. Tax eciency and lower expenses are the two most frequently mooted draws for investors, with another being smaller transaction quantities than equivalent futures products, a feature allowing retail investors the opportunity to participate in the market. Empirical studies on active mutual funds have found that, on average, they do not produce above normal returns. Malkiel (1995) and Gruber (1996) show that this inability to beat the market is primarily due to the level of management expenses charged. This performance outcome has increased interest in passive market tracking funds. ETFs aim to replicate index performance but with lower transaction costs and greater tax eciency than observed in comparable mutual funds. Actively managed ETFs, whose goal is to realise above market returns, only release information on their specic holdings at an end-of-day frequency, whereas the weighted constituents of the passively managed ETFs are always known. Rompotis (2011) cites this as a reason why passive ETFs are advantageous in the eyes of potential arbitrageurs and for their retention as the more popular ETF type. Other miscellaneous strengths of ETFs that have contributed to their rise in popularity have been explicitly identied. Firstly, ETFs provide diversication satisfying broad exposure, be it marketwide or sectoral coverage, with sectoral ETFs facilitating hedging requirements. Secondly, Yu (2005) and Alexander and Barbosa (2008) observe that ETFs do not have short selling restrictions in the same manner as regular stocks so they may be more useful for hedging. Lastly, ETFs are not subject to the uptick rule, which Curcio et al. (2004) suggest as another benet for shareholders.
A set of 288 U.S. traded ETFs is evaluated in this study using hypothesis tests that seek to identify those that outperform their net asset value (NAV), their underlying index, or a market benchmark. A major contribution to the literature here is the utilisation of a generalised data snooping bias procedure in the ETF performance appraisal setting. Data snooping bias, in this context, is the problem whereby under näive analysis statistically sig-nicant outperformance relationships may be identied by pure chance alone. Controlling for data snooping bias is important in order to obtain greater levels of condence when analysing ETF performance. The false discovery of such random artefacts can greatly mislead an investor's portfolio selection.
Data snooping bias links directly to the broader issue of multiple hypothesis testing in statistical and econometric applications where the issue is commonly referred to as the
multiple comparisons problem. This problem is well addressed in the scientic and medical elds but largely ignored in the empirical nance literature. This paper contributes to the empirical research on ETFs by applying the generalised balanced stepdown procedure of Romano and Wolf (2010), which serves as an improvement over the more conservative seminal reality check bootstrap test of White (2000) and the superior predictive ability test of Hansen (2005). The generalised balanced stepdown procedure of Romano and Wolf (2010) boasts a greater ability to reject false null hypotheses as well as oering balance in the sense that all hypotheses are treated equally in terms of power.
A number of quantitative studies employ such procedures to control for data snooping bias. Sullivan and Timmermann (1999), Hsu and Kuan (2005), Park and Irwin (2007), Marshall et al. (2008) and Qui and Wu (2008) apply the reality check bootstrap test of White (2000) to evaluate the protability of a wide range of technical trading rules commonly used in industry. Qui and Wu (2008) analyse foreign exchange markets while Marshall et al. (2008) considering a data set of 15 commodities. Hsu et al. (2010) employ a stepwise extension of the superior predictability test of Hansen (2005) to re-evaluate the protability of technical trading rules, with Bajgrowicz and Scaillet (2012) utilising a false discovery rate (i.e., the proportion of false discoveries to the total number of signicant hypothesis tests identied) approach to analyse technical trading rules applied to stock returns. Controlling for data snooping bias in a statistical arbitrage setting, Cummins and Bucca (2012) provide a practical comparison of the stepwise procedure of Romano and Wolf (2007) and the balanced stepdown procedure of Romano and Wolf (2010). They nd that the balanced stepdown procedure is unbiased in its approach and is shown to identify many more protable trading strategies compared to the non-balanced stepdown procedure.
An acknowledgment of this multiple comparisons issue can be seen in both the hedge and mutual fund performance literature but this is not the case for ETFs. In assessing hedge fund performance, Criton and Scaillet (2011) use the false discovery rate to control for data snooping bias. Cuthbertson et al. (2008) and Barras et al. (2010) also utilise the false discovery rate in order to nd the proportion of lucky mutual funds amongst those with signicant individual alphas. However, unless the false discovery rate is zero, it is not possible to identify which of the individual funds are genuinely outperforming. This study signicantly extends this literature, incorporating the more recent balanced stepdown procedure of Romano and Wolf (2010) and applying this in the ETF realm to identify both individual ETFs and ETF cohorts that outperform. The Romano and Wolf (2010) procedure further works on the generalised familywise error rate rather than the false discovery rate the former being the actual number of false discoveries from the set of all true hypotheses.
The methodologies used in previous ETF studies raise concerns around the validity of the inferences drawn, insofar as they lack data snooping bias controls and in many cases conduct less formal hypothesis tests. This can greatly mislead an investor's portfo-lio selection. Addressing this issue is important as it calls into question, and potentially
undermines, the ndings and conclusions in the literature. The major argument of this paper is therefore that in order for one to be robustly condent of one's ETF performance conclusions, one must control for the multiple comparisons problem. The robustness of one's economic arguments is intrinsically linked to the robustness of the econometric anal-ysis. This requires a fundamental shift in the way that ETF performance is analysed econometrically; a fundamental shift that is equally required in the mainstream empirical nance literature. The majority of research conducted to date has centred on data sets comprising small numbers of large ETFs, single ETF families or industries, with measure-ments being applied inconsistently across the diering studies, inhibiting eective cross comparison. This body of work amends that, primarily through the use of a large, diverse sample size, which incorporates many sectoral and internationally focused indices. We in-vestigate numerous ETF attributes and their ability to dictate outperformance, alongside including a recent time period. The eect of replication type and asset class focus on ETF performance for instance has not been rigorously tested in the literature and as such this study incrementally contributes in this way. This work may be of interest to a variety of stakeholders. Firstly, investigating ETF outperformance is signicant from an academic perspective as it furthers our understanding of the market's pricing dynamics. Secondly, the wider investment community would benet from the work as an aid in identifying specic ETF cohorts suitable to individual portfolio requirements. Lastly, despite it not being the focus of this study, the data snooping bias issues raised oer broader insights to arbitrageurs by emphasising the importance of controlling for data snooping bias in order to robustly identify mispricings and trading signals.
The remainder of the paper is organised as follows. In Section 2.2 we discuss in-kind deviations along with performance dierences between ETF prices, underlying indices, and a market benchmark. In section 5.3.4 we discuss the issue of data snooping bias and link this to the broader issue of multiple hypothesis testing. We also discuss the details of the balanced stepdown procedure of Romano and Wolf (2010), along with the associated operative method that allows for computational eciency. The empirical analysis is out-lined in Section 2.4, where we describe the data set and dene the formal hypothesis tests. Section 2.5 presents the results of the empirical analysis and considers various attributes of outperforming funds. Section 5.5 concludes.
Summary of contributions
• What ETFs display a Net Asset Value premium? • What ETFs outperform their underlying index? • What ETFs outperform market wide benchmarks?
2.2 Outperformance
We examine ETF outperformance on three levels: ETF NAV premium; ETF price versus its tracked underlying index; and ETF price versus a market return benchmark. NAV premium refers to the amount that the secondary market price of the ETF trades above its calculated NAV. If the amount is negative, it is referred to as a NAV discount. The creation/redemption/deletion procedure facilitates exploitation in such situations, whereby the investor can exchange units of trust for the underlying index's stock and vice versa. The return to optimal Law of One Price levels would occur if there were no limits to arbitrage, with the most notable observed limitations being market frictions (redemption fees and bid-ask spreads). There is empirical evidence of an inconsistency in premium levels between domestic and non-domestic funds, whereby non-domestic funds display persistent premiums with U.S. domestic funds tracking their NAVs relatively well. Elton et al. (2002) and Ackert and Tian (2008) both observe that U.S. ETFs are priced close to NAVs, while Jares and Lavin (2004) and Engle and Sarkar (2006) report that some country ETFs display premiums/discounts. Elton et al. (2002) report an average annual return from holding Spiders2 of 21.91% between the years 1994 and 1998, with the NAV return being slightly
lower at 21.89%. However they highlight, that the gures may overstate the true dierence as Spiders continue to trade for up to 15 minutes after the New York Stock Exchange closes. Engle and Sarkar (2006) use both daily and intra-day data to investigate short-term deviations between the traded price and NAVs of 21 domestic (U.S.) and 16 international ETFs between April and September 2000. They nd that ETFs trade in a premium range of between -0.1 bps and 4.6 bps. U.S. ETFs show minute premiums that are smaller than typical bid-ask spreads whereas international ETFs are less accurately priced due to higher tax and creation/redemption costs. Jares and Lavin (2004) consider mispricings in two Asian ETFs, namely Hong Kong and Japan country funds. They conclude that the non-synchronised trading hours between the U.S. and foreign markets induces the presence of premiums. This study incorporates ETFs from both of these geographic locations.
An ETF is said to have an index tracking error if a fund does not perfectly mirror its underlying benchmark index. Elton et al. (2002) nd that Spiders underperform the S&P 500 Index by 28 bps, the two main causes for this underperformance being the management fee of 18 bps and the dividend being placed in a non-interest bearing account, which results in another 9.95 bps loss. The inuence of expense ratio on ETF outperformance is one of the many factors addressed in Section 2.5. Harper et al. (2006) provide a comparison of ETFs and closed-end country funds (CEFs), observing no signicant tracking error between iShares ETFs and MSCI3 indices from April 1996 to December 2001. DeFusco et al. (2011)
study the three most liquid ETFs, the Spiders, Diamonds, and Cubes.4 Through setting
2Standard & Poor's Depository Receipts (Spiders or SPDRs ) track the performance of the S&P 500
Index.
3MSCI is an abbreviation of Morgan Stanley Capital International. iShares are ETFs tracking the
performance of MSCI individual country market indices.
NAS-out ve hypothesis tests on the non-synchronous price deviations between the ETFs and the notional price of the index, they conclude that the tracking error is a zero, non-normal, stationary process that is dependent on both the accumulation of dividends and on the size of the benchmark index. This paper deals with the size issue through the proxy of each ETF's total assets under management.
Market tracking error in this context refers to how much an ETF under/outperforms a broad market index. The majority of mutual fund and ETF studies to date utilise the S&P 500 as their U.S. benchmark index proxy alongside incorporating risk-adjusted returns into the analysis. Phengpis and Swanson (2009), using monthly data and incorporating the Wilshire 3000 Index to represent the U.S. market return, nd that country iShares are not heavily exposed to U.S. market risk. The results are obtained using a new two factor test specication with the iShares typically mirroring their underlying market indices up to the end of March 2007. The relationship between a U.S. market benchmark and country iShares is revisited in this study. Mateus and Kuo (2008) also study ETF performance, providing a comparative analysis of 20 country-specic ETFs with the S&P 500 Index over a ve-year period. Risk-adjusted measures are used, namely, Sharpe, Treynor, and Sortino ratios. Sharpe and Sortino ratios are again calculated by Rompotis (2011), who shows that the majority of the 50 selected iShares in his sample outperform the S&P 500 on both an annual and aggregate basis over the 2002 to 2007 period.
It is necessary to briey highlight some methodological deciencies contained in the above papers. These deciencies call into question some of the economic reasoning put forward. A common adjustment method is used to assess the scale of the multiple com-parisons problem in the literature. This adjustment is the Bonferroni correction which involves controlling the familywise error rate (i.e., the probability of obtaining one or more false discoveries) by using for each hypothesis test a per comparison cut-o value (α˜) equal to the required signicance level (α) divided by the number of hypothesis tests n, i.e.,
˜ α=α/n.
Firstly, Ackert and Tian (2008) fail to conduct formal hypothesis tests on the observed premium, simply reporting 5% and 95% intervals for the 28 individual ETFs. Such a naïve approach fails to control for the multiple comparisons problem. Even without account-ing for the multiple comparisons issue, none of the observed premiums are statistically signicant, yet inferences from the tests are used as the basis for the paper's primary contributionto uncover a U-shape between illiquidity and fund premium. Harper et al. (2006) promote the use of international ETFs over CEFs in an analysis of passive versus active investment strategies. In doing so, a test is conducted whereby Sharpe ratios are calculated for both the passive ETFs and the active CEFs with t-tests of the Jobson Korkie statistic reported; 29 simultaneous hypotheses are tested about a data set with rejections listed at 5% and 10% signicance levels. Four passive ETFs are said to signicantly outper-form the active CEFs. Using a simplied correction methodology for illustrative purposes, a Bonferroni adjustment would lead to lowering an alpha level of 10% to 0.34% (10%/29 DAQ 100 indices, respectively.
= 0.34%). None of these four supposedly signicant ETFs genuinely outperform the CEFs after this adjustment is made. Jares and Lavin (2004) nd that premiums in Japan and Hong Kong ETFs are positively related to subsequent ETF returns and propose a trading strategy to exploit this. Comprehensive economic reasoning for this observed dynamic is not given. One-tailed t-test statistics are given for the hypothesis that the proposed trad-ing rule exceeds a buy and hold strategy, indicattrad-ing signicance at the 2.5% and 1% levels for Japan and Hong Kong, respectively. There are 12 (6 years by 2 ETFs) simultaneous hypotheses tested in the paper, resulting in a Bonferroni adjustment that decreases a 1% signicance level to 0.08% (1%/13 = 0.08%). There is insucient information to comment on the genuine signicance of the Hong Kong ETF (it is simply listed as being signicant at the 1% level) but under such an adjustment the protable trading strategy associated with the Japan ETF would be classed as a false discovery. Jares and Lavin (2004) test only two ETFs, yet generalisations to all foreign ETFs are tentatively made. Another major issue with the analysis is that it is devised and tested in the same sample period of 1996-2001. Jares and Lavin (2004) claim that the results uncovered are almost too good to be true and with such awed in-sample evaluation, this is quite likely to be the case. A much more rigorous and robust trading strategy analysis, which controls for the data snooping bias, but within an energy market setting, is that of Cummins and Bucca (2012).
Elton et al. (2002) examines the performance of the Standard and Poor's Depository Receipts (SPDRs). No formal hypothesis tests are conducted to evaluate the signicance of the tracking errors reported. Instead a dierence is simply taken between the levels of the index and ETF and a premium level frequency distribution constructed to form its inferences. DeFusco et al. (2011) propose ve hypotheses; namely that ETF tracking error is (i) a stationary process, (ii) normally distributed, (iii) zero, (iv) linked to dividend accu-mulation, and (v) that indices with fewer stocks display smaller tracking errors. Utilising a sample of just three U.S. ETFs, the tracking errors are tested on days when dividends are paid; when zero, it is inferred that dividends accumulated aect the size of the tracking error. This hypothesis is rejected for the log price of the SPY index at the 5% level and for the prices SPY index at the 10% level. However no control for the multiple compar-isons issue is in place here. A family of six simultaneous hypotheses result in a Bonferroni correction of 10%/6 = 1.667% and 5%/6 = 0.833%, leading to adjusted alphas of 1.67% and 0.83% for 10% and 5% signicance levels, respectively. Under this adjustment, there would be no hypothesis rejections.
2.3 Multiple hypothesis testing: data snooping bias
The objective of the study is to formally and statistically test for the presence of out-performance in ETF markets. This will inevitably involve the testing of a large number of performance measure implementations simultaneously. In particular, 11 pricing deviations are considered for each of the 288 ETFs, leading to the simultaneous assessment of 3,168 performance measures. This introduces the well-established issue of data snooping bias,
which in this context, is the problem whereby under näive analysis, statistically signicant outperformance relationships may be identied by pure chance alone. The false discovery of such random artefacts can greatly mislead an investor's portfolio selection and links directly to the broader issue of multiple hypothesis testing in statistical and econometric applications.
The issue with multiple hypothesis testing is that the probability of false discoveries, i.e., the rejection of true null hypotheses by chance alone, is often signicant. There are a number of approaches described in the literature to deal with this multiple comparisons problem and control for the familywise error rate (FWER) and related variants. Romano et al. (2010) provide an excellent summary of the issues and the literature. The FWER is dened as the probability that at least one or more false discoveries occur. Consistent with the notation of Romano et al. (2010), the following denition is made:
F W ERθ=Pθ{reject at least one null hypothesis H0,s:s∈ I(θ)},
where H0,s, s = 1, . . . , S, is a set of null hypotheses; and I(θ) is the set of true null
hypotheses. Controlling the FWER involves setting a signicance level α and requiring
thatF W ERθ≤α. This approach is particularly conservative given that it does not allow
even for one false discovery and so is criticised for lacking power, where power is loosely dened as the ability to reject false null hypotheses, i.e., identify true discoveries (Romano et al. 2010). The greater S, the more dicult it is to make true discoveries.
To deal with this weakness, generalised FWER approaches have been proposed in the literature. The generalised FWER seeks to control for k (where k ≥ 1) or more false discoveries and, in so doing, allows for greater power in multiple hypothesis testing. The generalisedk-FWER is dened as follows:
k-F W ERθ =Pθ{reject at least k null hypothesis H0,s:s∈ I(θ)}.
Towards building a framework to identify outperforming ETFs, with statistical signicance, the following one-sided hypothesis test is considered:
H0,s :θs ≤0 vs. H1,s :θs>0.
The objective is to control for the multiple comparisons in this scenario through the gen-eralised FWER, which oers greater power while also implicitly accounting for the de-pendence structure that exists between the tests. Before outlining the balanced stepdown procedure of Romano and Wolf (2010), it is rst necessary to present the (inferior) single-step procedure designed around the generalised FWER. The advantages of the Romano and Wolf (2010), procedure are better appreciated with this context.
2.3.1 Single-step procedure
denotes the sample size of the data used for estimation. LettingA≡ {1, . . . , S}, the
single-step procedure proceeds by rejecting all hypotheses whereTn,s ≥cn,A(1−α, k), and where cn,A(1−α, k) represents the(1−α)-quantile of the distribution ofk-max
ˆ θn,s−θs
un-der Pθ. With Pθ unknown, the critical value cn,A(1−α, k) is also unknown. However,
an estimate critical value may be determined using appropriate bootstrapping techniques. That is, the critical value ˆcn,A(1−α, k) is estimated as the (1−α)-quantile of the
dis-tribution of k-max
ˆ
θ∗n,s−θˆn,s
for Pˆθ an unrestricted estimate of Pθ. See Romano et al. (2010) for further technical details.
2.3.2 Balanced stepdown procedure
The single-step procedure is improved upon with the balanced stepdown procedure of Romano and Wolf (2010) by allowing for subsequent iterative steps to identify additional hypothesis rejections. It also oers balance by construction in the sense that each hypoth-esis is treated equally in terms of power. The stepdown procedure is constructed such that at each stage, information on the rejected hypotheses to date is used in re-testing for signicance on the remaining hypotheses.
Again assume a set of test statistics Tn,s = ˆθn,s associated with the hypothesis tests,
wherenis again the sample size of the data used for estimation. Introducing some notation,
let Hn,s(·, Pθ) denote the distribution function of
ˆ θn,s−θs
and let cn,s(γ) denote the γ-quantile of this distribution. The condence interval
n
θs: ˆθn,s−θs ≤cn,s(γ)
o
then has coverage probability γ. Balance is the property that the marginal condence
intervals for a population of S simultaneous hypothesis tests have the same probability
coverage. Within the context of controlling the generalisedk-FWER, the overall objective
is to ensure that the simultaneous condence interval covers all parametersθs, s= 1, ..., S,
except for at most (k−1) of them, for a given limiting probability (1−α), while at the same time ensuring balance (at least asymptotically). So, what is sought is that
Pθ
n
ˆ
θn,s−θs≤cn,s(γ) for all but at most(k−1)of the hypotheses
o ≡Pθ n Hn,s ˆ θn,s−θs, Pθ
≤γ for all but at most(k−1)of the hypotheses
o ≡Pθ n k-max Hn,s ˆ θn,s−θs, Pθ ≤γ o = 1−α.
LettingLn,{1,...,S}(k, Pθ)denote the distribution of k-max
Hn,s ˆ θn,s−θs, Pθ , the ap-propriate choice of the coverage probabilityγ is thenL−n,1{1,...,S}(1−α, k, Pθ).
to generate an estimate of the coverage probability L−n,1{1,...,S}1−α, k,Pˆθ
, under Pˆθ . Therefore, from this development it is possible to dene the simultaneous condence interval n θs: ˆθn,s−θs≤Hn,s−1 L−n,1{1,...,S} 1−α, k,Pˆθ ,Pˆθ o .
The right-hand side of the above inequality will form the basis of the critical value def-initions used within the stepdown procedure. See Romano and Wolf (2010) for further technical details. Note that although the above development was made assuming the full set of hypothesis tests, it equally applies to any subset K ⊆ {1, . . . , S}. Hence, the
bal-anced stepwise algorithm may now be described as follows.
• Step 1: LetA1 denote the full set of hypothesis indices, i.e. A1≡ {1, . . . , S}. If for each hypothesis test, the associated test statisticTn,sis less than or equal to the
corre-sponding critical value estimate,cˆn,A1,s(1−α, k)≡H
−1 n,s L−n,A1 1 1−α, k,Pˆθ ,Pˆθ , then fail to reject all null hypotheses and stop the algorithm. Otherwise, proceed to reject all null hypotheses H0,s for which the associated test statistics exceeds the
critical value level, i.e., where Tn,s >ˆcn,A1,s(1−α, k).
• Step 2: Let R2 denote the set of indices for the hypotheses rejected in Step 1 and let A2 denote the indices for those hypotheses not rejected. If the number of ele-ments inR2 is less thank, i.e.,|R2|< k, then stop the algorithm, as the probability of k or more false discoveries is zero in this case. Otherwise, the appropriate
criti-cal value to be applied for each hypothesis testsat this stage is calculated as follows: ˆ
dn,A2,s(1−α, k) = max
I⊆R2,|I|=k−1
{ˆcn,K,s(1−α, k) :K ≡A2∪I}.
Hence, additional hypotheses fromA2are rejected ifTn,s>dˆn,A2,s(1−α, k), s∈A2. If no further rejections are made then stop the algorithm.
...
• Step j: LetRj denote the set of indices for the hypotheses rejected up to Step(j−1)
and letAj denote the indices for those hypotheses not rejected. The appropriate
crit-ical value to be applied for each hypothesis testsat this stage is calculated as follows: ˆ
dn,Aj,s(1−α, k) = max
I⊆Rj,|I|=k−1
{ˆcn,K,s(1−α, k) :K ≡Aj∪I}.
Hence, additional hypotheses fromAj are rejected ifTn,s >dˆn,Aj,s(1−α, k), s∈Aj.
If no further rejections are made then stop the algorithm. ...
At each stepj in the stepwise procedure, the hypotheses that are not rejected thus far are
re-tested over a smaller population of hypothesis tests than previously. The size of this smaller population is given(|Aj|+k−1), which includes all the hypotheses withinAj, in
addition to (k−1) hypotheses drawn from those hypotheses already rejected, i.e., drawn fromRj. Given that control of the generalisedk-FWER is the premise of the procedure, it
is expected that there are at most(k−1)false discoveries amongst the set of hypotheses rejected Rj. However, it is not known which of the rejected hypotheses may represent
false discoveries. Hence, it is necessary to circulate through all combinations of Rj, of
size (k−1),in order to obtain the appropriate critical values. A maximum critical value ˆ
dn,Aj,s(1−α, k) must be determined for each hypothesis test s. This adds an additional
layer of computational burden on the algorithm.
2.3.2.1 Operative method
In requiring to circulate through all subsets ofRj, of size(k−1),in order to obtain the
maximum critical value to apply at each stage of the stepdown procedure, the algorithm can become highly, if not excessively, computationally burdensome. Depending on the|Rj|and
the value of k, the number of combinations|Rj|C
k−1 can become very large. Romano and Wolf (2010) therefore suggest an operative method that reduces this computational burden, while at the same time maintaining much of the attractive properties of the algorithm.5
It is rst necessary to be able to order the hypothesis tests rejected up to step (j−1) in terms of signicance. To this end, it is noted that marginal p-values can be obtained as
follows: ˆ pn,s ≡1−Hn,s ˆ θn,s,Pˆθ .
This gives the following ascending order for the signicance of the hypothesis tests: ˆ
pn,r1 ≤pˆn,r2 ≤. . .≤pˆn,r|
Rj|,
where nr1, r2, . . . , r|Rj| o
is the appropriate permutation of associated hypothesis test in-dices that gives this ordering. As before, a maximum number of combinations, Nmax,
at each step of the algorithm is dened. Then an integer value M is chosen such that MC
k−1≤Nmax,leading to the calculation of the critical values as follows:
ˆ dn,Aj,s(1−α, k) = max I⊆ r max(1,|Rj|−M+1),...,r|Rj| ,|I|=k−1 {ˆcn,K,s(1−α, k) :K ≡Aj∪I}.
What this serves to do is to replace circulating through all the hypothesis tests rejected to date with that of circulating through only the M least signicant hypothesis tests
5Attractive properties include conservativeness, which allows for nite sample control of thek-FWER
rejected. Of course, in the case whereM ≥ |Rj|, then this amounts to circulating through
all the hypotheses rejected. Although this approach is premised on the assumption that the (up tok−1) false discoveries lie within the least signicant hypotheses rejected so far, it does oer signicant computational eciencies for the algorithm. It is this operative method that is used for the empirical analysis in subsequent sections of this chapter, as well as in Chapters 4 and 5.6
2.4 Empirical analysis: framework and data
The balanced stepdown procedure described in the previous section oers a more gener-alised and exible approach to controlling data snooping bias than previous methodologies in the literature. In particular, it controls the generalised FWER using a superior stepwise procedure that oers balance by construction. This property of balance ensures that each outperformance measure is treated equally in terms of power, i.e., the ability to reject false null hypotheses, and so outperformance measures with large deviations do not dominate those with lower deviations. This is one of the key motivations for using the balanced step-down procedure for the empirical analysis of this study. Firstly, in order to test for ETF premiums, the dierences between the mean daily log return of the quoted ETF price and the mean daily log return of its reported NAV are examined, with the null hypothesis being that the ETF return is less than or equal to the NAV return, i.e., no outperformance.7
The analysis is extended through the implementation of traditional risk-adjusted measures such as the Sharpe, Sortino, and Treynor ratio test statistics with the null hypotheses of no outperformance again in place. The same approach is employed in constructing index and market outperformance hypothesis tests, replacing the NAV series with the fund's underlying index and the S&P 500 series respectively.
The three risk-adjusted ratios are now examined. The Sharpe ratio (Sharpe 1966), is the most commonly used ex post measure of risk-adjusted performance in the ETF literature. It is a measure of an investment's performance per unit of risk, whereby standard deviation is used as a proxy for the portfolio's risk. The Treynor ratio is a variant of the Sharpe ratio that incorporates a CAPM-based excess return component, eectively giving excess return per unit of market risk. Where the normality assumption is not in place for returns, it is benecial to consider the Sortino ratio, the third risk-adjusted measure of performance considered. It is again based on the Sharpe Ratio but dierentiates between upside and downside risk whereby it does not penalised for upside volatility. Formally, these risk-adjusted measures are summarised as follows:
ρp =
Rp−rf ηp
,
6The resampling based and p-value based MHT algorithms were made available to me by Dr Mark
Cummins.
where ρp = portfolio's Sharpe, Sortino or Treynor ratios, Rp = portfolio return, ηp
= standard deviation of portfolio for Sharpe, standard deviation of negative returns for Sortino or market beta for Treynor ratios and rf = risk-free rate.8
As referred to previously, for each of the 288 ETFs, 11 pricing deviations are calculated on a daily basis.9 To complete the set-up of the empirical analysis, it is necessary to
discuss the choice of generalising parameter kand the probability parameterα to be used
within the balanced stepdown procedures. To ensure tight control of the number of false discoveries while at the same time oering power to the tests, k is chosen to ensure that
no more than1%of the tests represent false discoveries. The signicance level αchosen is 5%alongside an Nmax value of 100 combinations in line with Romano and Wolf (2010).
The data set comprises 288 U.S. domiciled equity, commodity, and debt ETFs with pre-2008 inception dates. The period of study is 2008-2012, a time span that is chosen to strike an acceptable balance between being suciently long to retain power in the proposed econometric tests and recent enough to be representative of the vast array of ETFs. Data on end-of-day market price, reported NAV, and the notional value of the tracked is downloaded from Bloomberg for each fund. Supplementary data on total asset value, underlying asset class, replication strategy, expense ratio, industry and country focus is also gathered. Table 2.1 provides the cohort proportions of the data set. It includes funds in the assets under management range of $9.72 million to $101,187.40 million with a broad industry split; 18 from the energy sector, 14 from technology, 12 from nancial services, and 11 from health and biotechnology, for example.10 The median expense ratio is 0.51,
with a range of 0.09 to 2.55. The sample includes both many U.S. and non U.S. focused funds,11 along with full, optimised, and derivative replication types. A major contribution
of this study is borne out of the inclusion of these additional factors as they allow for more informed portfolio selection decisions. Average daily risk free rates are downloaded from the website of Kenneth French12 in a manner similar to Rompotis (2011). These are to be
utilised in the calculation of risk-adjusted performance measures.
As identied earlier, the use of the Sortino ratio is appropriate and valid where returns are shown to be non-normal. For completeness, the normality of returns is formally tested for each of the 288 ETF price, the 288 NAV and the 288 index series. The hypothesis that the returns are normal is tested using the Jarque-Bera two-sided goodness-of-t test.13
8A wealth of alternative risk measures exist in the portfolio management literature, some of which may
lead to dierent results and distinct inferences being drawn. However, we chose to adopt those used by both Mateus and Kuo (2008) and Rompotis (2011).
9Note that the construction of the Treynor ratio, which incorporates the market beta, is the reason for
the omission of a Mkt TE TR measure. TE is tracking error.
10No Industry Focus Given is used to denote sector ETFs where no industry focus has been provided
by Bloomberg.
11International ETFs refer to investments targeted at multiple geographic locations outside of the home
market (U.S.) whereas global ETFs refer to investments targeted at multiple geographic locations inclusive of the home market (U.S.).
12Kenneth French's website:
http://mba.tuck.dartmouth.edu/pages/faculty/ken.french/data_library.html (accessed 06/30/12).
13The null hypothesis is that the deviations are normally distributed with unspecied mean and standard

![Figure 3.3: Crude oil implied volatility over time [2007-2013]](https://thumb-us.123doks.com/thumbv2/123dok_us/9941732.2487020/58.892.211.763.162.686/figure-crude-oil-implied-volatility-time.webp)
![Figure 3.4: Crude oil implied volatility slope 2007-2013 −0.9−0.7−0.5−0.3−0.10.10.30.50.7 ImpliedFVolatilityFSmileFSlopeFoverFtimeF[2007−2013]Slope 2007−04−02 2007−06−27 2007−09−21 2007−12−17 2008−03−14 2008−06−10 2008−09−04 2008−11−28 2009−02−26 2009−05−2](https://thumb-us.123doks.com/thumbv2/123dok_us/9941732.2487020/59.892.211.767.366.874/figure-crude-oil-implied-volatility-slope-impliedfvolatilityfsmilefslopefoverftimef-slope.webp)
![Figure 3.5: Crude oil implied volatility curvature 2007-2013 −2024681012 ImpliedKVolatilityKSmileKCurvatureKoverKtimeK[2007−2013]Curvature 2007−04−02 2007−06−27 2007−09−21 2007−12−17 2008−03−14 2008−06−10 2008−09−04 2008−11−28 2009−02−26 2009−05−22 2009−08](https://thumb-us.123doks.com/thumbv2/123dok_us/9941732.2487020/60.892.203.760.351.877/figure-crude-oil-implied-volatility-curvature-impliedkvolatilityksmilekcurvaturekoverktimek-curvature.webp)
