MODELING BIOLOGICAL INTERACTIONS USING SUPERVISED MACHINE LEARNING
A Dissertation
Presented to the Faculty of the Weill Cornell Graduate School of Medical Sciences
in Partial Fulfillment of the Requirements for the Degree of Doctor of Philosophy
by Julie L. Yang
c
2016 Julie L. Yang ALL RIGHTS RESERVED
MODELING BIOLOGICAL INTERACTIONS USING SUPERVISED MACHINE LEARNING
Julie L. Yang, Ph.D. Cornell University 2016
Oncoprotein-targeted drug therapies offer an alternative to cytotoxic drugs for the treatment of cancer [11, 20, 23, 29]. However, resistance to targeted therapies poses a major clinical challenge to their broader use. In addition to acquired re-sistance, where cancer cells acquire mutations under the selective pressure of drug treatment, recent studies have implicated cells of the tumor microenvi-ronment in mediating innate resistance to targeted therapies [41, 48]. Stromal cells can confer resistance by secreting cytokines that activate alternative sig-naling pathways in cancer cells so that they can continue to grow and prolifer-ate despite exposure to drug. In this dissertation, I use a supervised machine learning approach to model tumor-stromal interactions that mediate drug resis-tance from a published data set where stromal-mediated drug resisresis-tance is mea-sured from co-culture experiments. My model, a multi-task bilinear regression, called multi-task affinity regression predicts how cytokines secreted by stromal cells interact with pathways in cancer cells to mediate innate drug resistance to molecularly targeted therapies. I computationally identified and experimen-tally validated HGF as a secreted factor that mediates resistance to the EGFR inhibitors in lung cancer cell lines. I also compared my model to an alternative method in the classification setting called multi-task pairwise support vector machine (SVM). The method was also used to model binding of DNA/RNA to transcription factors (TFs)/RNA binding proteins (RBPs) in protein binding
microarray and RNAcompete experiments [40]. We hope this work will pro-vide new insights into how stromal cells promote drug resistance and how we might treat cancer with combination therapies that target the tumor microenvi-ronment. More generally this dissertation can serve as a point of reference for scientists looking to use supervised machine learning methods to model biolog-ical interactions where a high-throughput affinity readout is available.
BIOGRAPHICAL SKETCH
Julie L. Yang was born in Shanghai, China. She immigrated with her family to the United States. She grew up in New York City where she completed her high school education at Stuyvesant High School. She attended college at Carnegie Mellon University where she earned her Bachelor of Science degree in Mathe-matics with a minor in Physics. Julie joined the Tri-Institutional Training Pro-gram in Computational Biology and Medicine in the summer of 2010 and subse-quently joined the Leslie Laboratory in the fall of 2011 to pursue her dissertation research. Julie’s dissertation research focused on applying supervised machine learning methods to model tumor-stromal interactions that mediate innate re-sistance against targeted cancer therapies.
ACKNOWLEDGEMENTS
I would like to thank all of those people who helped make this dissertation possible. Firstly I would like to thank my advisor Dr. Christina Leslie for men-toring me through my graduate studies. I have learned about highly interesting applications of machine learning to high throughput biological and genomic data sets. I truly appreciate her patience, guidance, and support throughout the years I have worked with her. Under her guidance, I have learned that I really enjoy the work that I do. I want to give special thanks go to my special commit-tee members for agreeing to serve on my commitcommit-tee: Dr. Olivier Elemento, Dr. Johanna Joyce, and Dr. Haiyuan Yu. Thank you for your support and insightful comments and counsel throughout this process.
I would like to thank the Tri-Institutional Training Program in Computa-tional Biology and Medicine (CBM) for the opportunity to pursue my doctoral training in this wonderful vibrant research community. I would like to thank Dr. David Christini. He is an excellent advisor and stands as a example to us grad-uate students. Thanks to Ms. Kathleen Pickering and Ms. Margie Hinonangan-Mendoza for their support throughout my time in graduate school. I have been fortunate to learn from many exceptional scientists through collaboration across research groups and institutions. I want to thank my collaborators: Dr. Johanna Joyce and Dr. Bobby Bowman with whom I have worked closely with on the work presented in this dissertation.
I want to thank my colleagues from the Leslie lab: Raphael Pelossof, Al-varo J. Gonzlez, Hatice Ulku Osmanbeyoglu, Yuri Pritykin, Lee Zamparo, Yi Zhong, Meghana Kshirsagar, Steve Lianoglou, Manu Setty, Mark Carty, Yuheng Lu, Irtisha Singh, Lauren Fairchild, Hyunwoo Cho, Alexander Perez, Han Yuan, Sagar Chhangawala, and Angela Yu. You friendship has been an indescribable
blessing in my life. I would like to acknowledge my fellow graduate students from the CBM program. It has been wonderful to be your fellow graduate stu-dent in this graduate program.
Lastly, but in no way least, I would like to thank my family and friends for their love and support throughout this journey. I want to thank my mother, Yun Lu, as she pursued her Masters and Ph.D. degree in computer science as well and has served as the direct influence for me to apply to a computational bi-ology program. I really admire her for her excellent work ethic as an electron microscopist doing excellent research work in neuroscience in C.elegans. I want to thank my dad, Ming Yang, who is a biophysicist as he has encouraged and always wanted me to pursue research in cancer biology and to commemorate my grandmother- my dad’s mom, as she died of stomach cancer in China. I want to thank my older brother Charles Yang, his wife Jennifer, and my niece Sophia for their love for each other as a family. I want to thank my grandmother Shui Ping Zhang- my mom’s mom as she taught me mathematics when I was in elementary school and she is, for a large part, the reason that I have the math-ematical skill set necessary to pursue a PhD. in Computational Biology. I want to thank the rest of my dear family: my Aunt Ningna Lu, her husband Jin Juing Wang and my cousin Yunfan Wang and my Uncle Dong Ming Lu.
I want to thank God and His son, Jesus Christ. Thank You for Your abundant blessings in my life. May You be glorified. I want to thank my church family the Agape Churches and my church family in New York, Ecclesia New York. Thank you for loving me, partnering with me, daily being involved in my life, and enabling me to fully live out my life in God’s victory.
TABLE OF CONTENTS
Biographical Sketch . . . iii
Dedication . . . iv
Acknowledgements . . . v
Table of Contents . . . vii
List of Figures . . . x
1 Introduction 1 1.1 Background . . . 1
1.2 Summary outline . . . 5
1.2.1 Statistical data analysis of tumor-stromal co-culture drug screen . . . 6
1.2.2 Modeling tumor-stromal interactions that mediate innate resistance to cancer therapies . . . 7
1.2.3 Application of affinity regression to PBM and RNAcom-pete data and comparison to multi-task pairwise SVM . . 9
2 Statistical data analysis of tumor-stromal co-culture drug screen 11 2.1 Preliminary studies . . . 11
2.1.1 Mean drug rescue score in co-cultures treated with differ-ent drug dosages . . . 12
2.1.2 Dosage comparison of stromal mediated rescue in melanoma and colorectal co-cultures treated with PLX4720 13 2.2 Correlation Analysis . . . 15
2.2.1 Reanalysis of the correlation in cytokine arrays with av-erage rescue score of melanoma cell lines treated with PLX4720 . . . 15
2.2.2 Analysis of the correlation in cytokine arrays with res-cue scores in individual melanoma cell lines treated with PLX4720 . . . 18
2.2.3 Correlation analysis for cancer subtypes across co-cultures treated with anticancer drugs . . . 19
3 Modeling tumor-stromal interactions that mediate innate resistance to targeted cancer therapies 34 3.1 Introduction . . . 34
3.1.1 Background . . . 34
3.1.2 Prior Work . . . 36
3.2 Results . . . 40
3.2.1 Multi-task affinity regression models tumor-stromal inter-actions in co-culture drug treatment experiments . . . 40 3.2.2 Multi-task affinity regression outperforms nearest
3.2.3 Multi-task affinity regression recovers HGF as a stromal factor that rescues melanoma cells treated with PLX4720 . 46 3.2.4 Affinity regression implicates MET, MYC and PI3K
path-ways in stromal cell-mediated PLX4720 resistance . . . 49
3.2.5 Multi-task training learns a pan-EGFR inhibitor model of stromal-mediated resistance . . . 52
3.2.6 Experimental validation confirms HGF as a novel stro-mal factor mediating resistance to afatinib and erlotinib in non-small cell lung cancer cells . . . 55
3.3 Methods . . . 56
3.3.1 Rescue score calculation . . . 56
3.3.2 Cytokine array processing . . . 58
3.3.3 Pathway scores . . . 58
3.3.4 Multi-task affinity regression . . . 59
3.3.5 Parameter optimization . . . 60
3.3.6 Comparison of multi-task with single-task affinity regres-sion . . . 61
3.3.7 Comparison of multi-task affinity regression with nearest neighbor methods . . . 61
3.3.8 Empirical null models . . . 62
3.3.9 Cells, inhibitors, and cytokines . . . 63
3.4 Conclusion . . . 64
3.5 Comparison of multi-task affinity regression to multi-task pair-wise SVM . . . 65
3.5.1 Optimization Problem for Pairwise SVM . . . 65
3.5.2 Primal Optimization Problem for Multi-task Pairwise SVM 69 3.5.3 Dual Optimization Problem for Multi-task Pairwise SVM . 70 3.6 Performance Comparison of multi-task affinity regression to multi-task pairwise SVM . . . 71
4 Application of affinity regression to PBM and RNAcompete data 77 4.1 Application of affinity regression to PBM and RNAcompete data 77 4.1.1 Affinity regression modeling of TF/RBP and DNA/RNA interactions in PBM and RNAcompete data . . . 77
4.1.2 Example of predicted Z-scores . . . 79
4.1.3 Motif visualization and comparison of affinity regression motifs with nearest neighbor motifs . . . 79
4.1.4 Comparison of Kullback-Leibler divergence of affinity re-gression motifs with nearest neighbor motifs . . . 81
5 Conclusion 86 5.1 Conclusion and future directions . . . 86
5.1.1 Introduction . . . 86
5.1.3 Learning families of transcription factors and RNA bind-ing proteins from PBM and RNAcompete data . . . 90 5.1.4 Conclusion . . . 91
LIST OF FIGURES
2.1 Rescue of colorectal cancer cell lines from gemcitabine (Gem) by HDF stromal cells. HT-29 was treated with 0.02µM Gemc-itabine. Fluorescence microscopy looking at GFP positive cancer cells at day 7. All 4 quadruplicate wells are shown. . . 12 2.2 Mean drug rescue score averaged across all tumor-stromal
co-cultures indexed by the drug dosage. The average rescue score for co-cultures treated was calculated and plotted for each drug dosage. . . 14 2.3 Relative proliferation with stroma versus relative proliferation
without stroma in melanoma cancer cell lines. The relative pro-liferation of the cancer cells in co-culture with melanoma cell lines was plotted against the relative proliferation of cancer cells in monoculture for cancer cell lines treated with vemurafenib. . 16 2.4 Relative Proliferation with stroma versus relative proliferation
without stroma in colorectal cancer cell lines. The relative pro-liferation of cancer cells in co-culture with colorectal cell lines was plotted against the relative proliferation of cancer cells in monoculture for cancer cell lines treated with vemurafenib. . . . 17 2.5 Correlations for each of the cytokines in cytokine array one
with stromal average melanoma rescue scoreRM. The correla-tion of the secrecorrela-tion of each cytokine in cytokine array one with the stromal average rescue score for melanoma cell lines treated with PLX4720 was calculated. The stromal average rescue score for melanoma was calculated for each of the stromal cell lines as the average rescue score across all melanoma cell lines in co-culture with the stromal cell line. . . 21 2.6 Correlations for each of the cytokines in cytokine array two
with stromal average melanoma rescue scoreRM. The correla-tion of the secrecorrela-tion of each cytokine in cytokine array one with the stromal average rescue score for melanoma cell lines treated with PLX4720 was calculated. The stromal average rescue score for melanoma was calculated for each of the stromal cell lines as the average rescue score across all melanoma cell lines in co-culture with the stromal cell line. . . 22 2.7 Box plots of correlations of cytokines secretion in cytokine
array one with rescue of melanoma cell lines treated with PLX4720 1µM.Here we plot box plots of the correlations of each of the cytokines in cytokine array one with the rescue scores from the melanoma cell lines under the drug PLX4720 1µM. . . 23
2.8 Box plots of correlations of cytokines secretion in cytokine array two with rescue of melanoma cell lines treated with PLX4720 1 µ M. Here we plot box plots of the correlations of each of the cytokines in cytokine array two with the rescue scores from the melanoma cell lines under the drug PLX4720 1µM. . . . 24 2.9 Box plots of correlations of cytokines secretion in cytokine
array one with rescue of melanoma cell lines treated with PLX4720 2µM.Here we plot box plots of the correlations of each of the cytokines in cytokine array one with the rescue scores from the melanoma cell lines under the drug PLX4720 2µM. . . 25 2.10 Box plots of correlations of cytokines secretion in cytokine
array two with rescue of melanoma cell lines treated with PLX4720 2 µ M. Here we plot box plots of the correlations of each of the cytokines in cytokine array two with the rescue scores from the melanoma cell lines under the drug PLX4720 2µM. . . . 26 2.11 Box plots of rescue scores plotted against GM-CSF secretion in
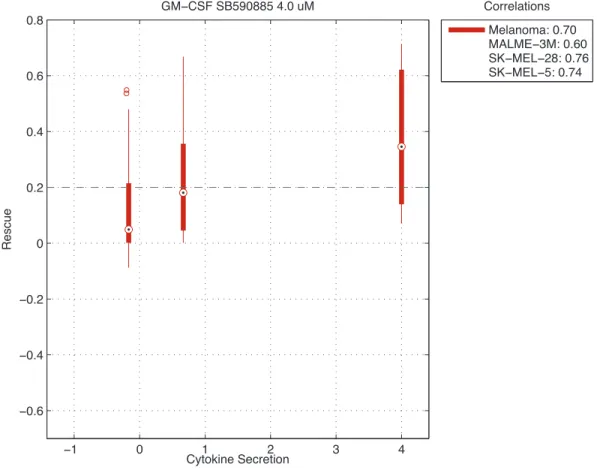
SB590885 4 µMtreated melanomaThe rescue scores are plotted as a function of the secretion of GM-CSF secretion in melanoma cell lines treated with SB590885 4 µM. The average correlation between the secretion of the cytokine and rescue scores for can-cer cell lines for the cancan-cer subtypes is calculated. . . 27 2.12 Box plots of rescue scores plotted against HGF secretion in
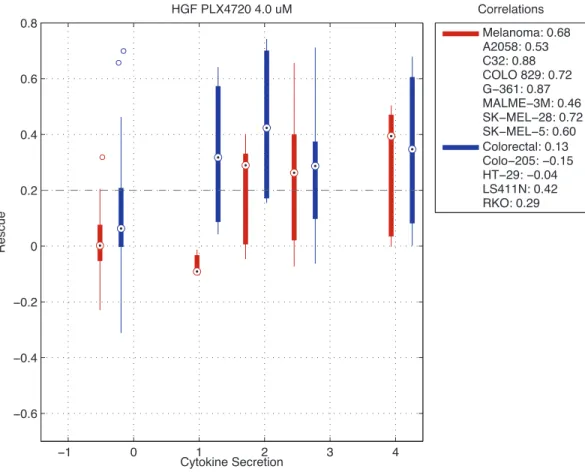
ve-murafenib 4µMtreated melanomaThe rescue scores are plotted as a function of the secretion of HGF secretion in melanoma cell lines treated with PLX4720 4 µM. The average correlation be-tween the secretion of the cytokine and rescue scores for cancer cell lines and for the cancer subtypes is shown. . . 28 2.13 Box plots of rescue scores plotted against HGF secretion in
ve-murafenib 2µMtreated melanomaThe rescue scores are plotted as a function of the secretion of HGF secretion in melanoma cell lines treated with PLX4720 2 µM. The average correlation be-tween the secretion of the cytokine and rescue scores for cancer cell lines and for the cancer subtypes is shown. . . 29 2.14 Box plots of rescue scores plotted against MMP-10 secretion
in vemurafenib 1 µM treated melanoma The rescue scores are plotted as a function of the secretion of MMP-10 secretion in melanoma cell lines treated with PLX4720 1 µM. The aver-age correlation between the secretion of the cytokine and rescue scores for cancer cell lines and for the cancer subtypes is shown. 30
2.15 Box plots of rescue scores plotted against VEGF-C secretion in afatinib 0.05µMtreated breast cancerThe rescue scores are plot-ted as a function of the secretion of VEGF-C secretion in breast cancer cell lines treated with afatinib 0.05 µM. The average cor-relation between the secretion of the cytokine and rescue scores for cancer cell lines and for the cancer subtypes is shown. . . 31 2.16 Box plots of rescue scores plotted against MMP-10 secretion in
lapatinib 4µMtreated head and neck cancer The rescue scores are plotted as a function of the secretion of MMP-10 secretion in head and neck cancer cell lines treated with lapatinib 4 µM. The average correlation between the secretion of the cytokine and rescue scores for cancer cell lines and for the cancer subtypes is shown. . . 32 2.17 Box plots of rescue scores plotted against HGF secretion in
afatinib 0.03 µM treated non-small cell lung cancerThe rescue scores are plotted as a function of the secretion of HGF secre-tion in non-small cell lung cancer cell lines treated with afatinib 0.03 µM. The average correlation between the secretion of the cytokine and rescue scores for cancer cell lines and for the cancer subtypes is shown. . . 33 3.1 Hierarchical clustering of the pathway scores groups cancer
cell lines by tissue of origin (a) Hierarchical clustering of the pathway scores for 75 curated pathways across 1036 cell lines from CCLE groups cancer cell lines by tissue of origin and clus-ters together growth factor signaling pathways (red) and cy-tokine/chemokine mediated pathways (blue). Hematopoietic, stomach, and large intestine cancer cell lines have high growth factor signaling pathway scores, while lung and skin cell lines have high cytokine and chemokine mediated pathway scores. (b) Her2 amplified breast cancer cell lines have higher ERBB2 signaling pathway scores than Her2 wild type breast cancer cell lines. (c) Melanoma cell lines with BRAF mutations have higher RAS/RAF signaling pathway scores than those with wildtype BRAF. . . 41
3.2 Affinity regression predicts stromal-mediated rescue from tar-geted therapies from cancer cell line pathway scores and stro-mal cell cytokine data. (a) Drug co-culture experiments quan-tify the extent of stromal-mediated rescue of cancer cells treated with targeted agents, assigning a rescue score to each (cancer cell line, stromal cell line, drug/dosage) combination. (b) Multi-task affinity regression learns to predict rescue scores from pathway score features of cancer cells and secreted cytokine levels of stro-mal cells using a regularized bilinear regression strategy. Each task trains on the co-culture experiments for a specific drug and dosage. The model is represented as an interaction matrix Wt
between pathways and cytokines;S andCrepresent the feature matrices of cytokine expression values for stromal cells and path-way scores for cancer cells, respectively. Tasks corresponding to different dosages of the same drug or to drugs in the same class are jointly trained by shrinking model matrices Wt for different tasks towards the average taskWo. . . 43 3.3 Cytokine and pathway mappings (a) Multiplying a cancer cell
lines pathway feature vector by the trained model W yields a vector of cytokine mapping scores. Large positive mapping scores identify cytokines predicted to mediate innate drug resis-tance when they interact with the cancer cell line. (b) Multiply-ing a stromal cell lines cytokine feature vectors by the trained model W yields a vector of pathway mapping scores. Large mapping scores identify cancer pathways whose dysregulation is predicted to mediate resistance or sensitivity in the presence of the stromal cell line. . . 44 3.4 Multi-task affinity regression outperforms nearest-neighbor
methods in 10-fold cross-validation experiments. Models were trained in multi-task fashion for 54 drug tasks corresponding to multiple dosage levels of 13 anti-cancer therapeutics; pan-EGFR inhibitor and pan-BRAF inhibitor models were also trained. Multi-task affinity regression strongly outperformed (a) cancer nearest neighbor (P < 2.69 × 10⁻¹⁴, Wilcoxon signed rank test) and (b) stromal nearest neighbor (P < 4.77 × 10⁻¹³, Wilcoxon
3.5 Multi-task affinity regression identifies HGF as the main cy-tokine that elicits resistance in PLX4720 treated melanoma cell lines. (a) The heatmap of the cytokine mapping scores for melanoma and colorectal cell lines using the vemurafenib model clusters cancer cell lines by subtype. Orange boxes indicate a cytokine-cancer cell line pair significant mapping scores relative to an empirical null model (FDR < 5%, see Methods) and dark orange boxes indicate a cytokine-cancer cell line pair significant mapping scores relative to an empirical null model (FDR<10%, see Methods), identifying HGF as the main cytokine that elic-its resistance in melanoma cell lines. (b) For each cytokine, the bar plots show the number of melanoma cell lines (magenta) for which the mapping score attained significance of (FDR < 10%). This analysis suggests that stromal-secreted HGF and TNF-beta frequently mediate resistance to vemurafenib in lung cancer cells. 48 3.6 Multi-task affinity regression implicates the MYC pathway in
drug resistance and P53 regulation pathway in drug sensitivity in PLX4720 treated cell lines.The heatmap of the pathway map-ping scores for breast, skin, and lung fibroblasts using the vemu-rafenib model clusters stromal cell lines by their tissue of origin. Dark orange boxes indicate pairs whose mapping scores are sig-nificantly associated with drug resistance and dark blue boxes indicate pairs whose mapping scores are significantly associated with drug sensitivity (FDR <10%). This analysis implicates the MYC pathway in drug resistance and the P53 regulation path-way in drug sensitivity mediated by lung and breast fibroblasts. 50 3.7 Multi-task affinity regression identifies the HGF and MET
pathway and HGF and PI3K and PI3K/AKT pathways in drug resistance against vemurafenibThe heatmap of absolute values of cytokine-pathway interactions in the model matrix W. Orange boxes indicate cytokine-pathway interactions that are significant relative to an empirical null model (FDR<5%, see Methods) and dark orange boxes indicate (FDR<10%, see Methods) and iden-tify (HGF, MET pathway) and (HGF, PI3K pathway) and (HGF, PI3K/AKT pathway) as significant interactions. . . 51
3.8 Multi-task affinity regression identifies the HGF in drug re-sistance in afatnib treated co-cultures (a) The heatmap shows cytokine mapping scores for breast cancer and non-small cell lung cancer (NSCLC) cells lines for the afatinib affinity regres-sion model. Orange boxes indicate cytokine-cancer cell line pairs that are significantly associated with drug resistance relative to an empirical null model (FDR < 5% ), while dark orange boxes indicate (FDR< 10%). (b) For each cytokine, the bar plots show the number of breast cancer cell lines (red) and the number of lung cancer cell lines (black) for which the mapping score at-tained significance. This analysis suggests that stromal-secreted HGF and IL-8 frequently mediate resistance to afatinib in lung cancer cells, but seldom in breast cancer cells. . . 53 3.9 Multi-task affinity regression identifies the HGF in drug
resis-tance in pan-EGFR inhibitor model(a) The heatmap shows cy-tokine mapping scores for breast cancer, NSCLC, and head and neck squamous cell carcinoma (HNSCC) cell lines for the pan-EGFR affinity regression model with multi-task training across gefitinib, afatinib, erlotinib, and CL-387785 (b) For each cytokine, the bar plots show the number of breast cancer cell lines (red) and the number of lung cancer cell lines (black) for which the mapping score attained significance for the pan-EGFR affinity regression model. The analysis suggests that HGF and IL-8 fre-quently mediate resistance to EGFR inhibitors in lung cancer cells, while MMP-1 mediates resistance in breast cancer cells. . . 54 3.10 Summary of HGF mediated drug resistance non-small cell
lung cancer cell linesSummary of drug resistance experiments comparing cancer cell line proliferation under treatment with two EGFR inhibitors, afatinib and erlotinib, across 3 NSCLC cell lines with and without HGF. The P value indicates the most significant increase in cancer cell counts over the drug dose re-sponse experiments in drug+HGF versus drug only conditions. 56 3.11 Dose response curves and relative abundance of cancer
pro-liferation at a specific drug dose for HGF mediated drug re-sistance in non-small cell lung cancer cell lines (b,d,f,h) Dose response curves for drug+HGF (red) versus drug only (blue) for specific NSCLC cell lines, plotting relative abundance of cancer cells as a function of drug dose with HGF concentration fixed. Experiments are performed in triplicate. (c,e,g,i) Relative abun-dance of cancer cells at a specific drug dose (as shown), showing baseline, HGF only, drug only, and HGF values. . . 57
3.12 Comparison of multi-task affinity regression with multi-task pairwise SVM in PLX4720 drug resistance Multi-task affinity regression (AUC = 0.93) outperforms multi-task pairwise SVM (AUC = 0.89). Models were assessed using 10-fold cross-validation. 72 3.13 Comparison of multi-task affinity regression with multi-task
pairwise SVM in afatinib drug resistance Multi-task affinity regression (AUC = 0.94) outperforms multi-task pairwise SVM (AUC = 0.72). Models were assessed using 10-fold cross-validation. 73 3.14 Comparison of multi-task affinity regression with multi-task
pairwise SVM in erlotinib drug resistance Multi-task affin-ity regression (AUC = 0.95) outperforms multi-task pairwise SVM (AUC = 0.85). Models were assessed using 10-fold cross-validation. . . 74 3.15 Comparison of multi-task affinity regression with multi-task
pairwise SVM in gefitinib drug resistance Multi-task affin-ity regression (AUC = 0.91) outperforms multi-task pairwise SVM (AUC = 0.86). Models were assessed using 10-fold cross-validation. . . 75 3.16 Comparison of multi-task affinity regression with multi-task
pairwise SVM AUC performance in 13 drugs and 2 drug groups. Multi-task affinity regression outperforms multi-task pairwise SVM in AUC (P < 3.05 × 10⁻⁴, Wilcoxon signed rank
test). Models were assessed using 10-fold cross-validation. . . . 76 4.1 Example of homeodomain predicted versus experimental
Z-scores. Example of predicted scores from the Z-score affinity regression model, trained on 75 non-redundant mouse homeodomains, versus experimental Z-scores for SNA-POd2T00005194001, one of the diverse homeodomains assayed by Weirauch et al. [15] Binding motifs generated by PWM-Align-Z based on the top 100 8-mers predicted by affinity regression and the top 100 8-mers based on actual Z-scores are shown. . . . 80 4.2 AR-derived motif prediction for RBPs.AR motifs are generated
by running PWM-Align-Z on the top 1007-mers as predicted for held-out RBPs using the Z-score affinity regression model (10-fold cross-validation). In the inner circle, we show the ground truth motif obtained from the experimental data Y, the middle circle shows motif obtained by AR, and the outer circle shows the motif obtained by NN. Plotted are predictions for both RRM and KH-I domains. The RRM motifs are well predicted by both AR and NN; KH family proteins are less well represented in the data set, and KH-I motifs are harder to predict for both methods. 82
4.3 RBP motif accuracy. Predicted motifs were assessed for quality relative to ground truth by DKL, computed by sliding the pre-dicted PWM over the ground truth PWM and reporting the min-imum DKL. The NN (y-axis) and AR (x-axis)log(DKL)scores are plotted after subtracting the minimumlog(DKL)for the data set. Motifs falling in the gray area satisfy a quality threshold equal to the median divergence between motifs from experimental repli-cates. AR-predicted motifs are significantly more accurate than NN motifs (p<7.66×10⁻¹⁰, Wilcoxon signed rank test). . . 83 4.4 Probability density function oflog(DKL)for affinity regression
and nearest neighbor. Probability density function of held-out
log(DKL)for AR and NN. . . 84 4.5 Cumulative distribution function of log(DKL) for affinity
re-gression and nearest neighbor. Cumulative distribution func-tion of held-outlog(DKL)for AR and NN. . . 85
CHAPTER 1
INTRODUCTION
1.1
Background
Targeted cancer therapies, which include small molecules and blocking anti-bodies that inhibit a specific molecular target within the tumor cell, have seen marked success in clinical trials in the past two decades [11, 20, 23, 29]. Tar-geted therapies represent a significant advance in personalized medicine as they are used specifically on patients whose tumors harbor the genetic muta-tions that give rise to targeted oncogenic proteins. As opposed to chemoapeutic drugs, which kill rapidly dividing cells indiscriminantly, targeted ther-apies offer a promising treatment option that effects only cancer cells express-ing specific molecules. The success of targeted therapies and their advantages over chemotherapy points to target therapies as a important alternative treat-ment against cancer. However, the emergence of drug resistance in the 2000s in clinical trials posed a serious challenge to the success of these treatments [1, 7, 22, 39]. In these clinical trials, a large percentage of the treatment cohort were either non-responders or responders who would fail to respond after a period of time. Drug resistance poses a major problem for targeted therapies, and it is important to study mechanisms of drug resistance to develop treat-ment strategies that will overcome these challenges. This thesis studies tumor microenvironment-mediated innate drug resistance by modeling molecular in-teractions between the tumor and stromal cells using supervised machine learn-ing methods. This analysis provides new insights into the mechanisms that me-diate drug resistance and may eventually suggest treatment strategies such as
combination therapies that can target both the tumor and microenvironment to overcome drug resistance.
Research on targeted therapies for cancer treatment can be traced back to as early as 1960 when researchers found a chromosomal abnormality leading to the expression of mutant kinase BCR-ABL on chromosome 22 in chronic granulo-cytic leukemia [29]. They named the chromosomal abnormality the Philadel-phia Chromosome. Later imatinib (Gleevec) one of the first targeted cancer therapies was developed as an inhibitor of mutant kinase BCR-ABL. In the late 1990s and early 2000s, the FDA began to approve the first molecularly targeted cancer drugs. In 1997, the FDA approved rituximab (Rituxan) to treat patients with non-Hodgkin lymphoma [11]. In 1998, the FDA approved trastuzumab (Herceptin), a monoclonal antibody that was added to chemotherapy to treat women with advanced breast cancer that over-expressed HER2 [23]. In 2001, the FDA approved imatinib (Gleevec) to treat chronic myelogenous leukemia (CML) [20]. These targeted therapies allowed specific cohorts of patients to avoid the negative effects of cytotoxicity from chemotherapy.
Despite the initial success of targeted therapies, drug resistance soon emerged as a serious a challenge. There are two types of drug resistance: ac-quired resistance, which develops during the course of treatment in response to therapy, and innate resistance, which is inherent in the body and present even before treatment begins [19]. For many targeted therapies, some patients do not respond (innate resistance) or some patients fail to continue to respond af-ter a period of time despite a significant initial response to therapy (acquired resistance). For imatinib (Gleevec), in the treatment of chronic myelogenous leukemia (CML), 33% of patients will have an inferior response, either
fail-ing to respond to primary therapy or demonstratfail-ing relapse after an initial re-sponse due to acquired drug resistance [7]. Trastuzumab (Herceptin) is an ef-fective targeted drug in the treatment of HER2-positive breast cancer. However, 20% of early stage breast cancer patients and approximately 70% of patients with metastatic disease are resistant to treatment [28]. More recently imatinib (Gleevec) was also shown to block c-KIT tyrosine kinase in patients with KIT mutant melanoma [22]. Despite the initial response to imatinib treatment, drug resistance emerged for most cases after a short period of time eventually lead-ing to relapse. Vemurafenib, a drug that targets BRAFV600E
mutations, showed more than 50% response rates in patients carrying the BRAF mutation. Despite the high initial rate of response to therapy, a majority of the patients develop resistance to vemurafenib after approximately six months of treatment [39, 33]. Drug resistance poses a challenge to the success of targeted therapies, and it is important to study mechanisms of drug resistance in order to improve the duration of response.
Cancers develop due to the accumulation of genetic and epigenetic alter-ations that occur in initially normal cells. At same time, cancer cells develop within a host microenvironment that is composed of a heterogeneous popula-tion of stromal cells (fibroblasts, endothelial cells, adipocytes, immune cells and bone marrow-derived stem cells), stromal cell secreted factors, and the extra-cellular matrix. The host microenvironment has long been known to contribute to tumor initiation, progression and metastasis [26]. Recently researchers have proposed that the tumor microenvironment may also play a key role in modu-lating cancer drug efficacy. In 2012, Todd Golub’s group at the Broad Institute [41] and Jeffrey Settleman’s group at genentech [48] separately and concurrently showed that stromal cells from the tumor microenvironment confer drug
resis-tance through secreted factors. Targeted therapies were especially susceptible to stromal mediated drug resistance. It was shown that stromal cells of the tumor microenvironment could induce resistance in cancer cells by releasing soluble factors called cytokines that elicit drug resistance in tumor cells.
In my thesis research, I modeled tumor-stromal interactions that mediate drug resistance against anti-cancer targeted therapies. I used a multi-task bi-linear regression method called multi-task affinity regression to model tumor-stromal interactions that mediate drug resistance, jointly training across co-cultures treated with different drugs of the same class. In my model, cytokines of the stromal cells are thought to signal to the tumor cells reactivating onco-genic signaling pathways in the tumor cells, leading to drug resistance. Through statistical analysis of the affinity regression models, I identified cell-cell signal-ing and cancer pathways involved in stromal-mediated drug resistance. Even-tually, these approaches may lead to effective cancer treatment strategies such as combination drug therapies that target both the tumor and the microenviron-ment to counteract drug resistance.
Affinity regression is a bilinear regression where the observed data can be modeled as interactions between two kinds of inputs [40]. The algorithm learns a weighting on all such interactions that best explains the affinity of one input for the other given the observed data. Affinity regression is closely related to Partial Least Squares regression, developed by Herman Wold in 1966 [18], and to Canonical Correlation Analysis, developed by Harold Hotelling in 1936 [17]. Bilinear regression was described by Ruben Gabriel Kramer in 1995 [32]. Our bilinear regression method called affinity regression was developed by Raphael Pelossof in 2010. It involves singular value decomposition (SVD) compressions
of one of both inputs and regressing on the matrix of pairwise similarities of the output response variables. Here we formulate a multi-task version of this bi-linear regression to analyze biological interactions of co-cultures that have been treated with multiple drug dosages. Our formulation is a bilinear regression without the SVD compressions and using the original output matrix rather than the kernelized version. We anticipate that our approach can be naturally ap-plied to predict many other kinds of biological interactions where there is a high-throughput affinity read-out.
1.2
Summary outline
This thesis is divided into three chapters that cover the key contributions of my graduate work. Chapter 2 details the preliminary statistical data analysis I performed on the tumor-stromal co-culture drug screen data set obtained from Straussman et al. [41]. It includes the initial analyses of the drug resistance ob-served in the co-cultures and a correlation analysis of the cytokines responsible for mediating drug resistance in different subtypes of cancer treated with dif-ferent anti-cancer therapies. Chapter 3 details the work I did to model tumor-stromal interactions that mediate innate drug resistance to anti-cancer therapies using multi-task affinity regression. I then explore an alternative method for modeling the pairwise molecular interactions between tumor cells and stromal cells using multi-task pairwise support vector machine (SVM) in a classifica-tion framework and compare the performance of this alternative method with multi-task affinity regression. Finally, chapter 4 describe another application of affinity regression to Protein Binding Microarray (PBM) and RNAcompete ex-periments. In chapter 4, I detail the contributions I made to the original affinity
regression paper, using affinity regression to model the interactions between the k-mer features of DNA/RNA probes and the K-mer amino acid features of transcription factors/RNA binding proteins that predict the binding affinities in Protein Binding Microarray (PBM) and RNAcompete experiments.
1.2.1
Statistical data analysis of tumor-stromal co-culture drug
screen
I performed a statistical analysis of the co-culture data set from Straussman et al. [41] to establish feasibility of using affinity regression to model tumor-stromal interactions mediating resistance against anti-cancer therapies. In these co-culture experiments, co-culturing with stromal cells rescues cancer cells from drug-mediated killing. To determine which drugs are potential candidates for our study on innate drug resistance, I calculated a mean rescue score of the co-cultures treated with different drug dosages to determine which drug and dosage combination gives the best rescue of cancer cell lines by stromal cell lines. I looked at cancer proliferation in the PLX4720 treated co-cultures to get an idea of what drug resistance looks like in a positive and negative control cases– in melanoma where drug resistance is known to occur and in colorectal cancer where there is no drug resistance [1]. I looked at the relative proliferation of the cancer cells with stroma against the proliferation of cancer cells without stroma in melanoma and colorectal cell lines treated with different dosages of PLX4720.
Correlation analyses of the tumor-stromal co-culture drug screen
To identify of the cytokines correlated with strong drug resistance in a co-culture system, melanoma cell lines with BRAF V600E mutations treated with PLX4720, I repeated the statistical analysis performed by Straussman et al. [41], corre-lating the average rescue scores of melanoma cell lines treated with PLX4720 with individual cytokine expression levels secreted by the stromal cell lines. I confirmed that HGF is the cytokine most strongly correlated with resistance to PLX4720 in melanoma cell lines (Fig. 2.5,2.6)). To see if there are cytokines other than HGF that contribute to rescue in melanoma cell lines treated with PLX4720, I performed another analysis, correlating the individual rescue scores of the melanoma cell lines treated with PLX4720 with the cytokine expression levels secreted by the stromal cell lines (Fig. 2.7, 2.8, 2.9, 2.10). I found evi-dence that there may be other cytokines mediating resistance in melanoma cell lines treated with PLX4720. Finally I performed a correlation analysis across co-cultures treated with 15 different anti-cancer drugs. I calculated the correlation of the secretion level of the cytokines and the rescue scores for cancer cell lines and calculated an average correlation score for each subtype of cancer. I found cytokines for each cancer type and each drug dosage that were highly correlated with drug resistance.
1.2.2
Modeling tumor-stromal interactions that mediate innate
resistance to cancer therapies
Both innate and acquired resistance to molecularly targeted therapies represent major challenges to cancer treatment. The importance of the tumor
microen-vironment in cancer initiation and progression is well established [26], but we are only beginning to understand the contributions of the microenvironment to therapeutic response and innate drug resistance. To study this issue computa-tionally, I used affinity regression to model the effect of stromal cells on cancer cell drug sensitivity using a large published stromal-cancer co-culture data set consisting of 45 cancer cell lines, 23 stromal cells lines, and 35 drugs [30]. I rep-resented each stromal cell by a feature vector of expression levels of secreted cy-tokines, measured by cytokine array in monoculture. I represented each cancer cell by pathway scores derived from curated signaling pathway databases, giv-ing a view of the cellular circuitry that could receive and transduce signals from stromal cells. For each drug, the algorithm trained a regularized bilinear regres-sion model that predicted the stromal rescue score for a cancer cell line from the pair of stromal and cancer feature vectors. By analysis of the trained model, I identified cytokines secreted by the stromal cell lines that may interact with signaling pathways in the cancer cells to mediate rescue. I found that affinity regression outperformed nearest neighbor approaches for the task of predicting rescue scores in cross-validation experiments. Further, for the BRAF inhibitor PLX4720, I confirmed that HGF is the cytokine most predictive of increased cancer cell proliferation in co-culture, and HGF participates in re-activating c-MET and PI3K/AKT signaling, consistent with published experimental reports [48]. Furthermore I found that HGF plays a similar role in afatinib and erlotinib treated NSCLC cell lines, while this interaction is not seen in NSCLC cell lines treated with the general cytotoxic drug docetaxel. The model of tumor-stromal interactions may lead to new insights into the role of stromal cells in promot-ing drug resistance and ultimately into how to treat cancer with combination therapies that target both the tumor and the microenvironment.
I compare multi-task affinity regression to an alternative method multi-task pairwise SVM. I describe a model that can be seen as the alternative to the multi-task affinity regression that uses classification rather than regression for modeling biological interaction data. I model the pairwise molecular interac-tions between the stromal cells and the tumor cells to explain innate drug re-sistance observed in the tumor-stromal co-culture drug screen using a multi-task pairwise SVM. I compare the performance of the two methods using 10-fold cross-validation trained on the tumor-stromal co-culture drug screen data treated with 15 anti-cancer therapies.
1.2.3
Application of affinity regression to PBM and
RNAcom-pete data and comparison to multi-task pairwise SVM
In this chapter, I detail the contributions I made to the original affinity regression paper in 2015 [40]. There, affinity regression was used to model protein ing microarray (PBM) or RNAcompete experiments to learn family-level bind-ing models for transcription factors (TFs) and RNA bindbind-ing proteins (RBPs). There, we learned an interaction model between k-mer features of the nucleic acids and the mer features of the proteins. In this project, I prepared the K-mer feature matrices of the two inputs and the matrix of the binding affinities for the RNA binding protein analysis. I generated motifs for the affinity re-gression models for the Z-score affinity rere-gression model for Z-scores obtained from PBM and RNAcompete experiments using the PWM-Align-Z algorithm. I plotted an example of the predicted and experimental Z-scores from the Z-score affinity regression model. I visualized the motifs for the RNA binding proteins
model in a circularized phylogenetic tree. I compared the motif accuracy of the motifs generated from affinity regression with the motifs generated from a nearest neighbor competitor algorithm by calculating the Kullback-Leibler divergence (DKL) between the motifs generated from the models and the mo-tifs calculated directly from the data, which we considered to be ground truth. Learning from PBM and RNAcompete data, the affinity regression model pre-dicted the binding affinities of held-out proteins and identified key DNA/RNA-binding residues associated with DNA/RNA-binding. More generally, affinity regression can be used to model biological interaction data as the interactions between the features of two inputs, and it is possible to apply affinity regression to model and predict paired macromolecular or cellular interactions in any setting where there is a high-throughput affinity readout.
CHAPTER 2
STATISTICAL DATA ANALYSIS OF TUMOR-STROMAL CO-CULTURE DRUG SCREEN
2.1
Preliminary studies
Rescue scores of stromal-mediated drug resistance
In order to establish the feasibility of using affinity regression to model tumor-stromal interactions mediating drug resistance, we performed an analysis of the tumor-stromal co-culture drug screen data taken from Straussman et al. [41]. (Fig 2.1) shows an example of a co-culture experiment from the drug screen. For each cancer cell line the figure shows (HT-29), a number of stromal cell lines (HDF, HUVEC, LL86, Wi-38) which are grown in co-culture with and without the drug (Gemcitabine). There are quadruplicates for each condition and the measurements of GFP labeled cancer cell counts are averaged over these repli-cates.
The effect of stromal cells on cancer cells under drug conditions were first normalized by their effect on cancer cells without the drug. For example, from the labels in Fig 2.1 the effect of the HDF stromal cells on the HT-29 cancer cells is given byB/A, that is, the count of cancer cells with drug divided by count of the cancer cells without drug. Then the rescue score was calculated as the relative proliferation with stroma minus the relative proliferation without stroma. The rescue score of cancer cell line HT-29 by stromal cell line HDF is given below:
Rescue
(
HDF confers to HT-29
)
=
B
A
−
D
C
Figure 2.1:Rescue of colorectal cancer cell lines from gemcitabine (Gem) by HDF stromal cells.HT-29 was treated with 0.02µM Gemc-itabine. Fluorescence microscopy looking at GFP positive can-cer cells at day 7. All 4 quadruplicate wells are shown.
2.1.1
Mean drug rescue score in co-cultures treated with
differ-ent drug dosages
We ran a preliminary statistical analysis of the co-culture drug screen. To iden-tify drug and dosage combinations that exihibit stromal-mediated rescue of can-cer cell lines. We calculated an average rescue score for each drug dosage, av-eraging across all the cancer and stromal co-cultures that were performed for that drug dosage (Fig. 2.2). We found that stromal cell lines mediate rescue of cancer cells in many targeted therapies but not for chemotherapeutic drugs. Chemotherapeutic drugs such as docetaxel, fluorouracil, caboplatin, paclitaxel, doxorubicin, gemcitabin, etoposize all have low mean rescue score while tar-geted therapies imatinib, erlotinib, afatinib, gefetinib, vemurafenib all have a higher range of rescue scores. We found the mean rescue score for PLX4720
in-creases as the dosage of PLX4720 inin-creases. Some of the other drugs of interest include SB590885, another BRAF inhibitor used in the treatment of melanoma. Since we have several drugs with high mean rescue scores that are either BRAF inhibitors or MEK inhibitors used in melanoma and we have validation data pertaining to PLX4720 from the original study, we decided to focus our initial studies on PLX4720 treated melanoma cell lines.
2.1.2
Dosage comparison of stromal mediated rescue in
melanoma and colorectal co-cultures treated with PLX4720
We plotted the relative proliferation of the cancer cells with stromal cells against the proliferation of cancer cells without stromal cells in 7 melanoma cell lines treated with PLX4720 (Fig. 2.3). Here the distance from the diagonal indicates the magnitude of rescue or sensitization for the drug. We see that higher doses of the drug cause more killing of cancer cells and therefore lower cell counts increasing the potential for rescue stromal cells. There is also a bimodality in the relative proliferation for each set of co-cultures treated with the drug dosage. We see that for a subset of our cancers the drug has little effect, and there is also a cluster of cultures with low relative proliferation where the drug has a large effect. Stromal cells tend to mediate stronger rescue in the higher doses of PLX4720.
We also plotted the relative proliferation of cancer cells with stroma against the proliferation of cancer cells without stroma in 5 colorectal cancer cell lines treated with PLX4720 (Fig. 2.4). There is less drug efficacy of PLX4720, since
5-Fluorouracil_100 5-Fluorouracil_200 Gemcitabin_0.1 Gemcitabin_0.3 Irinotecan_50 Oxaliplatin_40 Docetaxel_0.01 Docetaxel_0.03 Docetaxel_0.1 Doxorubicin_0.03 Doxorubicin_0.3 Doxorubicin_1 5-Fluorouracil_50 Carboplatin_10 Carboplatin_40 Docetaxel_0.005 Methotrexate_0.1 Methotrexate_0.5 Paclitaxel_0.01 Paclitaxel_0.05 5-Fluorouracil_4 5-Fluorouracil_20 5-Fluorouracil_150 Carboplatin_5 Carboplatin_20 Carboplatin_50 Docetaxel_0.003 Doxorubicin_0.02 Doxorubicin_0.2 Doxorubicin_2 Etoposide_0.5 Etoposide_5 Etoposide_8 Etoposide_20 Irinotecan_2 Irinotecan_10 Irinotecan_25 Vincristine_0.003 Vincristine_0.01 Vincristine_0.1 Vincristine_0.15 Vinorelbine_0.06 Vinorelbine_0.3 Vinorelbine_2 Gemcitabin_0.02 Oxaliplatin_20 Docetaxel_0.3 Etoposide_30 Crizotinib_0.2 MK-2206_1 PD184352_0.5 PD184352_1 PD184352_2 PD184352_4 PLX4720_0.5 PLX4720_1 PLX4720_2 PLX4720_4 Dasatinib_0.25 Dasatinib_1 Dasatinib_2 BIBW2992_0.05 BIBW2992_0.1 BIBW2992_0.2 Canertinib_2 Lapatinib_0.3 Lapatinib_0.5 Lapatinib_1 Lapatinib_2 Lapatinib_3 Lapatinib_10 Vorinostat_5 Dasatinib_4 Gefitinib_2 Gefitinib_4 Lapatinib_4 BEZ235_5 Bortezomib_0.25 Erlotinib_0.2 Erlotinib_2 Erlotinib_20 PI-103_10 AZD6244_1 AZD6244_2 AZD6244_4 SB590885_8 Bortezomib_0.5 CL-387785_2 Vandetanib_4 Vorinostat_1 Dasatinib_0.02 Dasatinib_0.1 Dasatinib_0.5 Imatinib_0.1 Imatinib_0.5 Imatinib_2.5 Sunitinib_0.02 Sunitinib_0.1 Sunitinib_0.5 BIBW2992_0.03 Canertinib_0.5 CL-387785_0.1 CL-387785_0.5 Erlotinib_0.5 Gefitinib_0.1 Gefitinib_0.5 Vandetanib_2 AZD6244_0.5 SB590885_1 SB590885_4 ABT-263_0.01 ABT-263_0.1 ABT-263_0.5 ABT-263_1 ABT-263_2 Fulvestrant_0.01 Fulvestrant_0.1 Fulvestrant_0.5 Fulvestrant_1 Crizotinib_0.5 Crizotinib_1 Crizotinib_2 Crizotinib_4 NVP-TAE684_0.0625 NVP-TAE684_0.125 NVP-TAE684_0.25 NVP-TAE684_0.5 NVP-TAE684_1 NVP-TAE684_2 -0.10 -0.05 0.00 0.05 0.10 0.15 0.20
Mean rescue score by drug dosage
Mean rescue scores
Tar get ed T her ap y Chemother ap y
Figure 2.2:Mean drug rescue score averaged across all tumor-stromal co-cultures indexed by the drug dosage.The average rescue score for co-cultures treated was calculated and plotted for each drug dosage.
colorectal cell lines continue to proliferate even in the presence of PLX4720. We see that rescue is much greater across melanoma cell lines than across colorec-tal cell lines where even in cell lines sensitive to the drug with few examples far from the diagonal. This shows there is a difference in the rescue conferred by the stromal cell lines to the two different types of cancer cell lines treated with PLX4720, and stromal cells tend to elicit drug resistance in melanoma cells against PLX4720.
2.2
Correlation Analysis
2.2.1
Reanalysis of the correlation in cytokine arrays with
av-erage rescue score of melanoma cell lines treated with
PLX4720
To identify the cytokines that are potentially eliciting innate resistance in cancer cells to targeted drug therapies, we performed a correlation analysis, correlating cancer cell line rescue scores with the cytokine expression levels secreted by stromal cell lines. We first calculated the correlations between proteins secreted by stromal cells and stromal average melanoma rescue scoresRM (the average rescue score over 7 melanoma cell, one for each stromal cell line), reproducing the results in Straussman et al. to make sure our data analysis is consistent. Then we performed the correlation analysis with individual cell lines, treating dosages for each drug separately, and computed the distribution of correlation
0.0 0.2 0.4 0.6 0.8 1.0 1.2 0.0 0.2 0.4 0.6 0.8 1.0 1.2
Rescue of melanoma cancer cell lines by stroma under PLX4720
Relative Proliferation Without Stroma
R el at ive Pro lif era tio n W ith St ro ma PLX 4.0 µM PLX 2.0µM PLX 1.0µM PLX 0.5µM
Figure 2.3:Relative proliferation with stroma versus relative prolifer-ation without stroma in melanoma cancer cell lines. The relative proliferation of the cancer cells in co-culture with melanoma cell lines was plotted against the relative prolifer-ation of cancer cells in monoculture for cancer cell lines treated with vemurafenib.
scores across the different dosages.
The stromal cell cytokine data set consisted of two types of antibody arrays: a Human Cytokine Array G4000 and a Biotin Label-based Human Antibody ar-ray were used to measure proteins secreted into the media by each of 18 stromal cell types [41]. The arrays measure 274 and 507 secreted proteins respectively.
0.0 0.5 1.0 1.5
0.0
0.5
1.0
1.5
Rescue of colorectal cancer cell lines by stroma under PLX4720
Relative Proliferation Without Stroma
R el at ive Pro lif era tio n W ith St ro ma PLX 4.0 µM PLX 2.0µM PLX 1.0µM PLX 0.5µM
Figure 2.4:Relative Proliferation with stroma versus relative prolifera-tion without stroma in colorectal cancer cell lines. The rel-ative proliferation of cancer cells in co-culture with colorectal cell lines was plotted against the relative proliferation of can-cer cells in monoculture for cancan-cer cell lines treated with vemu-rafenib.
The resulting antibody arrays were normalized using internal controls and the values of cytokines in clear media containing 10% FBS were subtracted. After filtering out the low level cytokine expression values (expression of >50 in at least one stromal cell line), measurements for 85 and 414 cytokines remained from each array. A correlation coefficient was calculated for each cytokine be-tween its log2-transformed secretion level by all 18 stromal cell lines and the
average melanoma rescue score of each of these cell lines. The mean melanoma rescue effect of each stromal cell line (RM) was calculated by averaging the res-cue scores of the this cell line across all melanoma cell lines and all PLX4720 concentrations. If a drug did not reduce proliferation to below 0.3 for a cancer cell line in monoculture, we removed this drug/cell line pair from the analysis. After this filtering step, for each cytokine, we correlated the melanoma rescue score over 18 stromal lines (RM) with the expression level of the cytokines across these stromal lines. HGF is a prominent cytokine with high correlation with the mean stromal cell line’s rescue score, but there were also other cytokines with high correlations such as GDF9 and uPA (with positive correlation) and IL-3 (with negative correlation) (Fig. 2.5, 2.6).
2.2.2
Analysis of the correlation in cytokine arrays with
res-cue scores in individual melanoma cell lines treated with
PLX4720
To examine if there are cytokines other than HGF that contribute to rescue, we proceeded to perform the correlation analysis with the individual melanoma cell lines, instead of the averaged stromal rescue score. We also treated the drug dosages separately and looked at the distribution of correlation scores across different dosages (Fig. 2.7, 2.8, 2.9, 2.10). Here we show the correlation of HGF cytokine expression level with PLX4720 at 1µM and 2 µM. We see that HGF under the drug PLX4720 does score a high median correlation in the cancer cell lines but is not the only cytokine correlating with the rescue scores. Also there are cytokines with high negative correlation with rescue such as IL-6 and IL-3
, suggesting that when these cytokines are present, the targeted therapy may work more effectively. Other cytokines such as GDF9 and VEGF (with positive correlation) are potentially interesting as well.
2.2.3
Correlation analysis for cancer subtypes across
co-cultures treated with anticancer drugs
We performed a correlation analysis across 15 anti-cancer drugs and 44 cy-tokines in the smaller cytokine array. 44 cytokine measurements were obtained from the normalized cytokine array filtered with an expression cut off of 0.75 af-ter normalization. We calculated the correlation of the stromal cytokines and the rescue scores for cancer cell lines across the stromal cell lines. For each cancer type, we averaged the correlations across all the cancer cell lines of that type to create an average correlation score. For 44 cyokines in the normalized cyokine array and across all active drug dosages, we produced a ranked list of pearson correlation scores for different types of cancer. From our ranked list, the highest scoring cytokine was GM-CSF whose cytokine secretion was highly correlated with rescue in melanoma in co-cultures treated with SB590885 4µMwith a cor-relation 0.70 (Fig. 2.11). The next two highest scoring cytokines were HGF in melanoma cell lines treated with PLX4720 4 µM and 2 µM whose correlations were both 0.68 (Fig. 2.12, 2.13). The fourth highest scoring cytokine was MMP-10 in melanoma cell lines treated with PLX4720 1µMwith correlation 0.65 (Fig. 2.14). In breast cancer cell lines, the highest scoring cytokine was VEGF-C in co-cultures treated with afatinib 0.05µM (r= 0.58) (Fig. 2.15). In head and neck cancer cell lines the highest scoring cytokine was MMP-10 in lapatinib 4 µM
treated cell lines (r= 0.57) (Fig. 2.16). In non-small cell lung cancer the highest scoring cytokine was HGF in afatinib 0.03µM treated cell lines (r = 0.54) (Fig. 2.17).
Figure 2.5:Correlations for each of the cytokines in cytokine array one with stromal average melanoma rescue score RM. The corre-lation of the secretion of each cytokine in cytokine array one with the stromal average rescue score for melanoma cell lines treated with PLX4720 was calculated. The stromal average res-cue score for melanoma was calculated for each of the stromal cell lines as the average rescue score across all melanoma cell lines in co-culture with the stromal cell line.
Figure 2.6:Correlations for each of the cytokines in cytokine array two with stromal average melanoma rescue score RM. The corre-lation of the secretion of each cytokine in cytokine array one with the stromal average rescue score for melanoma cell lines treated with PLX4720 was calculated. The stromal average res-cue score for melanoma was calculated for each of the stromal cell lines as the average rescue score across all melanoma cell lines in co-culture with the stromal cell line.
−0.5
0.0
0.5
Boxplot of Correlations of Cytokines with Rescue − PLX 1.0 uM
Cytokines Correlation ● ● ● ● ● ● ● ●●●● ● ●● ● ●● ● ● ● ● ● ● ● ● ●● ● ● ● ● ● ● ● ● ●● ● ● ● ● ● ● ● ● ● ● ● ● ● ● ● ● ●● ● ●● ● ● ● ● ● ● ● ●● ● ● ● ● ● ● ● ●● ● ● ● ●● ● ● ● ● ● HGF MMP−10 LAP GDF−15 Amphiregulin sgp130 MCP−1 sTNF RI BDNF MIF VEGF−C Angiopoietin−1 Follistatin IGFBP−4 FLRG IGFBP−6 Osteoprotegerin TIMP−2 LYVE−1 IGF−II GRO−alpha IL−15 Trappin−2 bFGF MIP−1 alpha MCP−2 IL−1 beta PIGF GITR MIP−3 alpha GCP−2 PDGF AA S−100b Nidogen−1 uPAR IL−1 alpha GDNF Thyroglobulin Activin A IL−3
Figure 2.7:Box plots of correlations of cytokines secretion in cytokine array one with rescue of melanoma cell lines treated with PLX4720 1 µM. Here we plot box plots of the correlations of each of the cytokines in cytokine array one with the rescue scores from the melanoma cell lines under the drug PLX4720 1µM.
−0.6 −0.4 −0.2 0.0 0.2 0.4 0.6 0.8
Boxplot of Correlations of Cytokines with Rescue − PLX 1.0 uM
Cytokines Correlation ● ● ● ● ● ● ● ●●● ●●● ●● ●●●●●● ● ●●●●● ● ●●●● ●●●●● ●●●● ●● ●●●●● ●●●●●●●●●●●●●●●●●●●●●●●● ●●●●●●●●●●●●●●●●●●● ●●●●●●●●●●●●●●●●●●●●●●● ●●●●●●●●●●●●●●●●●●●● ●●●●●●●●●●●●●● ●●●●●●●●●●●●●● ●●●●●●●● ●●●●●●●●●●●●●●● ●●●●●●●●●● ●●●●●●●●●●●●●●●●●●●●●●●●●●●●●●●●●● ●●●●●●●●● ●●●●●●●●● ●●●● ●●●●●●●●●●●●●●●●●●●●●●●●●●●●●●●●●● ●●●●●●●●●● ●●●●●●●●●●●●●●●●●●●●●● ●●●●●●●● ●●●●●●●●●●●● ●●●●●●●● ●●●●●●●● ●●●●●●● ●●●●● ●●●●●● ●●● ● ●●●● ●●●●●● ●●● ● ●●●●●●●● ● ●●●● ● ● ●● ●●●●●● ●● ● GDF9 HGF IL−17B R uPA IFN−gamma Angiopoietin−2 Galectin−3 NRG3 IL−1 ra CNTF NAP−2 MMP−19 IL−2 MMP−13 GDF−15 IL−15 R alpha MMP−14 sFRP−1 IL−18 R beta/AcPL CTACK / CCL27 MIP−1d MIP 2 Thrombospondin−2 TRAIL R4 / TNFRSF10D TNF−beta IL−6 LBP S100A10 TRAIL R2/ DR5 / TNFRSF10B TWEAK R / TNFRSF12 Pentraxin3 / TSG−14 Smad 4 sFRP−4 TRAIL R1 / DR4 / TNFRSF10A Progranulin PECAM−1 /CD31 CV−2 / Crossveinless−2 Thrombospondin (TSP) IL−13 Smad 5
Figure 2.8:Box plots of correlations of cytokines secretion in cytokine array two with rescue of melanoma cell lines treated with PLX4720 1 µM. Here we plot box plots of the correlations of each of the cytokines in cytokine array two with the rescue scores from the melanoma cell lines under the drug PLX4720 1µM.
−1.0
−0.5
0.0
0.5
1.0
Boxplot of Correlations of Cytokines with Rescue − PLX 2.0 uM
Cytokines Correlation ● ●● ● ● ● ●● ● ● ●● ●● ● ● ● ● ● ●● ●● ● ● ● ● ● ●● ● ● ● ● ● ● ● ● ● ● ●● ● ● ● ● ● ●● ● ● ● ● ●● ●● ● ● ● ● ● ● ● ● ● ● ● ● ● ● ● ● ●● ● ● ● ● ● ● ● ● ● ● ● ICAM−1 HGF MIF Amphiregulin FLRG IGFBP−1 GM−CSF MIP−1 alpha GCSF GDF−15 ENA−78 sgp130 GITR MCP−1 Furin GRO−alpha BDNF VEGF sTNF RI IFN−gamma DKK−3 CNTF Ubiquitin+1 Eotaxin−3 IL−2 R alpha 1 Thyroglobulin beta IG−H3 IL−8 FGF−6 hCGa, intact MCP−2 CA19−9 IL−15 BCMA IL−17R IGFBP−4 Carbonic Anhydrase IX DKK−1 Nidogen−1 GCP−2
Figure 2.9:Box plots of correlations of cytokines secretion in cytokine array one with rescue of melanoma cell lines treated with PLX4720 2 µM. Here we plot box plots of the correlations of each of the cytokines in cytokine array one with the rescue scores from the melanoma cell lines under the drug PLX4720 2µM.
−1.0
−0.5
0.0
0.5
1.0
Boxplot of Correlations of Cytokines with Rescue − PLX 2.0 uM
Cytokines Correlation ● ●● ● ● ● ● ● ● ●● ● ● ● ● ●●●●●●● ●●●●●●●●● ●● ●●●●●●●●●●●● ●●●●●●● ●●●●● ●●● ●●●●●●●●●●● ●●●●● ●●●●●●●●●●●●●●●●●●●●● ●●●●●●●●●●●●●●● ●●●●● ●●●●●●●●●●●●●●●●●●●● ●●●●●●●●●●● ●●●●●●●●●●●●●●●●●●●●●●●●●●●●●●●●●●●●● ●●●●●●●●●●●●●●●● ●●●●●●●●●●●●●●●●●●●● ●●●●●●●●●●●●●●●●● ●●●●●●●●●●●●●●●●● ●●●●●●●●●●●●●●●●●●●●●●●● ●●●●●●●●●●●●●●●●●●●●●● ●●●●●●●●●●●●●●●●●●●● ●●●●●●●●●●●●●●●●●●● ●●●● ●●●●●●●●●●●●●●●●●●●●●●●●● ●●●●●●●●●●●●●●●●●●● ●●●●●●●●● ●●●●●●● ●●●● ●●●●●● ● Granzyme A IL−17E Angiopoietin−1 FGF−12 Angiopoietin−like 2 Dkk−1 CCR2 Angiostatin MMP−19 MIG HGF Thrombospondin−1 IL−19 MMP−13 VE−Cadherin CXCR6 CD40 Ligand / TNFSF5 /CD154 HB−EGF Activin B IL−11 EG−VEGF / PK1 FGF R3 LIGHT / TNFSF14 TIMP−4 Glut5 ICAM−5 Thrombopoietin (TPO) TSG−6 TACI / TNFRSF13B TGF−beta 1 MMP−11 /Stromelysin−3 TNF−beta IGFBP−1 Leptin R IL−17C Lipocalin−1 Leptin (OB) IL−22 R Follistatin−like 1 IL−1 sRI
Figure 2.10:Box plots of correlations of cytokines secretion in cytokine array two with rescue of melanoma cell lines treated with PLX4720 2µM. Here we plot box plots of the correlations of each of the cytokines in cytokine array two with the rescue scores from the melanoma cell lines under the drug PLX4720 2µM.
−1 0 1 2 3 4 −0.6 −0.4 −0.2 0 0.2 0.4 0.6 0.8 Cytokine Secretion Rescue GM−CSF SB590885 4.0 uM Melanoma: 0.70 MALME−3M: 0.60 SK−MEL−28: 0.76 SK−MEL−5: 0.74 Correlations
Figure 2.11:Box plots of rescue scores plotted against GM-CSF secretion in SB590885 4 µM treated melanoma The rescue scores are plotted as a function of the secretion of GM-CSF secretion in melanoma cell lines treated with SB590885 4µM. The average correlation between the secretion of the cytokine and rescue scores for cancer cell lines for the cancer subtypes is calcu-lated.
−1 0 1 2 3 4 −0.6 −0.4 −0.2 0 0.2 0.4 0.6 0.8 Cytokine Secretion Rescue HGF PLX4720 4.0 uM Melanoma: 0.68 A2058: 0.53 C32: 0.88 COLO 829: 0.72 G−361: 0.87 MALME−3M: 0.46 SK−MEL−28: 0.72 SK−MEL−5: 0.60 Colorectal: 0.13 Colo−205: −0.15 HT−29: −0.04 LS411N: 0.42 RKO: 0.29 Correlations
Figure 2.12:Box plots of rescue scores plotted against HGF secretion in vemurafenib 4 µM treated melanoma The rescue scores are plotted as a function of the secretion of HGF secretion in melanoma cell lines treated with PLX4720 4 µM. The aver-age correlation between the secretion of the cytokine and res-cue scores for cancer cell lines and for the cancer subtypes is shown.
−1 0 1 2 3 4 −0.6 −0.4 −0.2 0 0.2 0.4 0.6 0.8 Cytokine Secretion Rescue HGF PLX4720 2.0 uM Melanoma: 0.68 A2058: 0.50 C32: 0.75 COLO 829: 0.66 G−361: 0.71 MALME−3M: 0.64 SK−MEL−28: 0.84 SK−MEL−5: 0.65 Colorectal: 0.24 Colo−205: −0.35 HT−29: 0.37 LS411N: 0.44 RKO: 0.04 SW1417: 0.70 Correlations
Figure 2.13:Box plots of rescue scores plotted against HGF secretion in vemurafenib 2 µM treated melanoma The rescue scores are plotted as a function of the secretion of HGF secretion in melanoma cell lines treated with PLX4720 2 µM. The aver-age correlation between the secretion of the cytokine and res-cue scores for cancer cell lines and for the cancer subtypes is shown.
−1 0 1 2 3 4 −0.6 −0.4 −0.2 0 0.2 0.4 0.6 0.8 Cytokine Secretion Rescue MMP−10 PLX4720 1.0 uM Melanoma: 0.65 A2058: 0.53 C32: 0.74 COLO 829: 0.67 G−361: 0.85 MALME−3M: 0.63 SK−MEL−28: 0.73 SK−MEL−5: 0.43 Colorectal: 0.38 Colo−205: 0.12 HT−29: 0.49 LS411N: 0.64 RKO: 0.05 SW1417: 0.60 Correlations
Figure 2.14:Box plots of rescue scores plotted against MMP-10 secretion in vemurafenib 1 µM treated melanoma The rescue scores are plotted as a function of the secretion of MMP-10 secretion in melanoma cell lines treated with PLX4720 1 µM. The av-erage correlation between the secretion of the cytokine and rescue scores for cancer cell lines and for the cancer subtypes is shown.
−1 0 1 2 3 4 −0.6 −0.4 −0.2 0 0.2 0.4 0.6 0.8 Cytokine Secretion Rescue VEGF−C BIBW2992 0.05 uM Breast: 0.58 BT−474: 0.64 EFM192A: 0.52 HCC1419: 0.76 MDA−MB−175−VII: NaN MDA−MB−361: 0.30 SK−BR−3: 0.68 Correlations
Figure 2.15:Box plots of rescue scores plotted against VEGF-C secretion in afatinib 0.05 µM treated breast cancer The rescue scores are plotted as a function of the secretion of VEGF-C secretion in breast cancer cell lines treated with afatinib 0.05 µM. The average correlation between the secretion of the cytokine and rescue scores for cancer cell lines and for the cancer subtypes is shown.
−1 0 1 2 3 4 −0.6 −0.4 −0.2 0 0.2 0.4 0.6 0.8 Cytokine Secretion Rescue MMP−10 Lapatinib 4.0 uM HNSCC: 0.57 Cal27: 0.57 FaDu: 0.51 SCC−15: 0.62 SCC−25: 0.71 SCC−9: 0.43 Correlations
Figure 2.16:Box plots of rescue scores plotted against MMP-10 secretion in lapatinib 4 µM treated head and neck cancer The rescue scores are plotted as a function of the secretion of MMP-10 secretion in head and neck cancer cell lines treated with lap-atinib 4µM. The average correlation between the secretion of the cytokine and rescue scores for cancer cell lines and for the cancer subtypes is shown.
−1 0 1 2 3 4 −0.6 −0.4 −0.2 0 0.2 0.4 0.6 0.8 Cytokine Secretion Rescue HGF BIBW2992 0.03 uM NSCLC: 0.54 HCC2935: 0.35 HCC4006: 0.35 HCC827: 0.83 NCI−H3255: 0.61 Correlations
Figure 2.17:Box plots of rescue scores plotted against HGF secretion in afatinib 0.03µM treated non-small cell lung cancerThe res-cue scores are plotted as a function of the secretion of HGF secretion in non-small cell lung cancer cell lines treated with afatinib 0.03 µM. The average correlation between the secre-tion of the cytokine and rescue scores for cancer cell lines and for the cancer subtypes is shown.