THE ROLE OF BANKS IN THE PROVISION OF EXTERNAL FINANCE TO DEVELOPING COUNTRIES
WITH PARTICULAR REFERENCE TO UK BANKS BETWEEN 1970-1980
TERRY JAMES WATSHAM
THE THESIS PRESENTED FOR THE EXAMINATION OF THE DEGREE OF DOCTOR OF PHILOSOPHY AT THE
SCHOOL OF ORIENTAL AND AFRICAN STUDIES, UNIVERSITY OF LONDON
ProQuest Number: 10731463
All rights reserved
INFORMATION TO ALL USERS
The qu ality of this repro d u ctio n is d e p e n d e n t upon the q u ality of the copy subm itted.
In the unlikely e v e n t that the a u th o r did not send a c o m p le te m anuscript
and there are missing pages, these will be note d . Also, if m aterial had to be rem oved,
a n o te will in d ica te the deletion.
uest
ProQuest 10731463
Published by ProQuest LLC(2017). C op yrig ht of the Dissertation is held by the Author.
All rights reserved.
This work is protected against unauthorized copying under Title 17, United States C o d e
M icroform Edition © ProQuest LLC.
ProQuest LLC.
789 East Eisenhower Parkway
P.O. Box 1346
Abstract
The thesis is divided into nine chapters. The first chapter gives an overview of the external financial flows to the Less Developed Countries (LDCs) between 1970 and 1980. It explains why these countries increasingly turned to private sources of external finance and why the banks in particular were willing to provide that finance.
Noting the needs of these countries for continued access to private external finance, the thesis proceeds to investigate four areas fundamental to the continuity of that access. They
are:-1) The determinants of the financial terms of bank and bond finance. 2) The impact of further lending to LDCs upon bank balance sheets. 3) The attitudes of the lending bankers to ways of increasing
private financial flows.
4) The reasons for the limited role played by the eurobond market in providing such finance.
As a preliminary to investigating these points chapters two and three discuss the nature of the eurocurrency market generally, reasons for its growth and the statistical sources relating to that market. Chapter three also develops a theoretical model of the eurobank lending function.
Returning to the fundamental points noted above, chapter four investigates the determinants of the financial terms of private finance ie euro money-market interest rates, the spreads on syndicated loans to LDCs and the interest yield on LDC bond issues.
Chapter five investigates the impact of the growth in bank lending to LDCs upon UK b a n k s ' balance sheets.
Chapter six reviews the literature making suggestions for reducing the risks associated with lending to LDCs. Chapter seven reports results of a questionnaire survey of nearly two hundred London banks regarding the suggestions noted in chapter six. The presumption behind these two chapters is that reduced risk will, ceteris paribus, increase the flow of finance. The responses to the survey confirm the validity of this presumption.
The reasons for the limited role of the eurobond market in providing private external finance to LDCs is investigated in chapter eight with the aid of a second questionnaire. This survey was directed at the London managers of eurobond syndicates.
The last chapter gives a resume of the thesis and makes recommendations for easing the external debt problem of the borrowers and bankers.
3
CONTENTS Page
Preface 12
Chapter 1 : An Overview
1.1 Introduction 13
1.2 The flow of financial resources to LDCs 1970-1980 14 1.3 The need for such growth in financial flows 20 1.4 Why did the developing countries turn to the private
financial markets? 30
1.5 The impact of increased privatisation of the sources
of finance 54
1.6 Why did the commercial banks become such providers
of finance to LDCs during the 1970's? 70
1.7 Summary 79
Chapter 2 : The Eurocurrency Markets
2.1 Introduction 80
2.2 Definition of the eurocurrency market 81
2.3 Measurement of the eurocurrency market 82 2.4 Statistical sources of international bank lending 88
2.5 The use of the eurocurrency market statistics in
this thesis 89
H
Page Chapter 3 : The Growth of the Eurocurrency Market
3.1 The literature 99
3.2 The role of marketing in the growth of the eurocurrency
market 109
3.3 A theory of the eurobank lending function 114
3.3.1 A theory of the eurobanking firm 119
3.4 Conclusion 133
Chapter 4 : The Financial Terms of Bank Finance to LDCs
4.1 Introduction 135
4.2 Factors influencing the level of eurocurrency interest
rates generally 136
4.2.1 Inflation 138
4.2.2 Currency of denomination 140
4.2.3 The relationship between domestic and euro interest rates 141 4.2.4 The term structure of interest rates 151 4.3 Factors influencing interest costs specific to
eurocurrency loans 168
4.3.1 Specification of the yield variable 169
4.3.2 The supply price 173
4.3.3 The demand price 184
4.3.4 The simultaneous equation model 187
4.4 Factors influencing the rate of interest specifically
in the eurobond market 193
4.4.1 Introduction 193
4.4.2 Definition of yield 194
4.4.3 The risk structure of interest rates 195
5
Page Chapter 5 : The Impact of the Increased Private Financial Flows
to Developing Countries upon the Quality of Banks' Balance Sheets
5.1 Introduction 208
5.2 Growth of worldwide international bank lending to
developing countries 211
5.3 Growth of net bank exposure to developing country
borrowers 213
5.4 Growth of UK bank lending to developing countries in
relation to the banking system's capital base 215 5.5 Growth of bank lending to developing countries compared
w ith the growth of banks' balance sheets 222
5.6 Servicing of the growing developing country debt 225
5.7 The net transfer of funds 237
5.8 The degree of diversification in bank loan portfolios 240
5.9 Maturity transformation 250
5.10 The maturity profile of developing country debt 253
5.11 Conclusions 256
Chapter 6 : Increasing the Access of Developing Countries to the Private Financial Markets
6.1 Introduction 258
6.2 The risks associated with international banking 260 6.3 Reducing the actual or perceived risk of lending to
developing countries 264
6.4 Reducing the interest element of the debt service burden 265
6.5 Restructuring debt 270
6 . 6 Improved information flows for country risk analysis 287
6
Chapter 6 cont
Page
6 . 8 Bank credit insurance and loan guarantees 295
6.9 Prudential monitoring and regulation of bank lending 301
6 . 1 0 Lender of last resort 318
6.11 Bank deposit insurance schemes 323
6 .12 Portfolio diversification 326
Chapter 7 : The Survey
7.1 Introduction 329
7.2 Section I of survey 332
7.2.1 Constraints on and risks of lending to LDCs 332 7.2.2 Corporate objectives of banks lending to LDCs 335
7.3 Section II of survey 338
7.3.1 Reducing the debt service burden of interest payment 338
7.3.2 Debt restructuring 341
7.3.3 Improving the quality of information about LDCs 344 7.3.4 Co-financing with IBRD or similar international
institutions 346
7. 3.5 Credit insurance and loan guarantee schemes 348
7.3.6 Prudential controls 351
7.3.7 International lender of last resort 354
7.3.8 Miscellaneous questions 356
/
Page Chapter 8 : The Eurobond Market and Developing Countries
8.1 Introduction 363
8.2 The nature of the eurobond market 367
8.3 The nature of a eurobond 371
8.4 The questionnaire 376
8.5 The results of the questionnaire 378
8 . 6 Conclusions 387
Chapter 9 : Resume and Conclusions
9.1 Resume 388
9.2 Conclusions and recommendations 392
8
Tables Page
1.1 Net external financial receipts of developing countries
by type and income group 1978 16
1.2 Balance of payments disequilibrium of LDCs 21 1.3 Non oil developing countries: current account financing
1973-80 22
1.4 Growth of developing country imports 24
1.5 Growth of developing country exports 25
1.6 Savings and investment as a percentage of developing
country GNP 26
1.7 Index of oil exports to non oil LDCs 27
1.8 LDC exports (less fuel) to developed market economies 28
1.9 The IMF subsidy account 37
1.10 The allocation of SDRs to IMF members 39 1.11 Actual drawings by non oil exporting LDCs 1970-80 41
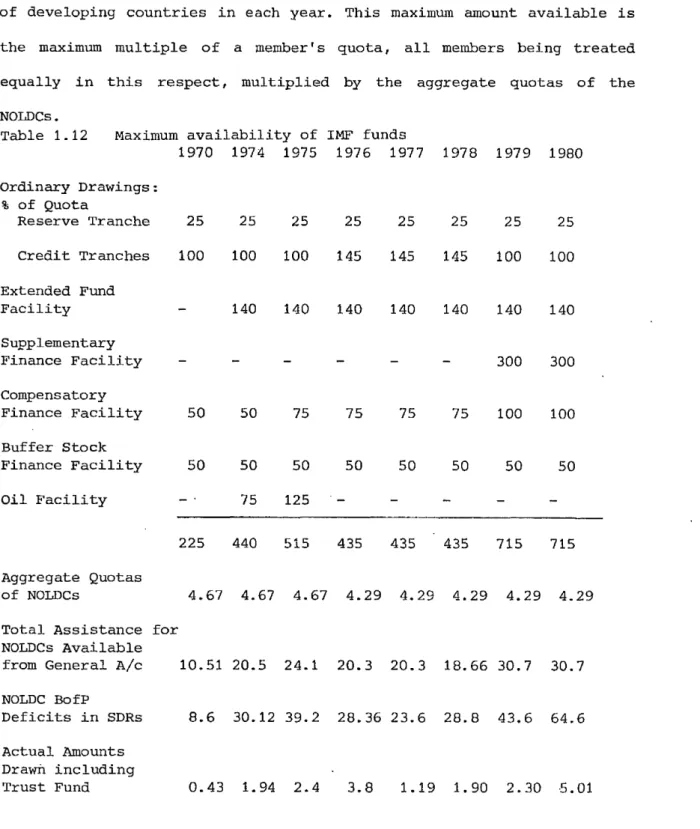
1.12 The maximum availability of IMF funds 42
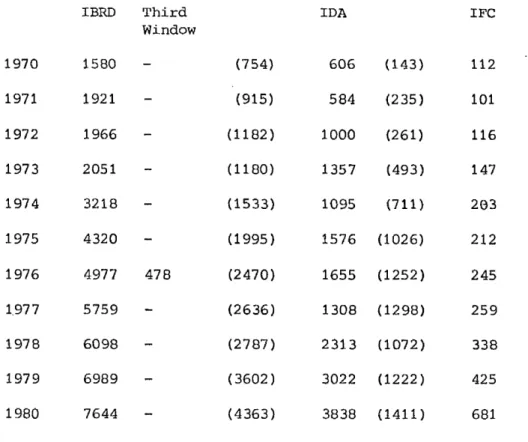
1.13 Annual lending by I B R D, IDA and IFC 1970-80 47 1.14 Capital and reserves and loans outstanding of IBRD
1970-80 49
1.15 Net flows of aid to developing countries by group
of donor 52
1.16 Comparison of interest and amortisation ratios between different income groups of borrowers and between
sources of funds 56
1.17 Currency classification of IBRD borrowing outstanding
30.6.80 64
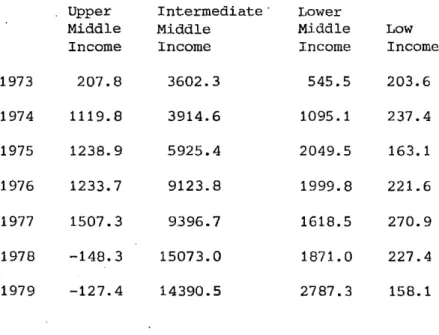
1.18 Net transfer by banks to developing countries 1973-79 66
1.19 Net transfer by banks to borrowers classified by
income group 68
1.20 External claims and liabilities of UK banks to developing
9 1. 21 1.22 1.2 3 1.24 2.1 2.2 2.3 2.4 3.1 4.1 4.2 4.3 4.4 5.1 5.2 5. 3 Page
External claims of US banks 1972-77 72
Best loan conditions available to selected public
sector borrowers 74
Average spreads and maturities of euroloans to
selected developing countries 75
Purchasing power of export revenue 76
Foreign currency deposits of UK residents with UK
banks 1973-79 86
Various measures of the eurocurrency market 1971-80 87 Currency classification of the London Eurocurrency
Market 87
The importance of the US $ in the global Eurocurrency
Market 1972-80 88
Maturity analysis of net position of UK banks
and certain other institutions 108
Size of the US $ domestic and eurobank deposit markets- 142 The impact of capital controls on eurocurrency interest
rates 146
The impact of selected market imperfections upon the relationship between US domestic and eurodollar interest
rates 149
Eurodollar CD and interbank interest rates in London 205
Comparison of growth of loans, exports and GNP 212 Net bank exposure to developing country borrowers 214 Ratio of capital to non resident loans 1978, 1980
10
Page 5.4 Proportion of total UK banks external claims due to
UK registered banks 218
5.5 UK registered banks exposure to 15 major LDC borrowers 219 5.6 Growth of UK bank lending to LDCs in relation to growth
of balance sheets 222
5.7 Spreads over LIBOR 1977-80 224
5.8 The changing burden of amortisation 1976 and 1980 228
5.9 The effect of inflation on a loan 230
5.10 The impact of interest rates on debt service burden
1976 and 1980 231
5.11 The changing importance of floating rate loans 232 5.12 The average grace periods on loans 1971 and 1980 235 5.13 The impact of short term debt upon total debt service 236
5.14 Net transfer from financial markets 239
5.15 The maturity distribution of net assets or net
liabilities of UK banks 250
5.16 The maturity distribution of assets of reporting banks vis-a-vis countries outside their own area, mid 1978
to mid 1983 252
5.17 The maturity profile of external debt of the UK banks
June 1982 254
6.1 Signed co-financing agreements between the World Bank
and private banks December 1975-July 1979 293
8.1 Comparison of the value of bond issues and bank loans 364 8.2 International bond disbursements to LDCs 364 8.3 Major currencies used in bond issues 1971 and 1980 365 8.4 The dominant currencies in the eurobond and foreign
bond markets in 1980 366
11
List of Figures Page
3.1 The impact of a shift in supply upon euromarket size 102 3.2 The impact of a shift in demand upon euromarket size 108 3.3 The impact of marketing upon euromarket size 111 3.4 The impact of marketing upon the spread between bid and
offer rates 112
3.5 The fixed and variable cost functions of a eurobank 123 3.6 The short run average total cost and marginal cost
functions of a eurobank 124
3.7 The long run cost functions of a eurobank 126
3.8 The revenue functions of a eurobank 128
3.9 The long run equilibrium of a eurobank 131
4.1 The relationship between US inflation and eurodollar
interest rates 139
4.2 Eurobond yield curves of selected LDC bonds (US $ bonds) 200 4.3 Eurobond yield curves of selected LDC bonds (Euro
Deutschmark bonds) 201
5.1 Efficient portfolios: two assets 242
5.2 Efficient portfolios: many pairs of assets 242 5.3 Choice of efficient portfolio with risk free asset
and borrowing 243
5.4 Choice of optimum portfolios 244
5.5 Choice of optimum portfolios with different rates of
Preface
This research was started in the spring of 1979. Since 1980 it has been generously supported by Brighton Polytechnic who have met the financial costs and sympathetically arranged my teaching so that the research work could be carried out.
Many people have provided personal encouragement and assistance over the last five years. At the School of Oriental and African Studies a particular debt of gratitude is owed to Peter Ayre, my supervisor, for his continuous encouragement and guidance towards the final objective.
At Brighton Polytechnic particular thanks are due to Dr Ken Midgley, Head of the Department of Finance and Accountancy, for his personal encouragement. M y other colleagues in that department have also been very helpful. Thanks are also due to Miss Liz Colley in the Brighton Polytechnic Computer Centre for assistance with computer applications.
This research could not have been completed without the help and cooperation from the one hundred or so bankers in London who, too numerous to mention by name, have each individually contributed to my greater understanding of their'operations and attitudes.
Finally, a warm thank you must go to Mrs Sharon Blows who has managed to transform m y almost illegible script into the final copy of this thesis.
13
Chapter 1
AN OVERVIEW 1. 1 Introduction
The United Nations designated the 1970's as the second development decade. Development did indeed take place. The poor countries of the world experienced an annual rate of growth of GNP averaging 5.375%. Populations also grew, making the increase in per capita GNP average 3.3% according to World Bank figures. The same institution estimates that the rate of gross investment averaged 26.025% per annum while the savings rate averaged 25.375% per annum, (World Bank Annual Report 1982, p l 3 0 ) .
These rates of growth and investment were achieved with the assistance of flows of external financial resources to these countries. Financial flows can be classified into those that create debt obligations and those that do not. The former consist of the many forms of borrowing that take place in international financial markets, or from governments, or from the suppliers of goods and services. The latter consist of direct investments, and of grants and gifts, generally in the form of aid to governments.
This study is about a section of debt creating flows - the borrowings from financial institutions. In particular, the aim of the research is to analyse the role of financial institutions in providing or facilitating the financial flows to developing countries via the eurocurrency markets between 1970 and 1980. Where possible or appropriate, the role of financial institutions located in the United Kingdom will be highlighted. Moreover, where events make it apposite, the time period of analysis is extended to the time of writing (end 1983).
In the context of this research the term "UK Financial Institutions" includes the United Kingdom offices of financial institutions registered abroad.
14
i .2 The Flow of Financial Resources to LDCs 1970-1980
During the decade of the 1970's total annual net resource receipts by the less developed countries (LDCs) grew from US $20.04 billions in 1970 to US $96.05 billions in 1980 according to OECD data,
(OECD 1983). During this period Official Development Assistance grew from US $8.23 billion or 41% to US $37.33 billion or 39% of the total. Non-concessional Flows, on the other hand, grew from US
$10.95 or 54% to US $56.41 billion or 59% of the total.
Of the Non-concessional Flows US $9.08 billion or 45% were from private sources in 1970 whereas US $45.04 billion or 46% were from private sources in 1980.
Of these private sources of finance, direct investment constituted US $3.69 billions or 18% in 1970 compared with US $10.54% billion or 11% in 1980. This decline has been compensated for by the rise in private debt creating flows from US $5.39 billion or 27% to US $34.5 billion or 36% over the same period.
A notable feature is that private flows were greater in the years 1978 and 1979 (ref Table 111-1 OECD 1983), when the proportions of private flows in total flows were 55% and 52% respectively, than they were in 1980.
It is to be expected, a priori, that the benefits derived by a recipient country are positively related to the quantity of funds received. Therefore the distribution of the total flow between types of recipients, as well as the types of flows, where these have different terms attached, is an important consideration in this respect.
Below, the distribution of the total flow for 1978 is given. The classification of developing countries follows that used by the OECD. An alternative classification used by the IBRD is also used in this study where the data require it. Appendix 1 to this study gives details of these classifications.
It can be seen that the majority of the concessional flows go to the poorest countries while most of the non-concessional flows go to the richer developing countries particularly the newly industrialised
countries (NICs).
It is particularly notable that the distribution of financial resources between LDCs bears little relation to the recipients' share of total LDC population. For example in 1978 the NICs had 15.7% of the total population but received 28.7% of total external financial resources. The least developed countries (LLDCs) had 11.7% of population but only received 6.0% of total external financial resource
16 ,0 G B u> a) •H 54 ■P O G M 3 Ph O CO o o Cn 54 o> .G p o
ft
G o 54ft
aj a o o G ■H t£j G G 4-J 0 ) U >i H .O £ 01 QJft
54 P G G O Uft
gft
&ft
a> > 0) to m 0 G 01 pft
•H 0J O (U 54 G ■H O G G Gft
ft
d P 54 GJ P X 0) P cu s i—1 CN o ft f t p- 00 CN tH 1-4 i—l o i—ift CN o o f t d ,— „ • • a t < > ,. « , a a a 0 P 'sf ft ft CO ft i-H ■d1CN o ft o ft i—4 ■N1 rH ft O o 1-4 CO "H 1 CN i—i • 1 O cff>p "— ' i—i p 0 •H P- o CO CD ft i—i 00 ft CO ft ft CN ft CO ft 00 i— I a—* CO CD o ft CO i—4 o 1 'CF ft O ft "CF cn i— 1 f t o i—i ■N1 ■N1 P- rH rH T—| CN rH p-*H -rH CN tH 'iF toS i ft ft CN p- o P> o CD *cF o ft i—4 i—4 rF *— 1 O ft d r-i 4 > • ■ • ■ ' ■ • a a a , . 0 P CN CN o o 1—I ft -cF ^F O CD 'cF 'CF CN o O O o 1-4 ft ft NF ft i—i O <JP p •— ' rH p o ft CD O ft p- CN P- CN ft ft ft 00 ft oft a— a i—t CN o 'CF 'd» CD ft CD cn i—4 cn ft rH CO
i— 1 i-H CD ft 1-1 i-H CD 00 CD P' 00 CO o CN CN -H i-t ft ^F ft CN ■N* -bo-Si '— ' iH t—i •— 1 p- 00 ft ft O vF i—I 00 P- 00 cn cn CO CO ft O p d .— . • I * ■ i < • » ■ a a 0 P o r~ ft ft ft CN CN rH 1—4 ft CN o <cF H ft ft O 0 t-l ft CN CD CN i—l t—1 i—4 o dp p '— ’ rH p 0 -H CN ft 'cF ft CN P- CN 00 ■^F cn ft cn CO cn cn cn i— 1 ft CN O ft P- CN ft t—i ft ft p- o p- CD CN rH i— 1 t— 1 CO CD -CF ft iCF P' ft 'sF CN CD ft ft ft ft 00 CD
•H ft CO ft i—t 1—i 'iF -sF ft CN ft rH ft
■w-Si 1-4 CN i— i CN ft CN i—l CO ft O cn cn O CO ft p- 1 O p d • • • » t « t > . , . . , 0 P ,— . CN tH O o O P- O CO CO 'sF d ft o in o O 0 CO ft ft CN O dP P '— ' rH P o ■H i-t o o p~ nF 00 ft CN o 00 CN CD ft in ft cn i-H O ft »^F ft T—1 T—1 CN ft ft O CN ft CD o CN rH i— 1 .— 1 ft ft ft CD 00 o i—l cn ft CO -H p- CN tH T—1 CN i—4 ft H CN -W3-Si CN 1 CN ft H o ft ft CO ft CD CD ft o ft CD ft CD CD O P d a • • • ■ . . ■ • 0 p .— i—1 CO P' ft ft CO ft O CD CN d <=F i—i ft CD O 0 CD P- ft CN CN O dP P 1 rH P 0 •H o t-H CN H CD O ft ft CD O CD ft CD CD tH o t— 3 H O o CN r- ft 1-4 CN P- ft P- 00 r-> ^—E rH r-1 CO ft ^F P- ^F O 1—1 CN ft 00 CO CN CO CN cn •H ft ro CD i—i ^F ft rH 1—4 rH 00 bO- aQ ~ ~ H 1-1 ft CD ft O ft T—| o CD o ft P- O i—4 i—i CN o P A} ■ • • • • ■ • . a 0 P _ ft sF ft t-( ft p'ft o ft CD ft 1-4 ft ft o 0 ft tH CD CN vH T—3 o df> p rH p o ft •H ■—' "sf CD H ft ft O ft o r- ft CO P- o ft cn rH + + ft 00 cn rH i—i P- CD cn ft ft CN ft cn 'sF i— 1 .-• ft .— . 00 r-« ft CO CN ft CD ft rF t-H ft CO P- ft o ft •H ft It p- CN CN CN ft i—1 CN CN CO CN sF cn ft CN ft to- p 1— 1 ■ ■■ CN T—f IN tH CD ■— i ft LO P~ ft P- ft ft CO -sF CD CD cn ft ft CD O p d • • • 1 > • , • a a a a a . O P ft vo ft p- i—l O 00 ft f t f t rH 1-4 *=? CN O 0 CN CN H P- CN i—i \-H rH O dP P '— ' r H P 0 + •H r-i O o co O ft p~ P~ cn 00 ft O 00 o cn i— 1 ft i— i ft CN P- f t CD ft i—t CN cn NF ft CN o 1—4 o i— I .— - i-Hf t f t f t T—1 ft O CN cn CN CD O i—4 CD
*rH i—i II rH ft ft CN in i—i CO CN ft CN CN cn i—ii - 4 f t CN cn
to-Si v-> 1—1 CN i—1 ft CN 1-4 i—4 p~
G P O P i—1 d ■—i d c d S4 rH 0 tn 54 QJ d •H d QJ 40 CO •H <—i 40 d QJ CO nd d d i—i 40 0) C +J i—J•H d O QJ o •HS i rH C *—i 40 Si ■H U 0 U 40 QJ u O W r—1S i 1 C «=t! < Ph 3 40 c d n « O S o o pq o s 40 0 0) m S r—l 40 f t d 01 *M 01 54 1—1 40 TO QJ QJ d Oh QUO > 40 54 •H 54 H U G d CU QJ to d 0) ■H 40 U ‘ H 40 ’H d QJ 40 O d 40 •OrH « cn 54 -H > O •H U TO 0 ft QJ u 40 QJ *—f a Oh 44 54 54 w r—1 rG d o X O P4 •H Ph 0 40 40 m w Q o £ O 0 B O P - O ^ r o PI h h h in lo ft cd rn p- ■'3' p~ cn ^ i- 4 * - • CN
1
—4
Op- cn
CN CNcn cn
p - CO CN 1—1 CNft
CNft
P- P- i 4 P' CNft
CD cn cn ^F i—4 CNft
ft r- oo m r^ [ O CD p- cn H lO tN I/)ft ft
i —i -iF CNft
CNin
00 cn 00 cn
P ' O O O O O O O O O O o o o o o 1—1 01 d Ph aj G s o 0 o 54 ■H 0 01 0) G o 01 40 O 01 a) G •H QJ o QJ 40 54 G -H d 0 Oh rH r—I o •H 0 d i U Oh40 < G QJ O 0 p O 54 Oh -P O G f t f t f tft ft
O O o O 0 QJ QJ QJ QJ QJ 54 54 54 54 54 d d d d d -G d: rG rC ,Gft ft ft ft ft
ft
p o 54ft
0) a o to p ■H QJ s i pft
p Q to QJ p d u oft
r—I G p p > i H rH d o ■rl s ift
d 5h d u -H s ift
d uft
0 0)ft
QJ 54 d ,G dft
■§ 01 p ■H TO q j p u P p 0ft
x 0) t o p d P p ai a p 01 QJ > tn G 0 •H QJ Cn QJ 40 01 d d > H TO 54 QJ Oh 40 0 54 a 0 O 54 Oh f t 0 QJ 40 54 01 0 TO QJ 01 G 01 40 d G f t f t 0 a G O Cn 01 f t s G 40 O d •H G f t 40 QJ f t QJ 54 G f t 40 O 0 O 0 Oh& S i & a QJ •H G 0 SJ 54 01 0 40 40 01 01 54 > . •rH QJ tu S i TO ■d 40 G 4 0 TO 0 r—1 d QJ 40 to 1—t TO X f t 01 w 0 > QJ & O 40 40 54 d a Oh a >1 QJ •H 1—I S i 01 40 G 40 TO 01 O G 0) f t G 01 0 f t 40 40 d ■H 40 Cn •H TO 54 G 54 QJ d •H d 54 Oh 40 40 a U 54 QJ d 01 0 54 G 4J d Oh O H 54 Oh QJ rG 0 TO G f t U OhQJ 01 X 40 01 01 Q> G to QJ QJ r Q QJ TO TO 40 •H TO 0 0 O 54 G 1—11—! QJ 40 f t U O 54 01 O G X ■r4 f t G 4H w Q TO H ___. .__. d S i O o coft
u <3 Q Q U W o p c Q) aft
oft
CU > 0) Q u - H a o a o o w 13 0) -H > 0) b; qjto
p p o to17
Specific discussion of the distribution of bank debt amongst LDC borrowers is included in pages 54 to 70 below.
Returning to the changes in the quantities of debt during the 1970's, IBRD World Debt Tables (IBRD 1983) show the stock of disbursed debt outstanding to LDCs rising from US $91 billion in 1972 to US $404 billion in 1980. Of these amounts public and publicly guaranteed debt rose from US $ 6 8 billion to US $331 billion and private non guaranteed debt rose from US $21 billion to US $73 billion. However, these figures will under estimate actual debt outstanding. The weaknesses of the statistics covering international debt are discussed in chapter 2 page of this thesis.
Looking in more detail at the public and publicly guaranteed debt onlyjbecause of limitations of data on the private unguaranteed debt, we note that disbursed debt owed to official creditors rose from US $44 billion to US $155 billion between 1972 and 1980. During the same period debt owed to financial markets rose from US $14 billion to US
$154 billion. Thus, whereas official debt constituted 67% of total debt in 1972, it constituted only 46% in 1980. Debt to the financial
markets, on the other hand, only accounted for 21% in 1972 but represented 46% of total debt in 1980.
Accompanying the changing nature of the sources of debt have been changes in the debt servicing commitments and the financial terms attached to the debt. These are discussed in detail on page 55 of this chapter, but at this point a few figures are in order. Between 1972 and 1980 total debt service payments rose over 700% but such payments to the financial market creditors rose nearly 1400% compared with the
1 1 0 0% rise in debt outstanding to those creditors.
The average interest rate on debt to official creditors rose from 4.3% to 5.3% during this period, maturities shortened slightly from 25.3 to 23.7 years, grace period shortened from 6.7 to 6.1 years and the grant element fell from 41.5 to 34 per cent. However, the average
interest rate on debt owed to private creditors rose from 7.3% to 12.8%, the average maturity fell slightly from 9.2 to 8.9 years, grace periods actually rose from 2.9 to 3.4 years and the grant element fell
from 11.1% to minus 12.5 per cent, (IBRD 1983 p3).
The substantial rise in both the amount and relative importance of LDC debt owed to the financial markets, and to the banks in particular begs four q u
estions:-1) Why was there such a need for the financial flows to developing countries to grow as fast as they did?
2) Why have the developing countries turned so convincingly to the private financial markets of the developed
countries for their external finance?
3) How does this shift towards private sources of finance alter the net benefits enjoyed by the borrowers and their ability to service existing and future debt? 4) Why have the private financial sources been so willing
to provide funds to the developing countries?
These questions are answered in the following sections of this chapter. However, analysing the answers raises further fundamental questions. They are:
1) What influences the financial terms attached to bank and bond finance to LDCs?
2) How has this increase in LDC debt influenced bank balance sheets?
3) What factors will help maintain the flow of,particularly^ bank finance to the LDCs?
4) Why has the bond market played such a small role in the external financing of LDCs?
way:-Question one is answered in chapter four where the deter minants of eurocurrency money market and bond market interest rates and the spread on syndicated loans are analysed.
Question two is answered in chapter five by analysing the impact of increased bank lending to LDCs upon the financial health of banks, particularly UK banks as indicated by their balance sheets and profit and loss accounts.
Question three is answered in chapter seven with the aid of the responses of a survey of bankers in the City of London.
Question four is also answered with the aid of a survey of City bankers reported in chapter eight.
As a preliminary to these chapters, an analysis of the mechanics of the eurocurrency market is the subject of chapter two and a model of the eurobank lending function is the subject of chapter three.
20
1.3 The Need for Such Growth in Financial Flows Balance of Payments Deficits
The immediate need for the substantial increase in international financial flows to the developing countries during the 1970's stems from their balance of payments disequilibria.
These disequilibria were caused by policies of economic growth, import substitution and after 1973 the higher costs of imported fuels, particularly oil, together with recessionary induced contraction of export markets in the industrialised countries. Internal mismanagement of the developing economies could also have resulted in balance of payments difficulties, but there seems little evidence of mismanagement for the LDCs as a group, although there are isolated examples, (Avromovic 1982, Britti'an 1977, Hailwood 1980, Killick 1981). The policies of growth and import substitution precluded the substantial economic adjustment that would have been required in order to eliminate the balance of payments deficits.
The higher cost of oil is just a specific case of a secular deterioration in the .terms of trade experienced by non oil exporting developing countries, as researched in such papers as Prebisch (1950), Sproas (1980) and reviewed in Bird (1978). However, it is not intended to investigate the impact of any secular deterioration of NOPEC terms of non energy trade because any deterioration that may have taken place is overwhelmed by the deterioration in terms of trade caused by higher prices of energy imports.
The following figures show that there were substantial deficits for LDCs as a whole until 1973. Thereafter, however, substantial deficits were suffered by the non oil exporting developing countries (NOPEC), while the oil exporters experienced very large surpluses.
21 Table 1.2
Balance of Payments Disequilibria of LDCs
NOPEC OIL EXPORTERS
DEFICITS SURPLUSES 1970 8 . 6 0.3 1971 11.0 2.1 1972 8.9 1.7 1973 11.5 6 . 6 1974 36.9 67.8 1975 45.9 35.0 1976 32.9 40.0 1977 28.6 31.1 1978 37.5 3.3 1979 57.6 68.4 1980 82.1 112.2
Source: IMF Annual Report 1981 p l8 and 1974 p22 Figures in billions US $
Given that the developing countries would have found speedy internal adjustment to these deficits incompatible with their aspirations of growth, it was essential for these deficits to be financed.
The following figures show how the NOPEC deficits were financed from 1973-1980:
N o n o i l d e v e l o p i n g c ou nt rie s: c u r r e n t a c c o u n t f i n a nc in g, 1 9 7 3 -1 9 8 0 22 c n c n N ? c - C O c n L O O L O m ( X . C N X f C o P i I 'M C N O • • • • • < , ■ , * • • . . r - > C N c n o o c o t-H N T L O cs L O C O c x C N N i l O L O c n m r —1 T~H r o ----1 X T T—1 t H CN TH Si td tN CO in oo CD LO NT cn CO r o v o VO v H c n L O cm r-' o o O CM r - t-H t-H CN t —I CM *—I v o I v o CN r- Ml to Qi CM C N | O CO CO CM VO O CO O C N CM V O VO CM CO CO CX Pi .-HC O P i CO O' tH X? c n CO <r4 37 . 1 3 . 0 0 Nil LO CNojtHC O CN o t-h CN1 v o NT1 C O O t-H C N a n x t< T H r o 0 0 C o C o NH Xt< C O X h 0 0 . - 1 L O x £ t*H V O C N C O NHl O v o c n C N o C N H . —i T—1 C N t—l H t H J r - o r o CN r H O ' r— i LO x t* r H 1 r o C O c n c n vo o ro ■N1 P u (1) p vw td P o in P p Q) P O P id 3 rH id > p o tn 1 o td T3 > i Si P P td ■d 0 si a) -H p > H inQJ Ptd in Q)*H N P O -H P o QJ P p 0 *«H U 3 0 P P P p O in O 0 T. id u o s tn CO QJ & P P p tn fd o ■H <d cn P rH ■—i U u p *H 0 p ■H p id f t tn P in p O p CD Si p P r—1 p fp tn 0 0) tn 0 P ’H n3 > p P O P QJ QJ 0 p P u ■H p •d -H 0 P s i in ■H P tn 0 0 p 0 P i—1 <d P > U ft d1 o P p O Cn QJo o 0 •H Id P P 1—I B **H St P p rH P P P u CD P o id tn U P § 'd p P 0 0) id P Pi* n u u p P 0)p p XI •H H -H QJ £ o to td P p
ft
p o in 0 > u Q) in 0 u p o Q> in d p id P •H £ O u u o u p QJ £ CO r-O tH I I c n .— i v o CM r ~ - C O C-~ L O C N C O V o V O O s t H V O 0 0 i n LO * ■ • * . . ■ • • a a « . a a * . . 3 2 C N H O ' 0 1 xF o CM C N t-h t o c o o t-H V o r o r -T—1 C O t- H t-H Vo xjt 00CM 1 CM Xt< t H t o r - C N C N r o x ? LOC O 3 2 «—1 r-HI X NH xtn-H1Os Q> LO CM VO CN1 C N c n 0 0 LO r - C N c n V O v o TH C N v o r o r o v o r H V O 0 0 v o o LO 0 0 pH ■St c n v o r o o C o p i t H t-H u o t-h r~- o o o LOIX.o o VO OS LO TH 00 x f t - h c n 1 T—1 LO toTH VO Nil oi Cn o 1 T-H 1 - p 0 0 r—, P p 1 P 0 k. *■ *d 0 p •H 0 o 0 -H •H 0 P P p p -H id 0 i—1 i—i p p ■H d o U s p td p 0 P P o 0 a 0 o o 0 P P 0 td u 0 -H p ■—- p 0 p R td «. 0 0 R d 0 tn •H tn 0 tn u P 0 P P H i o •H 0 0 rH to -P •rH S ££ *H 0 id jg £ +5 •d O B w ■-H Ss 0 0 U 0 id tn U 05 Ss u P 0 p u P ■iH P td 0 d id o •d 0 •H P R 0 R S i—i Si p > P Ss Q P 0 0 ro u o O ?H 0 Sh B 0 Jh td '0 p H-S 1 0 0 u B 0 p d 0 0 0 0 0 0 o d 0v rd d > p O P t l U V d p d R d u u P ■to R R O JLj 0 p P H 0 o tn d rQ rS 0 u 0 o td B 05 d P R o 0 0 p P d 0 rR 0 U sii—1 p p 0 R rH H t?S 0 id 0 0 P o o Jm P d ■H p o R 5 d d o u td P X tn 0 d rR 0 •H O 0 p s: R SiA rR P 0 si 0 P Q o P Ro Eh o 0 p 0 td p P O D o 0h C N C Oft
t-h in co p c n to T - t I 1 .H P O P T5 O ft W QJ D in H p <0 o d - H P •—I P r H C - H i) S P H H •* in CD Q) O U P P P C n O *H CO PhThe decline in the relative importance of direct investments and the growing importance of external borrowing, and particularly the borrowing from financial institutions has already been discussed. It must be noted that some of this borrowing has been used to finance the accumulation of reserves that has taken place over this period as well as financing deficits.
Policies of Growth and Import Substitution
The influence of growth aspirations on these balance of payments deficits is difficult to prove. However, if the developing countries wished to increase their rate of growth, particularly through industrialisation, one would expect to see imports of capital goods increasing as a proportion of total imports. It may also be expected that exports of manufactured goods would form an increasing proportion of total exports as industrialisation proceeds. A policy of import
substitution would also cause such trends in trade.
The following figures show the growth of total imports from the developed market economies by the developing economies. The growth of imports of machinery and the percentages of the total imports that machinery represents are also given.
24
Table 1.4 Growth of developing country imports Value of Total Imports Quantum Index 1970=100 Value of Imports of Machinery Quantum Index 1970=100 Value of Machinery Imports as % of Total Imports 1968 33.75 88 13.63 8 8 40.39 1969 37.02 97 15.45 103 41.73 1970 41.91 100 17.26 1 00 41.18 1971 47.14 105 20.06 102 42.55 1972 53.46 109 23.66 108 44.26 1973 73.74 122 31. 36 123 42.52 1974 113.79 148 45.53 159 40.01 1975 138.31 160 63.96 184 46.24 1976 147.19 170 73.45 198 49.90 1977 172.93 189 83.68 206 48.38 1978 207.22 192 96.60 196 46.62 1979 235.23 196 103.98 195 44.20 1980 293.39 223 127.91 225 43.59 S o u r c e : V a l u e :
United Nations Statistical Figures in billions US $
Yearbook 1981 p45 & p49
The growth in the value of machinery imports has been continuous and the growth in the increase in the quantity of those imports was only interrupted in 1978 and 1979.
Similar classifications of figures given below show the behaviour of the exports of manufactured goods from the developing countries.
Table 1.5 Growth of developing country exports Total Exports less Fuel Manufactured Exports Quantum Index 1970=100 % of Total 1968 26.37 8.81 75 33.41 1969 30.13 10.80 90 35.84 1970 33.74 12.61 100 37.37 1971 34.57 13.37 102 38.68 1972 41.74 16.72 128 40.06 1973 60.72 26.20 149 43.15 1974 80.71 35.46 169 43.94 1975 76.84 34.44 164 44.82 1976 85.90 41.79 206 48.65 1977 113.05 53.53 213 47.35 1978 131.12 67.79 238 51.70 1979 165.42 88.41 266 53.45 1980 193.06 106.74 272 55.29
Source: United Nations Yearbook 1981 p44 & p48 Value : Figures in billions US $
The figures for fuel exports have been deducted from total exports in order to abstract from the post 1973 influence of oil prices on value of exports.
It can be seen that exports of manufactured goods have grown considerably over this period and have assumed a more important role in the export business of the developing countries, rising from 33.41% of total exports in 1970 to 55.29% in 1980.
A final set of figures, extracted from various issues of the World Bank Annual Report, show a continuous excess of gross investment over domestic saving as proportions of developing country GNP^
Table 1.6 Savings and investment as a percentage of developing country GNP
Save Invest Save Invest
% % % % 1968 15.8 18.6 1975 22.3 23.8 1969 17.3 19.9 1976 25.5 24.6 1970 17.9 19.9 1977 23.2 24.8 1971 17.9 2 0. 1 1978 25.8 26.9 1972 18.1 2 0 . 6 1979 26.4 26.3 1973 2 2 . 2 21.7 1980 25.6 24.9 1974 23.5 2 2 . 6
Source: IBRD Annual Report, various issues
These figures show that investment has increased continuously during the period under study and that for most years investment exceeded domestic savings. Thus these countries, as a group, have experienced what may be a savings constraint in the form suggested by Chenery & Bruno (1962), McKinnon (1964), Chenery & Strout (1966); however, see Joshi (1970). This factor alone would necessitate external flows of finance.
Clearly these three sets of figures indicate the commitment to growth, particularly industrial growth, of the developing countries as a group. The inferences from the United Nations figures given above are reinforced by the IBRD figures. Furthermore, a study by Dell & Lawrence (1980) found that increased import quantities accounted for 41% of the cases of deterioration on the LDC trade account between 1962-1973. Increased import prices, on the other hand, accounted for 8% of such cases. They conclude that these figures are consistent with 11... the development process as well as ... short run problems of demand management" (pl2) .
It is, therefore, reasonably clear that throughout this period the growth aspirations of the developing countries as a group were at least partially achieved particularly by export growth and import substitution
through industrialisation. Given the assumption of a positive marginal propensity to import and that many of the capital inputs to the industrialisation process have had to be imported, even partial achievement of the growth objective would, ceteris paribus, cause a deterioration in the balance of payments on current account.
Impact of Increased Oil Prices
The change in the relative price of oil since 1973 has made it necessary, with any analysis of the developing countries, to divide the whole group into oil exporters and non oil exporters. The oil exporters have for the majority of years since 1973 been net exporters of financial capital, whereas the non oil exporters have needed to import such capital.
The following figures, again from United Nations sources, give the index of unit value, 1970 = 100, for energy exports by developing countries to other developing countries. As all the OPEC countries are classified as developing, these indices reflect oil exporting countries' exports to non oil exporting developing countries (NOLDCs). The value of such exports is given in parenthesis for each year.
Table 1.7 Index of oil exports to NOLDCs
1968 97 (3.15) 1975 603 (26.26) 1969 98 (3.21) 1976 643 (32.13) 1970 100 (3.92) 1977 701 (36.41) 1971 . 126 (4.98) 1978 703 (33.42) 1972 135 (5.49) 1979 990 (50.72) 1973 185 (8.67) 1980 1640 (75.09) 1974 571 (26.41)
Source: United Nations Statistical Yearbook 1981 p45 Figures in parenthesis in billions US $
The increased price of oil after 1973 affected the developing countries' balance of payment not only through their energy imports but through all their imports because of the energy content. Nevertheless, the greatest price rises in non energy imports were to be seen in the manufactured imports which are energy intensive and most of. these are imported from the developed countries.
The Impact of Oil Induced Recession in OECD Countries
The oil price rises of 1973-74 and 1979 also affected the NOLDCs balance of payments in an indirect way by inducing a recession in the developed economies. This reduced the demand for NOLDCs exports by the developed countries.
The following United Nations figures show the value of total exports excluding fuel from the developing economies to the developed market economies.
-Table 1.8 LDC exports (less fuel) to developed market economies
1970 26.47 1975 54.86 1971 26.56 1976 70.26 1972 31.96 1977 81.45 1973 46.32 1978 93.46 1974 59.42 1979 115.04 1980 129.49 Source: United Nations Yearbook 1981 p44
Figures in billions US $ FOB
These figures reflect the drop in exports from NOLDCs which coincides with the 1975 recession in the developed world if we accept the crude assumption that all non fuel exports of developing countries come from NOPEC countries.
We can now summarise this section by saying that the need for increased financial flows to the non oil exporting developing countries during the 1970's was caused by their balance of payments disequilibria. These in turn were caused by:
a) Aspirations of growth and a policy of import substitution throughout the period.
b) The increased price of oil, particularly after 1973, exacer bated the disequilibria. Given that the costs of adjustment would be so great, even larger flows of financial resources were required.
c) The oil induced recession in the developed economies during 1974-75 and after 1979 also contributed to the deterioration of the NOLDC balance of payments. Given their growth
policies, these countries had to borrow the foreign exchange required to cover these deficits.
30
.4 Why did the Developing Countries turn to the Private Financial Markets? The private financial markets did not suddenly find a new set of customers in 1970. These markets had been providing some finance to the developing countries on an increasing, though small, scale during the
1950's and 1960's. Many of the banking techniques had their genesis in the 1960's. What was different in the '70's compared with earlier periods was the dominance of private sector debt creating flows over official flows and direct investment to the developing countries.
Given that the private markets and the techniques were in existence before 1970, it is reasonable to suggest that after 1970 these markets and techniques were a more desirable source of finance compared with the official sources because, of the .declining desirability and avail ability of the latter. We can therefore answer the question of why the developing countries turned so convincingly to the private markets by investigating the reasons for the declining desirability and relative availability of the official financial flows.
We will begin by analysing the role of the IMF and then look at the role of the World Bank and of Bilateral Aid.
The International Monetary Fund
The aim of this institution is to provide temporary finance to members in order to finance their balance of payments disequilibria.
Each member of the Fund contributes its 'quota' , of which before
J
1976 25% was in gold or US dollars and 75% in its own currency. Since 1975 the contributions can be completely in the member's own currency. The size of a member's quota has an influence over the amount of finance that can be obtained from the IMF because quantitative limitations on assistance are stated in terms of multiples of a member's quota.
Much debate about the availability of assistance from the Fund centres upon the conditionality attached to any such assistance, (Bird
31
1979/ 1982, Pirzio-Birote 1983, Buira 1983). However, it is not intended to discuss IMF conditionality in any detail in this thesis because, as will be shown below, the overwhelming constraint upon the maximum amount of assistance that the Fund could give to the LDCs has been the resources available to the Fund.
It is shown below that even if no conditions were attached to IMF assistance, save for the regulation regarding maximum quota multiples, and that NOLDCs drew their maximum entitlement, this entitlement would be an increasingly inadequate form of quantitative assistance as the 1970's progressed.
The Quantity of Funds Available from the IMF
The resources which the Fund can make available come from members' subscriptions and from borrowed resources. Members' subscriptions are determined in accordance with the same quotas allocated to each member which in turn influence a member's access to Fund resources and voting po w e r .
The Articles of Agreement of the Fund provide for a general review of quotas every five years. The fifth general review of quotas took place in 1969 and a 35.5% increase in all quotas was agreed for 1970. The total value of quotas for all members as at 30 April 1971 was SDR 28478 million which represented 8.2% of the total value of international trade. The total value of quotas increased to SDR 39000 million by April 1980 which represented 4% of international trade. The sixth general review of quotas in 1976 doubled the quota share of oil exporting countries from 4.98% to 9.88%, whilst keeping the collective share of developing countries to 20.92%. Bearing in mind that quotas influence the total amount of finance that can be obtained from the Fund, such action seems to be of little help to the NOLDCs, (IMF 1981 p80).
32
The Fund grants facilities under four accounts; The General Account, The Subsidy Accpunt, The Trust Fund and The SDR Account.
Under the General Account for the period 1970-1980 the Fund made resources available under the following facilities
- Ordinary drawings and standby arrangements The Extended Fund Facility
The Supplementary Financing Facility The Compensatory Financing Facility The Buffer Stock Financing Facility The Oil Facilities of 1974 and 1975
Ordinary drawings are available up to 125% of a member's quota. This amount is available in five 25% tranches, the first being known as the reserve tranche, the second as the first credit tranche and the last three being known as the upper credit tranches.
The reserve tranche is made available unconditionally. The first credit tranche is made available to any member regarded as making 'reasonable efforts' to solve its balance of payments problems, but in practice is virtually automatic (ODI 1980). The upper credit tranches are granted only after substantial justification; the higher the tranche, the more exacting are the criteria for justification. These funds have normally been granted under a one year (but recently three year) standby agreement in support of a stabilisation programme agreed with the Fund. Access to these funds is by instalments and can be withdrawn if the performance criteria are not met.
It is the agreement of the performance criteria and the compliance with the stabilisation programme agreed with the Fund that constitute the conditionality associated with the ordinary drawings from the Fund.
The Extended Fund Facility The aim of this facility, established in 1974, is for the IMF to provide a facility whereby the developing countries could obtain resources but with longer repayment periods than
applied to normal drawings from the Fund.
The repayment period was originally up to eight years but in 1979 was extended to ten years so this facility is very much one of medium term finance. Drawings may be made over a three year period and may reach a maximum of 140% of the member's quota with the proviso that ordinary drawings and Extended Fund drawings must not exceed 265% of a member's quota.
Again, there is a degree of conditionality attached to this facility that is comparable with facilities under the upper credit tranches. The member is expected to present an economic programme setting the policies and objectives for the duration of the facility. Drawings are by instalment so that the granting of instalments can depend upon satisfactory execution of stages of the agreed programme.
The Supplementary Financing Facility became operational in February 1979 and provides funds under standby or extended arrangements. These funds are made available from resources that the Fund obtains by borrowing from members specifically for supplementary financing. They are in addition to those provided under other facilities.
The Fund will grant the facility
if:-a) The member needs finance from the Fund that exceeds the four credit tranches, and its problems require a
relatively long period of adjustment. The repurchase period is 3i-7 years.
b) The member will follow policies that are compatible with the Fund's policies on the use of resources in the upper credit tranches or extended fund facility.
Until June 1980 a member could draw 300% of its quota under this facility. At that date access was reduced to 200% of quota.


![Table 1.23 Average spreads and maturities of euroloans to selected developing countries Average 1979 Spread Average 1979 Matu]](https://thumb-us.123doks.com/thumbv2/123dok_us/9943223.2487161/76.918.76.785.80.875/average-maturities-euroloans-selected-developing-countries-average-average.webp)
