Abstract—In this study, we used structural and evolutionary based features to represent the sequences of gram-positive and gram-negative subcellular localizations. To do this, we proposed a normalization method to construct a normalize Position Specific Scoring Matrix (PSSM) using the information from original PSSM. To investigate the effectiveness of the proposed method we compute feature vectors from normalize PSSM and by applying Support Vector Machine (SVM) and Naïve Bayes classifier, respectively, we compared achieved results with the previously reported results. We also computed features from original PSSM and normalized PSSM and compared their results. The archived results show enhancement in gram-positive and gram-negative subcellular localizations. Evaluating localization for each feature, our results indicate that employing SVM and concatenating features (amino acid composition feature, Dubchak feature (physicochemical-based features), normalized PSSM based auto-covariance feature and normalized PSSM based bigram feature) have higher accuracy while employing Naïve Bayes classifier with normalized PSSM based auto-covariance feature proves to have high sensitivity for both benchmarks. Our reported results in terms of overall locative accuracy is 84.8% and overall absolute accuracy is 85.16% for Manusript received May 20, 2015; revised August 28, 2015; accepted November 02, 2015. Date of publication December, 2015. Asterisk indicates corresponding author.
*Ronesh Sharma is with School of Electrical and Electronics Engineering, Fiji National University, Suva, Fiji and with School of Engineering and Physics, The University of the South Pacific, Suva, Fiji (e-mail: [email protected]).
Abdollah Dehzangi is with Medical Research Centre, Department of Psychiatry, University of Iowa, Iowa City, IA 52242, USA (e-mail: [email protected])
James Lyons is with School of Engineering, Griffith University, Brisbane, Australia (e-mail: [email protected]).
Kuldip Paliwal is with School of Engineering, Griffith University, Brisbane, Australia (e-mail: [email protected])
Tatsuhiko Tsunoda is with RIKEN Center for Integrative Medical Sciences, Yokohama 230-0045, Japan, and with CREST, JST, Yokohama 230-0045, Japan and with Medical Research Institute, Tokyo Medical and Dental University, Tokyo 113-8510, Japan (e-mail: [email protected]).
Alok Sharma is with School of Engineering and Physics, the University of the South Pacific, Suva, Fiji and with the Institute for Integrated and Intelligent Systems, Griffith University, Brisbane, Australia and with RIKEN, Yokohama 230-0045 (e-mail: [email protected]).
gram-positive dataset; and, for gram-negative dataset, overall locative accuracy is 85.4% and overall absolute accuracy is 86.3%.
Index Terms—Evolutionary-based features, Normalized PSSM.
I. INTRODUCTION
HE PREDICATION of protein subcellular localization is based on determining the location sites of unknown protein in a cell. A cell consists of many different compartments that are specialized to carry out different tasks [1]. One of the fundamental goals in cell biology is to identify the subcellular location site of proteins and their functions [1]. Information about subcellular location can provide useful characteristics of its functions. Of all proteins, bacteria proteins are the most important proteins to determine their functions because of its biological aspects which are both harmful and useful [2]. Bacteria can be divided in two groups, gram-positive and gram-negative [3]. Gram-positive bacteria are those that are stained dark blue or violet by gram staining while gram-negative bacteria cannot retain the stain, instead taking up the counter-stain and appearing red or pink [2]. As pointed in a recent review [4], in the last decade or so, a number of web-servers were developed for predicting the subcellular localization of proteins with both single site and multiple sites based on their sequences information alone. They can be roughly classified into two series [4]. One is the “PLoc” series and the other is “iLoc” series. The “PLoc” series contains the six web-servers [3], [5]–[9] to deal with eukaryotic, human, plant, Gram positive, Gram negative, and virus proteins, while the “iLoc” series contains the seven web-servers [10]–[16] to deal with eukaryotic, human, plant, animal, Gram positive, Gram negative, and virus proteins, respectively.
The newly synthesized proteins play a critical role, if only they are placed in their correct subcellular compartments [17]. The subcellular location of a protein can be determined by varies biological experiments, but it is costly and time
Predict Gram-positive and Gram-negative
subcellular localization via incorporating
evolutionary information and
physicochemical features into Chou’s general
PseAAC
Ronesh Sharma, Abdollah Dehzangi, James Lyons, Kuldip Paliwal, Tatsuhiko Tsunoda, Alok Sharma
consuming. Recently computational methods have become increasingly important and recognized. Researches prefer to use predication system to identify the subcellular localization of proteins [18]–[21]. Fast computational approaches address the problems of costly and time consuming experimental methods. A wide range of pattern recognition approaches has been used to solve subcellular localization problem. These approaches either involves classifier development or feature extraction development. Several classifiers have been developed and analysed which includes: Artificial Neural Network (ANN), K-Nearest Neighbor (KNN) [22], Bayesian Classifiers, Linear Discriminant Analysis (LDA) , Hidden Markov Model (HMM) , Naïve Bayes [23], SVM [24], [25] and ensemble of classifiers . Amongst these classifiers SVM and ensemble of classifiers give the most promising results [25]. Studies have shown that most significant enhancement in predication system is achieved by developing feature extraction method rather than improving the classifiers.
For the development of feature extraction techniques, Dubchak et al. [26] proposed features based on syntactical and physicochemical properties of protein. They used Amino Acid Composition (ACC) as a syntactical feature and considered five attributes of amino acid from physicochemical properties, which are hydrophobicity (H), predicted secondary structure based on normalized frequency of alpa helix (X), polarity (N), polarizability (Z) and van der Waals volume (V) and used three descriptors (composition, transition and distribution) to represent these attributes. Thus, it had 20 syntactical based features and 105 physicochemical based features (21 for each attribute). These features developed by Dubchak et al. [26] were widely used in other recent studies [24].
Other attributes have also been in practice apart from Dubchak et al. [26] which includes: flexibility [27] where only small number of residues in the binding pocket undergo change; accessibility [28] which includes solvent accessibility that helps in discrimination of the protein folding; first and second order entropy [29] where approximate entropy and hydrophobicity attributes of protein were used to characterize the pseudo amino acid (PseAAC) components since it composes additional information from the protein sequence; structural information of amino acid [30] in which secondary structure state and solvent accessibility state frequencies of amino acid and amino acid pairs are used as feature vectors; size of side chain where more features are extracted based on the size of amino acid side chains. PseAAC [31] takes sequence order into effect since prediction quality was low with just AAC features.
The introduction of correlation features and auto-covariance features [32], [34] computed from amino acid sequence and PSSM formed a strong feature extraction method. Ghanty and Pal [25] proposed bigram features which counts the bigram frequency of occurrence from the amino acid sequence which combines 400 features with combination of 20 amino acids. Later Sharma et al. [35] took approach of Ghanty and Pal [25] to use bigram feature representation with the PSSM matrix directly to further improve the accuracy since bigram feature constructed from primary protein
sequence has many features with zero values which resulted in poor performance. To avoid zero values in feature vectors, Sharma et al. [35] computed bigram features directly from PSSM matrix. Sometimes the dimensionality of these features are high, however, dimensionality problem can be resolved by dimensional reduction methods [36]–[45]. These features are widely used in solving protein fold recognition problem [1], [5], [31], [35], [46]–[49].
In the case of developing features for protein subcellular localization, most of the feature extracting techniques started from using simple AAC feature which resulted in loss of sequence order information. To retain sequence order information, Chou [31] presented PseAAC and since then it has been proven to be one of the popular methods for feature extraction. The AAC has 20 features since it is derived from the 20 common amino acids present in the protein sequence; it is simply represented as its normalize occurrence frequency. To avoid losing sequence order information, PseAAC uses features where the first 20 elements of the features are the AAC components with additional elements which are used to incorporate the sequence order information. These elements are series of different rank of correlation factors and combination of factors. The concept of PseAAC has been widely used in predicting protein related problems. Several works have used the PseAAC feature with combination of the other features to predict protein subcellular localization [33], [50].
Huang and Yuan analyzed series of classifiers for subcellular localization, but these were limited to single location site. For multi label prediction, Gpos-mplock and Gneg-mplock (predictor) are proposed [6], [8] to predict protein localization in gram positive and gram negative bacteria; and Plant-mploc (predictor) is developed [49] which uses top down strategy to predict single or multiple protein localization in plant protein. Virus-mploc (predictor) [9] was developed with fusion of classifiers and features of functional domain and gene ontology to predict virus proteins. To increase the quality of prediction, three revised version of the prediction systems were developed: iloc-Gpos (predictor) [14], iloc-plant (predictor) [12], iloc-virus (predictor) [16]. Huang and Yuan used AAC, evolution information and PseACC with Backward Propagation (BP) and Radial Basis Function (RBF) neural network to predict both single and multi-site subcellular proteins.
A number of machine learning methods have been developed with many different combination and types of features along with different classifiers. For example, PSORT (predictor) [51] uses sequence features based on sorting signal, SubLoc (predictor) [52] uses SVM with AAC to obtain higher accuracy. TargetP (predictor) [53] uses ANN and N-terminal sequence to predict subcellular locations. Pierleoni et al. [54] used N-terminal, AAC and alignment profile to predict the subcellular localization. Similarly, Tamura and Akutsu [55] used alignment of block sequence. Chang et al. [56] developed and used gapped-dipeptide and probabilistic latent semantic analysis method for prediction of gram negative bacteria protein. Lee et al. [57] predicted protein localization by
integrating an extensive set of protein physical characteristics over a proteins extended protein-protein interaction neighbourhood, using a classification framework called Divide and Conquer k-Nearest Neighbor (DC-KNN) to improve accuracy.
As demonstrated by a series of recent publications [58]– [62] and according to the Chou’s 5-step rule [63], to establish a really useful sequence-based statistical predictor for a biological system, we should consider the following five guidelines: (a) construct or select a valid benchmark dataset to train and test the predictor; (b) formulate the biological sequence samples with an effective mathematical expression that can truly reflect their intrinsic correlation with the target to be predicted; (c) introduce or develop a powerful algorithm (or engine) to operate the prediction; (d) properly perform cross-validation tests to objectively evaluate the anticipated accuracy of the predictor; (e) establish a user-friendly web-server for the predictor that is accessible to the public. Below, we are to describe how to deal with these steps one-by-one. In this study, we attempted to predict the subcellular location of both gram-positive and gram-negative bacterial proteins using structural and evolutionary based features. We focus on to explore the information embedded in PSSM. To do this, we propose a normalization method to construct a normalize PSSM using the information from original PSSM. To investigate the effectiveness of the proposed method, we compute feature vectors from normalized PSSM and measure the recognition accuracy by applying SVM and Naïve Bayes classifiers, respectively. To show the significance of the proposed method, we compare the achieved result with features computed from original PSSM. We observed that the proposed method retrieves more information useful to localize the subcellular sites. The achieved results shows highest accuracy of 88.9% for gram-positive dataset and 95.1% for gram-negative dataset using SVM classifier while using Naive Bayes classifier we get highest sensitivity of 81% for gram-positive dataset and 82.9% for gram-negative dataset. Our reported results in terms of overall locative accuracy is 84.8% and overall absolute accuracy is 85.16% for gram-positive dataset; and, for gram-negative dataset, overall locative accuracy is 85.4% and overall absolute accuracy is 86.3%.
II. BENCHMARK
We use two benchmark datasets previously employed in the literature [42], [64]: gram-positive and gram-negative bacteria. The details of the datasets are given as follows:
A. Gram-positive bacteria protein dataset
For gram-positive subcellular localization, we use the benchmark that was proposed in the literature [64]. This benchmark consists of 519 different proteins belonging to four gram-positive subcellular localizations. From the 519 proteins, 515 belong to single location while other four belongs to multiple locations (515 + 4*2 = 523). Thus, there are total of 523 samples. The name of each location is shown in Table I.
This benchmark is available at the web-link
http://www.csbio.sjtu.edu.cn/bioinf/Gpos-multi.
B. Gram-negative bacteria protein dataset
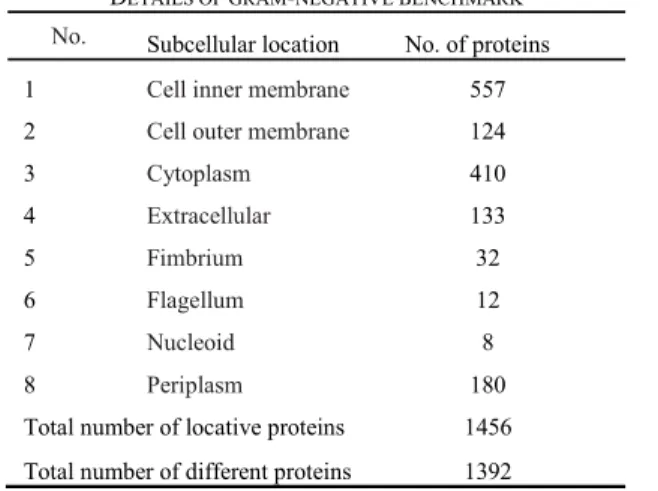
For gram-negative subcellular localization, we use the benchmark that was proposed in the literature [42]. This benchmark consists of 1392 different proteins belonging to eight gram-negative subcellular localizations. From the 1392 proteins, 1328 belong to single location while other 64 belongs to multiple locations (1328 + 64*2 = 1456). Thus, there are total of 1456 samples. The name of each location is shown in Table II. This benchmark is available at the web-link http://www.csbio.sjtu.edu.cn/bioinf/Gneg-multi/.
III. METHODOLOGY
A. Feature extraction method
In this study, we explore structural and evolutionary information embedded in the protein sequences and its PSSM. We use the PSSM produced in the literature [46] for our employed benchmarks. PSSM provides a substitution probability of a given amino acid based on its position along with the protein sequence. Here we describe feature extraction methods used in this paper. First, we extract features from consensus sequence (which incorporates evolutionary-based information) [46]. Second, we extract features from the normalized PSSM, which is newly constructed matrix using method of normalization in this study. This uses the information embedded in the original PSSM. Fig.1 shows the conceptual framework for predicting the protein subcellular localization. Dubchak + composition feature extracted from the consensus sequence and 3 other features namely
TABLEI
DETAILS OF GRAM-POSITIVE BENCHMARK
No. Subcellular location No. of proteins 1 Cell membrane 174
2 Cell wall 18
3 Cytoplasm 208
4 Extracellular 123
Total number of locative proteins 523 Total number of different proteins 519
TABLEII
DETAILS OF GRAM-NEGATIVE BENCHMARK
No. Subcellular location No. of proteins 1 Cell inner membrane 557 2 Cell outer membrane 124
3 Cytoplasm 410 4 Extracellular 133 5 Fimbrium 32 6 Flagellum 12 7 Nucleoid 8 8 Periplasm 180
Total number of locative proteins 1456 Total number of different proteins 1392
normalized PSSM composition, normalized PSSM auto-covariance and normalized PSSM bigram extracted by using normalization method. The next subsection will outline the feature extraction method and the proposed method of obtaining the normalized PSSM.
The following feature extraction techniques are considered for subcellular localization:
1. Amino Acid Composition + Dubchak feature [F1]. Dubchak features were previously used for protein fold recognition [26]. They include amino acid composition, predicted secondary structure, polarity, hydrophobicity and normalized van der Waals volume. The size of this feature vector is 125. 2. Composition feature based on normalized PSSM [F2]. This feature is extracted from normalized PSSM (the detail of computing normalized PSSM is given later in the text). To produce the vectors for this feature, we do summation of the substitution score of a given amino acid with all the amino acid along the protein sequence and it is calculated as follows:
∑ ( ) (1)
Where N is the normalized PSSM matrix of size Lx20 (where L is the length of the primary protein sequence). Its element at ith row and jth column is denoted by , which is interpreted as the relative substitution probability of jth amino acid at ith location of the bacteria protein sequence. The size of this feature vector is 20.
3. Auto-covariance feature based on normalized PSSM [F3]. To add more local discriminatory information to the subcellular localization, the concept of auto-covariance approach is recently used. It provides more information regarding the interaction of the amino acids along the protein sequence. This feature is defined as follows:
∑
( ) (2) where DF is the distance factor. The effective value of DF is
used as 10 for the employed benchmark since this value was investigated in other literature [65] which gives promising results for other benchmark datasets. The dimensionality of this feature vector will be 20×DF.
4. Bigram feature based on normalized PSSM [F4]. The bigram feature represents the probabilities of transition from one amino acid to the other as determined by normalized PSSM [35]. The frequency of occurrence of transition from k-th amino acid to i-k-th amino acid is computed as follows:
∑
(
) (3) It gives a 20×20 matrix and is interpreted as a feature vector of
size 400. To extract this feature, we sum the occurrence of transition from one amino acid to another and divide it with the length of the primary sequence. In previous literature [35], bigram feature was computed but here we normalized with L. 5. Fc = [F1 F3 F4]. We will construct our final feature vectors by concatenating three of four feature sets namely: AAC + Dubchak feature, auto-covariance feature based on normalized PSSM and bigram feature based on normalized PSSM.
All the features considered in this paper are none but different modes of general Chou’s PseAAC [66], [67]. According to Chou [63], the general PseAAC is formulated as:
[ * +] (4) where is an integer and its value as well as all its components will depend on how to extract the desired information from the amino acid sequence [46], [64], [68]– [72]. Actually, once the desired features are selected by users, the corresponding components in (4) can be automatically generated by using the web-servers “PseAAC-General” [66] or “Pse-in-One” [67] that were established very recently.
B. Proposed PSSM normalizing method
In this section, we provide details of computing normalized PSSM. We explore embedded information in PSSM by first defining the PSSM and then by outlining the method for constructing the normalize PSSM. The construction of the PSSM is defined as follows:
According to the studies [64], PSSM can be represented as: [ ] (5)
This is an L×20 matrix, where L is the length of the primary Fig. 1. Conceptual framework for predicting bacteria proteins
protein sequence, represents the score of amino acid residue at the ith location of the protein sequence which is changed into amino acid j during the process of evolution. In order to make the descriptors normalize, we computed and formulated a new matrix N using the information from original PSSM matrix P. We refer this matrix N as our new normalized PSSM in this study. The normalized matrix N is computed as follows: [ ] (6) where (7) and i=1,2,…L ; j=1,2,…20; ( ) ( ) . To investigate the effectiveness of our proposed method, in the first step we study the effective ways of determining and for the employed benchmark datasets. Then in the second step we use the effective values of and to investigate the performance of the proposed method.
C. Studing the effective ways of determining and to
from a normalized PSSM matrix
In this part, we study the effective method of constructing a normalized PSSM. Three methods of obtaining and were investigated:
The protein samples in the dataset are represented as follows: * +
where m is the total number of protein samples in the dataset
and P is the original PSSM of the protein. We calculate the
maximum and minimum scores of the original PSSM as follows:
( ) and ( ) where j=1, 2, …m (8) Using maximum and minimum scores of original PSSM, we find the normalizing coefficients using three methods: Method 1: and (9) Method 2: ( ) and ( ) (10) Method 3: ( ) { } and ( ) { } for j= 1, 2 …m. (11)
In each method, different normalization coefficients are calculated to normalize the original PSSM. These values of and are used in (6) and (7) to compute the normalized PSSM matrix N. The next section outlines the evaluation method.
IV. EXPERIMENTATION
To show effectiveness of our proposed method, we perform computational experiment on positive and gram-negative datasets. We use feature extraction techniques to compute the feature vectors and to evaluate the performance of the extracted features we employ SVM and Naïve Bayes classifier, respectively. SVM is widely used in classification task, it finds maximum margin hyper plane to minimize the classification error. It transforms input data using kernel trick to find appropriate support vectors. Naïve Bayes classifier assumes the independence of features which helps in computing a posteriori probability required in the Bayes rule [23]. Both classifiers have been popularly used and attained good results in many tasks [35], [48]. In this study, we adopt the independent dataset and k-fold cross-validation method as it has been used by many other researchers in similar field.
To measure the statistical significance of the proposed method for the employed benchmarks, we repeat k-fold cross-validation 50 times. Each time we randomly choose a subcellular protein class and randomly select a protein from that particular class. To provide information on the statistical prediction, we report sensitivity, specificity and accuracy for each subcellular location. The sensitivity, specificity and accuracy are given by the following equations:
(12)
(13)
(14) where TP is true positives; i.e., the number of correctly identified subcellular location sites. FP is false positives; i.e., the number of subcellular location sites being classified even though it is not annotated by that location site. TN is true negatives; i.e., the number of subcellular location sites for which the classifier does not correctly assign a location site. FN is false negatives; i.e., the number of subcellular location sites for which the classifier does not assign a location site even though it is annotated with that location site.
The sensitivity refers to the true positive rate of the classifier and it is used to evaluate a model to correctly identify the subcellular location sites; i.e., the fraction of subcellular location sites being correctly classified. The specificity refers to 1 – false positive rate, where the false positive rate shows the fraction of subcellular location sites being incorrectly classified. The accuracy refers to the total correctly classified instances over the number of samples
present in the dataset. Metrics (12) – (14) are valid only for the single-label systems (such as the protein system in which each protein has one, and only one, subcellular location site). For the multi-label systems whose existence has become more frequent in system biology [10], [11] and system medicine [73], a completely different set of metrics as defined in [74] is needed.
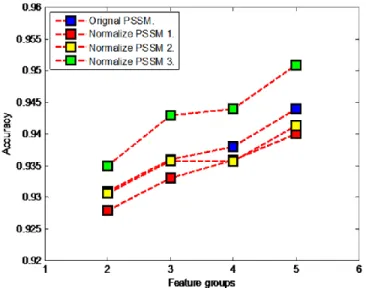
We compare the accuracies of 3 methods of obtaining normalized PSSM with the accuracies achieved by using original PSSM. Figs. 2 and 3 show the accuracies achieved for gram-positive and gram-negative benchmarks for each of the methods (9), (10) and (11) mentioned above. For both benchmarks, using method 1, there is a vast decrease in accuracies for normalized PSSM composition feature and normalized PSSM auto-covariance feature while for normalized PSSM bigram feature and Fc feature the accuracies are quite close. Using method 2, for normalized PSSM composition feature and normalized PSSM auto-covariance feature the accuracies are little higher, but for normalized PSSM bigram feature and Fc feature the accuracies fall. Finally, using method 3, there is significant increase in accuracies for all the feature groups when compared with the accuracies achieved using the original PSSM matrix for feature extraction. The highest accuracy is achieved by concatenating 3 of the feature vectors namely: AAC+Dubchak feature, normalized PSSM auto-covariance feature and normalized PSSM bigram feature. Thus, we use method 3 as the normalizing method to formulate our normalized PSSM. We investigate all the feature extraction techniques on the two benchmarks and report the achieved results in Table III to Table VIII.
To show the impact of our proposed method, first we apply SVM and then we apply Naïve Bayes classifier, respectively, on the extracted features and tabulate the achieved results for each benchmark. We show sensitivity, specificity and accuracy for each subcellular location site as well as for each extracted feature group. Table III to Table VIII shows the above mentioned parameters (12), (13) and (14) for gram-positive and gram-negative benchmarks for the employed classifiers, respectively. Note that the average relates to the average sensitivity and specificity, and the average accuracy relates to the prediction accuracy which is the total number of correctly classified samples over the total number of samples in the dataset, known as the binary-class accuracy. Average sensitivity/specificity and average accuracy is computed as follows:
Average = ∑ ∑
(15) Average accuracy = ∑ (16)
where n is the number of class in the dataset.
As shown in Table III to Table VIII for the achieved results, features extracted from normalized PSSM matrix prevails best performance when compared with the features that were extracted from the original PSSM matrix. For both benchmarks (gram-positive and gram-negative) as well as for both classifiers (SVM and Naïve Bayes) employed, the features extracted from normalized PSSM matrix shows promising results.
For gram-positive benchmark, it can be observed from Tables III, IV and Table VII that features not perform satisfactorily when it is computed from the original PSSM matrix, however its performance improves as it is computed from normalized PSSM matrix. Using SVM as the classifier, Fig. 2. Effective method of normalizing PSSM for gram-positive benchmark
using SVM classifier. Feature group 2 refers to normalized PSSM composition (F2), 3 refers to normalized PSSM auto-covariance (F3), 4 refers to normalized PSSM bigram (F4) and 5 refers to feature group constructed by concatenating F1(Dubchak features), F3 and F4.
Fig. 3. Effective method of normalizing PSSM for gram-negative benchmark using SVM classifier. Feature group 2 refers to normalized PSSM composition (F2), 3 refers to normalized PSSM auto-covariance (F3), 4 refers to normalized PSSM bigram (F4) and 5 refers to feature group constructed by concatenating F1(Dubchak features), F3 and F4.
Fc feature gives average sensitivity and accuracy as 63.6% and 89.8%, respectively. Thus, it is 5.3% and 1.5% greater when compared with Fc feature computed from the original PSSM matrix. Using Naïve Bayes as the classifier, the normalized PSSM auto-covariance feature gives average sensitivity and accuracy as 81% and 77.2%, respectively. Thus, it is 5.9% and 1.4% greater when compared with PSSM auto covariance feature computed from the original PSSM matrix.
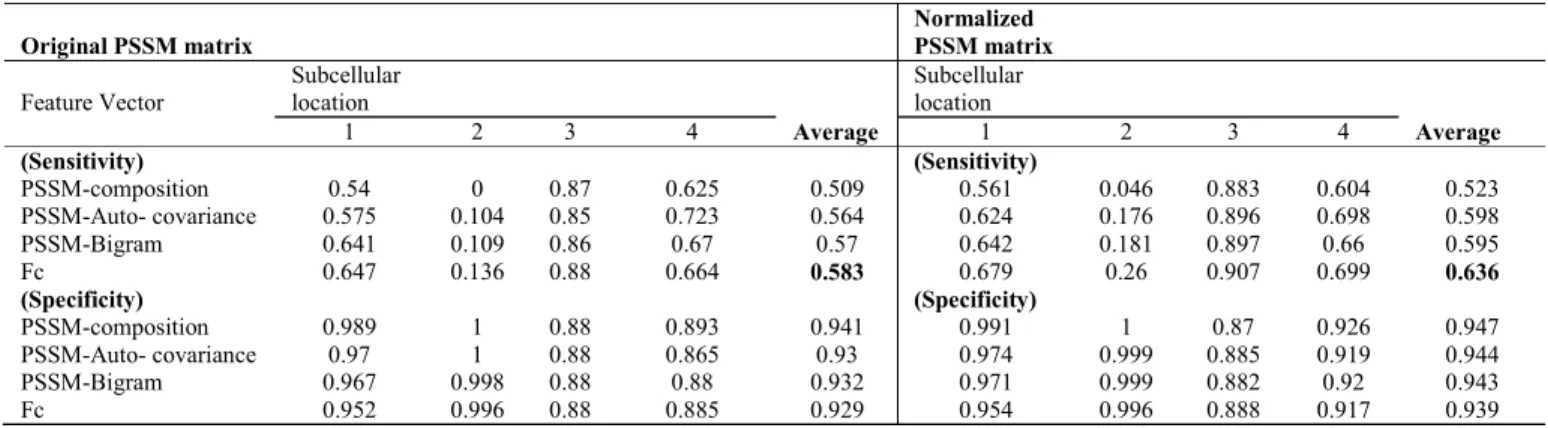
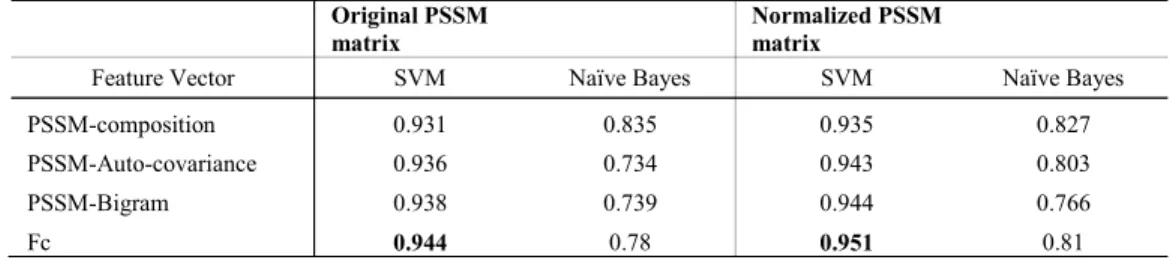
For gram-negative benchmark it can be observed from Tables V, VI and Table VIII that for all features computed from normalized PSSM give better localization accuracy when compared with features computed from the original PSSM matrix. Using SVM as the classifier, Fc features gives average sensitivity and accuracy as 54% and 95.1%, respectively. Thus, it is 8.3% and 0.7% greater when compared with Fc feature computed from the original PSSM matrix. Using Naïve Bayes as the classifier, the normalized PSSM auto-covariance feature gives average sensitivity and accuracy as 82.9% and 80.3%, respectively. Thus, it is 6.2% and 6.9% greater when compared with PSSM auto-covariance feature computed from
the original PSSM matrix.
To compare the proposed method with similar studies and state of art predictors for both benchmarks, we also adopted jackknife test, also named leave-one-out cross validation method [19]. The jackknife test has been widely utilized by researchers to evaluate the performance of various prediction methods and is also used in previous studies to evaluate the performance of the current two benchmarks [14], [15], [19], [42]–[47], [64] used in this study. Therefore, we use both K-Fold and jackknife cross validation methods to compare the proposed method with the previous studies and state of art methods. Moreover, since the two benchmark datasets used in this study are multi label problems, therefore in this paper first we report single-label classification measure and then we report multi-label classification measure. For single-label classification measure, we use (12) for all the subcellular location sites to report overall accuracy and use (16) to report average accuracy. A comparison of reported accuracy values for gram positive and gram negative datasets that have been recently published are shown in Table IX.
TABLEIII
THE SENSITIVITY AND SPECIFICITY FOR EXTRACTED FEATURES FOR GRAM-POSITIVE BACTERIA BENCHMARK USING SVM CLASSIFIER
Original PSSM matrix
Normalized
PSSM matrix
Feature Vector Subcellular location Subcellular location
1 2 3 4 Average 1 2 3 4 Average (Sensitivity) (Sensitivity) PSSM-composition 0.54 0 0.87 0.625 0.509 0.561 0.046 0.883 0.604 0.523 PSSM-Auto- covariance 0.575 0.104 0.85 0.723 0.564 0.624 0.176 0.896 0.698 0.598 PSSM-Bigram 0.641 0.109 0.86 0.67 0.57 0.642 0.181 0.897 0.66 0.595 Fc 0.647 0.136 0.88 0.664 0.583 0.679 0.26 0.907 0.699 0.636 (Specificity) (Specificity) PSSM-composition 0.989 1 0.88 0.893 0.941 0.991 1 0.87 0.926 0.947 PSSM-Auto- covariance 0.97 1 0.88 0.865 0.93 0.974 0.999 0.885 0.919 0.944 PSSM-Bigram 0.967 0.998 0.88 0.88 0.932 0.971 0.999 0.882 0.92 0.943 Fc 0.952 0.996 0.88 0.885 0.929 0.954 0.996 0.888 0.917 0.939 TABLEIV
THE SENSITIVITY AND SPECIFICITY FOR EXTRACTED FEATURES FOR GRAM-POSITIVE BACTERIA BENCHMARK USING NAÏVE BAYES CLASSIFIER
Original PSSM matrix
Normalized PSSM
matrix
Feature Vector Subcellular location Subcellular location
1 2 3 4 Average 1 2 3 4 Average (Sensitivity) (Sensitivity) PSSM-composition 0.577 0.778 0.825 0.771 0.738 0.743 0.822 0.821 0.767 0.788 PSSM-Auto-covariance 0.547 0.83 0.802 0.823 0.751 0.758 0.836 0.838 0.808 0.81 PSSM-Bigram 0.68 0.829 0.804 0.78 0.773 0.792 0.841 0.827 0.775 0.81 Fc 0.646 0.766 0.803 0.779 0.748 0.781 0.791 0.831 0.78 0.796 (Specificity) (Specificity) PSSM-composition 0.916 0.772 0.797 0.785 0.818 0.736 0.796 0.79 0.792 0.778 PSSM-Auto-covariance 0.965 0.666 0.769 0.729 0.782 0.721 0.776 0.783 0.76 0.76 PSSM-Bigram 0.705 0.661 0.785 0.727 0.72 0.634 0.74 0.748 0.759 0.72 Fc 0.813 0.745 0.784 0.734 0.769 0.665 0.792 0.773 0.781 0.753
TABLEV
THE SENSITIVITY AND SPECIFICITY FOR EXTRACTED FEATURES FOR GRAM-NEGATIVE BACTERIA BENCHMARK USING SVM CLASSIFIER
Original PSSM matrix Feature Vector Subcellular location 1 2 3 4 5 6 7 8 Average (Sensitivity) PSSM-composition 0.732 0.063 0.828 0 0 0 0 0 0.203 PSSM-Auto-covariance 0.774 0.421 0.759 0.033 0.279 0.007 0 0.177 0.306 PSSM-Bigram 0.791 0.446 0.796 0.111 0.326 0.032 0 0.223 0.341 Fc 0.831 0.514 0.837 0.406 0.553 0.032 0 0.487 0.457 (Specificity) PSSM-composition 0.993 0.998 0.912 1 1 1 1 1 0.988 PSSM-Auto-covariance 0.981 0.997 0.923 0.997 0.997 0.997 1 0.99 0.985 PSSM-Bigram 0.978 0.994 0.915 0.994 0.996 0.996 1 0.988 0.983 Fc 0.971 0.991 0.907 0.971 0.995 0.993 0.999 0.97 0.975 Normalized PSSM matrix Feature Vector Subcellular location 1 2 3 4 5 6 7 8 Average (Sensitivity) PSSM-composition 0.768 0.138 0.796 0.103 0.053 0.123 0.018 0.107 0.263 PSSM-Auto-covariance 0.809 0.427 0.851 0.212 0.182 0.417 0.04 0.218 0.394 PSSM-Bigram 0.808 0.445 0.864 0.241 0.191 0.45 0.055 0.259 0.414 Fc 0.846 0.517 0.883 0.444 0.573 0.495 0.083 0.481 0.54 (Specificity) PSSM-composition 0.987 0.998 0.921 0.996 1 1 1 0.998 0.988 PSSM-Auto-covariance 0.978 0.992 0.918 0.989 0.999 0.999 1 0.993 0.983 PSSM-Bigram 0.978 0.992 0.917 0.987 0.999 0.999 1 0.993 0.983 Fc 0.976 0.988 0.924 0.977 0.995 0.997 1 0.981 0.98 TABLEVI
THE SENSITIVITY AND SPECIFICITY FOR EXTRACTED FEATURES FOR GRAM-NEGATIVE BACTERIA BENCHMARK USING NAÏVE BAYES CLASSIFIER
Original PSSM matrix Feature Vector Subcellular location 1 2 3 4 5 6 7 8 Average (Sensitivity) PSSM-composition 0.712 0.68 0.784 0.778 0.799 0.867 0.023 0.707 0.669 PSSM-Auto-covariance 0.665 0.813 0.771 0.793 0.803 0.908 0.508 0.873 0.767 PSSM-Bigram 0.75 0.77 0.718 0.811 0.856 0.845 0.373 0.849 0.746 Fc 0.726 0.777 0.742 0.818 0.859 0.887 0.225 0.853 0.736 (Specificity) PSSM-composition 0.992 0.748 0.752 0.774 0.839 0.989 0.976 0.72 0.849 PSSM-Auto-covariance 0.989 0.606 0.735 0.671 0.745 0.992 0.69 0.484 0.739 PSSM-Bigram 0.963 0.606 0.767 0.659 0.756 0.979 0.7 0.512 0.743 Fc 0.985 0.638 0.769 0.682 0.823 0.992 0.875 0.518 0.785 Normalized PSSM matrix Feature Vector Subcellular location 1 2 3 4 5 6 7 8 Average (Sensitivity) PSSM-composition 0.821 0.802 0.845 0.846 0.857 0.88 0.54 0.659 0.781 PSSM-Auto-covariance 0.831 0.846 0.865 0.879 0.89 0.905 0.68 0.735 0.829 PSSM-Bigram 0.839 0.846 0.847 0.865 0.879 0.875 0.753 0.69 0.824 Fc 0.845 0.858 0.853 0.869 0.894 0.91 0.603 0.722 0.819 (Specificity) PSSM-composition 0.856 0.745 0.762 0.783 0.842 0.98 0.874 0.768 0.826 PSSM-Auto-covariance 0.859 0.72 0.755 0.763 0.815 0.971 0.784 0.71 0.797 PSSM-Bigram 0.736 0.691 0.715 0.739 0.778 0.935 0.73 0.701 0.753 Fc 0.79 0.714 0.746 0.759 0.852 0.991 0.84 0.716 0.801
For multi-label classification measure, we report overall locative accuracy and overall absolute accuracy. The overall locative accuracy and overall absolute accuracy are defined as follows: ∑ (17) ∑ (18) where is the number of locative proteins, is the number of different proteins, if at least one subcellular locations of the i-th protein are correctly predicted, and 0 otherwise, if all the subcellular locations of the i-th protein are simultaneously predicted, and 0 otherwise. When all the subcellular locations of query protein are exactly predicted, then only the predicted results of query protein can
be considered correct. Therefore the overall absolute accuracy is stricter than overall locative accuracy. A detailed explanation for single-label and multi-label performance measure is described in [19], [74]. Using (17) and (18), we report overall locative accuracy as 84.8 % and 85.4 %; and, overall absolute accuracy as 85.16 % and 86.3 % for gram-positive and gram-negative benchmarks, respectively.
Since the proposed technique is a learning method that only utilizes physicochemical and evolutionary information, we can only compare this strategy with similar studies. There are some techniques that have been proposed recently in literature, however, these techniques incorporate functional domains and gene ontology information [3], [8], [14], [15], [19]. It is in general time consuming for newly extracted proteins to annotate and record in such a large database, therefore, it may not be possible to use such techniques for predicting the subcellular localization of these proteins. Nonetheless, TABLEVII
THE AVERAGE ACCURACY FOR EXTRACTED FEATURES FROM GRAM-POSITIVE BACTERIA BENCHMARK USING SVM CLASSIFIER AND NAÏVE
BAYES CLASSIFIER
Original PSSM
matrix Normalized PSSM matrix
Feature Vector SVM Naïve Bayes SVM Naïve Bayes
PSSM-composition 0.878 0.791 0.885 0.781
PSSM-Auto-covariance 0.878 0.758 0.896 0.772
PSSM-Bigram 0.883 0.724 0.895 0.743
Fc 0.883 0.76 0.898 0.768
TABLEVIII
THE AVERAGE ACCURACY FOR EXTRACTED FEATURES FROM GRAM-NEGATIVE BACTERIA BENCHMARK USING SVM CLASSIFIER AND NAÏVE
BAYES CLASSIFIER
Original PSSM
matrix Normalized PSSM matrix
Feature Vector SVM Naïve Bayes SVM Naïve Bayes
PSSM-composition 0.931 0.835 0.935 0.827
PSSM-Auto-covariance 0.936 0.734 0.943 0.803
PSSM-Bigram 0.938 0.739 0.944 0.766
Fc 0.944 0.78 0.951 0.81
TABLEIX
COMPARING RESULTS FOR GRAM-POSITIVE AND GRAM-NEGATIVE BENCHMARK
Reported accuracy by
jackknife and K-Fold test Gram-positive benchmark Gram-negative benchmark Overall accuracy Average accuracy Overall accuracy Average accuracy K-Fold test Jackknife test K-Fold test K-Fold test Jackknife test K-Fold test
Huang and Yuan [64] 83.7 - - - - -
Pacharawongsakda [42] - - - 73.2 - -
Dehzangi [47] 83.6 - - 76.6 - -
Dehzangi [46] 87.7 88.2 - 79.6 80 -
incorporating functional information and gene ontology information will significantly improve the performance (example, predictors iLoc-Gpos [14] achieves 93% locative accuracy, Gpos-ECC-mPloc [19] achieves 94.4% locative accuracy and 94.02% absolute accuracy for gram-positive benchmark and for gram-negative benchmark, predictors iLoc-Gneg [15] achieves 93% locative accuracy, iLoc-Gneg-ECC-mPloc [19] achieves 94.4% locative accuracy and 94.02% absolute accuracy ). The proposed technique builds predicting model on the primary protein structure only, therefore, does not rely on functional information.
As demonstrated in a series of recent publications [58], [60], [62], [75]–[78] in developing new prediction methods, user-friendly and publicly accessible web-servers will significantly enhance their impacts [4], we shall make efforts in our future work to provide a web-server for the prediction method presented in this paper
V. CONCLUSION
In this study, we have computed features from normalized PSSM matrix. The proposed technique uses the information embedded in original PSSM to construct a new normalized PSSM. The effectiveness of the proposed method was tested against features extracted from original PSSM and achieved results were compared with previous reported results, a very promising result has been obtained. For both the benchmarks, the proposed method has shown enhancement in the subcellular localization accuracy.
We reported highest accuracy of 89.8% for gram-positive dataset and 95.1% for gram-negative dataset using SVM classifier while using Naïve Bayes classifier we reported highest sensitivity of 81% for gram-positive dataset and 82.9% for gram-negative dataset.
Our reported results in terms of overall accuracies are 0.7% and 5.4% better than previously reported results for gram-positive and gram-negative datasets, respectively. These enhancements highlight the effectiveness of the proposed method to explore the potential information embedded in the PSSM matrix.
REFERENCES
[1] K. Chou and H. Shen, "Recent progress in protein subcellular location prediction," Elsevier Analytical Biochemistry, vol. 370, no. 1, pp. 1-16, 2007.
[2] Z. Cheng, X. Xiao, and K. Chou, "iLoc-Gpos: A Multi-Layer Classifier for Predicting the Subcellular Localization of Singleplex and Multiplex Gram-Positive Bacterial Proteins," Protein and peptide letters, vol. 19, no. 1, pp. 4-14, 2012.
[3] H. Shen and K. Chou, "Gpos-mPLoc: A Top-Down Approach to Improve the Quality of Predicting Subcellular Localization of Gram-Positive Bacterial Proteins," Protein and peptide letters, vol. 16, no. 12, pp. 1478-1484, 2009.
[4] K. C. Chou, "Impacts of bioinformatics to medicinal chemistry," Medicinal Chemistry, vol. 11, no. 3, pp. 218-234, 2015.
[5] K. Chou and H. Shen, "A New Method for Predicting the Subcellular Localization of Eukaryotic Proteins with Both Single and Multiple Sites: Euk-mPLoc 2.0," Plosone, vol.5, no. e9931, 2010.
[6] H. Shen and K. Chou, "A top-down approach to enhance the power of predicting human protein subcellular localization: Hum-mPLoc 2.0," Analytical Biochemistry, vol. 394, no. 2, pp. 269-274, 2009.
[7] H. B. Shen, "Plant-mPLoc: A Top-Down Strategy to Augment the Power for Predicting Plant Protein Subcellular Localization," PLoS ONE, vol. 5, no. e11335, 2010.
[8] H. B. Shen and K. C. Chou, "Gneg-mPLoc: A top-down strategy to enhance the quality of predicting subcellular localization of Gram-negative bacterial proteins," Theoretical Biology, vol. 264, no. 2, pp. 326-333, 2010.
[9] H. B. Shen and K. C. Chou, "Virus-mPLoc: a fusion classifier for viral protein subcellular location prediction by incorporating multiple sites," Amino Acids, vol. 42, no. 1, pp. 271-273, 2010.
[10] Z. C. Wu and X. Xiao, "A Multi-Label Classifier for Predicting the Subcellular Localization of Singleplex and Multiplex Eukaryotic Proteins," PLoS One, vol. 6, no. e18258, 2011.
[11] Z. C. Wu and X. Xiao, "iLoc-Hum: Using accumulation-label scale to predict subcellular locations of human proteins with both single and multiple sites," Molecular Biosystems, vol. 8, no. 629-641, 2012. [12] Z. Wu, X. Xiao, and K. Chou, "iLoc-Plant: a multi-label classifier for
predicting the subcellular localization of plant proteins with both single and multiple sites," Moleculer Biosystem, vol. 7, no. 12, pp. 3287-3297, 2011.
[13] W. Z. Lin and J. A. Fang, "iLoc-Animal: A multi-label learning classifier for predicting subcellular localization of animal proteins " Molecular BioSystems, vol. 9, no. 4, pp. 634-644, 2013.
[14] Z. Wu, X. Xiao, and K. Chou, "iLoc-Gpos: a multi-layer classifier for predicting the subcellular localization of singleplex and multiplex Gram-positive bacterial proteins," Protein & Peptide Letters, vol. 19, no. 1, pp. 4-14, 2012.
[15] X. Xiao and Z. C. Wu, "iLoc-Gneg: A multi-label classifier for predicting the subcellular localization of gram-negative bacterial proteins with both single and multiple sites," PLoS ONE, vol. 6, no. e20592, 2011.
[16] X. Xiao, Z. Wu, and K. Chou, "iLoc-Virus: a multi-label learning classifier for identifying the subcellular localization of virus proteins with both single and multiple sites," Theoretical Biology, vol. 284, no. 1, pp. 42-51, 2011.
[17] T. Zhang, Y. Ding, and K. Chou, " Prediction of protein subcellular location using hydrophobic patterns of amino acid sequence," Computational Biology and Chemistry, vol. 30, no. 5, pp. 367-371, 2006.
[18] S. Wana, M-W. Maka, and S-Y. Kungb, "mHum: A LASSO-based interpretable human-protein subcellular localization predictor," Journal of theoretical biology, vol. 382, pp. 223-234,2015.
[19] X. Wang, J. Zhang, and G. Z. Li, "Gpos-ECC-mPLoc and Gneg-ECC-mPLoc : Multi-location gram-positive and gram-negative bacterial protein subcellular localization using gene ontology and multi-label classifier ensemble," BMC Bioinformatics, vol. 16, Suppl 12:S1, 2015. [20] S. Wan and M. W. Mak. (2015). Machine Learning for Protein
Subcellular Localization Prediction. Walter de Gruyter Gmbh & Co KG [21] S. Wan, M. W. Mak, and S. Kung, "mGOASVM: Multi-label protein subcellularlocalization based on gene ontology and support vector machines," BMC Bioinformatics, vol. 13, no. 290, 2012.
[22] Y. Ding and T. Zhang, "Using Chou's pseudo amino acid composition to predict subcellular localization of apoptosis proteins: An approach with immune genetic algorithm-based ensemble classifier," Pattern Recognition Letters, vol. 29, no. 13, pp. 1887-1892, 2008.
[23] F. Demichelis, P. Magni, P. Piergiorgi, M. Rubin, and R. Bellazzi, "A hierarchical Naïve Bayes Model for handling sample heterogeneity in classification problems: an application to tissue microarrays," BMC Bioinformatics, vol. 7, no. 514, 2006.
[24] C. Ding and I. Dubchak, "Multi-class protein fold recognition using support vector machine and neural networks," Bioinformatics, vol. 17, no. 4, pp. 349-354, 2001.
[25] P. Ghanty and N. Pal, "Prediction of Protein Folds: Extraction of New Features, Dimensionality Reduction, and Fusion of Heterogeneous Classifiers," IEEE Transactions on Nanobioscience, vol. 1, no. 1, pp. 101-110, 2009.
[26] l. Dubchak, l. Muchnik, and S. H. Kim, "Protein folding class predictor for SCOP: approach based on global descriptors," in ISMB-97 Proceedings Int Conf Intell Syst Mil Biol, 1997, pp. 104-107.
[27] R. Najmanovich, J. Kuttner, V. Sobolev, and M. Edelman, "Side-chain flexibility in proteins upon ligand binding," Proteins, vol. 39, no. 3, pp. 261-268, 2000.
[28] H. Zhang, T. Zhang, J. Gao, J. Ruan, S. Shen, and L. Kurgan, "Determination of protein folding kinetic types using sequence and predicted secondary structure and solvent accessibility," Amino Acids, vol. 42, no. 2, pp. 271-274, 2010.
[29] T. Zhanga, D. Yong, and K. Chou, "Prediction protein structural classes with pseudo-amino acid composition: Approximate entropy and hydrophobicity pattern," Theoretical Biology, vol. 250, no. 1, pp. 186-193, 2008.
[30] M. Shamim, M. Anwaruddin, and A. Nagarajaram, "Support Vector Machine-based classification of protein folds using the structural properties of amino acid residues and amino acid residue pairs," Structural Bioinformatics, vol. 23, no. 24, pp. 3320-3327, 2007. [31] K. C. Chou, "Prediction of protein cellular attributes using
pseudo-amino acid composition," Proteins, vol. 43, no. 3, pp. 246-255, 2001. [32] L. Zou, C. Nan, and F. Hu, "Accurate prediction of bacterial type IV
secreted effectors using amino acid composition and PSSM profiles," Bioinformatics 2013.
[33] L. Nanni, A. Lumini, and S. Brahnam, "An empirical study on the matrix-based protein representations and their combination with sequence-based approaches," Amino Acid letter, vol. 44, no. 3, pp. 887-901, 2013.
[34] T. Liu, X. Geng, X. Zheng, R. Li, and J. Wang, "Accurate prediction of protein structural class using auto covariance transformation of PSI-BLAST profiles," Amino Acids, vol. 42, no. 6, pp. 2243-2249, 2012. [35] A. Sharma, J. Lyons, A. Dehzangi, and K. K. Paliwai, "A feature
extraction technique using bi-gram probabilities of position specific scoring matrix for protein fold recognition," Theoretical Biology, vol. 320, no. 7, pp. 41-46, 2013.
[36] A. Sharma and K. K. Paliwal, "Fast principal component analysis using fixed-point algorithm," Pattern Recognition Letters, vol. 28, no. 10, pp. 1151-1155, 2007.
[37] A. Sharma and K. K. Paliwal, "A gradient linear discriminant analysis for small sample sized problem," Neural Processing Letters, vol. 27, no. 1, pp. 17-24, 2008.
[38] A. Sharma and K. K. Paliwal, "Cancer classification by gradient LDA technique using microarray gene expression data," Data & Knowledge Engineering, vol. 66, no. 2, pp. 338-347, 2008.
[39] A. Sharma and K. K. Paliwal, "Rotational linear discriminant analysis technique for dimensionality reduction," IEEE Transactions on Knowledge and Data Engineering, vol. 20, no. 10, pp. 1336-1347, 2008. [40] A. Sharma and K. K. Paliwal, "A new perspective to null linear discriminant analysis method and its fast implementation using random matrix multiplication with scatter matrices," Pattern Recognition vol. 45, no. 6, pp. 2205-2213, 2012.
[41] A. Sharma and K. K. Paliwal, "A Deterministic Approach to Regularized Linear Discriminant Analysis," Neurocomputing, vol. 151, no. 1, pp. 207-214, 2015.
[42] E. Pacharawongsakda and T. Theeramunkong, "Predict Subcellular Locations of Singleplex and Multiplex Proteins by Semi-Supervised Learning and Dimension-Reducing General Modeof Chou’s PseAAC," IEEE Transactions on Nanobioscience, vol. 12, no. 4, 2013.
[43] A. Sharma, K. K. Paliwal, S. Imoto and S. Miyano, "Principal component analysis using QR decomposition," International Journal of Machine Learning and Cybernetics, vol. 4, no. 6, pp. 679-683, 2013. [44] A. Sharma, S. Imoto, S. Miyano and V. Sharma, "Null space based
feature selection method for gene expression data," International Journal of Machine Learning and Cybernetics, vol. 3, no. 4, pp. 296-276, 2012.
[45] A. Sharma, and K. K. Paliwal, " Rotational linear discriminant analysis using Bayes rule for dimensionality reduction," Journal of Computer Science, vol. 2, no. 9, pp. 754-757, 2006.
[46] A. Dehzangi, R. Hefterman, A. Sharma, J. Lyons, K. K. Paliwal, and A. Sattar, "Gram-positive and Gram-negative protein subcellular localization by incorporating evolutionary-based descriptors into Chou's general PseAAC," Theoretical Biology, vol. 364, pp. 284-294, 2015. [47] A. Dehzangi, S. Sohrabi, R. Heffernan, A. Sharma, J. Lyons, K. K.
Paliwal, and A. Sattar, "Gram-positive and Gram-negative Subcellular Localization Using Rotation Forest and Physicochemical-based Features," BMC Bioinformatics, vol. 16, no. 4, 2014.
[48] A. Sharma, A. Dehzangi, J. Lyons, S. Imoto, K. Nakai, and A. Patil, "Evaluation of Sequence Features from Intrinsically Disordered Regions for the Estimation of Protein Function," Plos One, vol. 9, no. 2, 2014. [49] K. Chou and H. Shen, "Plant-mPLoc: A Top-Down Strategy to Augment
the Power for Predicting Plant Protein Subcellular Localization," PLos One, vol. 5, no. 6, pp. 1-11, 2010.
[50] H. Shen and K. Chou, "Ensemble classifier for protein fold pattern recognition," Bioinformatics, vol. 22, no. 14, pp. 1717-1722, 2006. [51] P. Horton, K. Park, T. Obayashi, N. Fujita, H. Harada, C. Adams, and K.
Nakai, "WoLF PSORT: protein localization predictor," Nucleic Acids Res, vol. 35, pp. 585-587, 2007.
[52] H. Chen, N. Huang, and Z. Sun, "SubLoc: a server/client suite for protein subcellular location based on SOAP," Bioinformatics, vol. 22, no. 3, pp. 376-377, 2006.
[53] O. Emanuelsson, H. Nielsen, S. Brunak, and G. Heijne, "Predicting subcellular localization of proteins based on their N-terminal amino acid sequence," Moleculer biology, vol. 300, no. 4, pp. 1005-1016, 2000. [54] A. Pierleoni, P. L. Martelli, P. Fariselli, and R. Casadio, "BaCelLo: a
balanced subcellular localization predictor," Bioinformatics, vol. 22, no. 14, pp. 408-416, 2006.
[55] T. Tamura and T. Akutsu, "Subcellular location prediction of proteins using support vector machines with alignment of block sequences utilizing amino acid composition," BMC Bioinformatics, vol. 8, no. 466, 2007.
[56] J. Chang, E. Su, A. Lo, H. Chiu, T. Sung, and W. Hsu, "PSLDoc: Protein subcellular localization prediction based on gapped-dipeptides and probabilistic latent semantic analysis," Proteins: Structure Function and Bioinformatics, vol. 72, no. 2, pp. 693-710, 2008.
[57] K. Lee, H. Chuang, A. Beyer, M. Sung, W. Huh, B. Lee, and T. Ideker, "Protein networks markedly improve prediction of subcellular localization in multiple eukaryotic species," Nucleic Acids Res, vol. 36, no. 20, 2008.
[58] W. Chen, P. M. Feng, and E. Z. Deng, "iTIS-PseTNC: a sequence-based predictor for identifying translation initiation site in human genes using pseudo trinucleotide composition," Anal. Biochem, vol. 462, pp. 76-83, 2014.
[59] Y. Xu, Y. Wen, L. S. Wen, and L. Y. Wu, "iNitro-Tyr: Prediction of nitrotyrosine sites in proteins with general pseudo amino acid composition," PLoS ONE, vol. 9, no. e105018, 2014.
[60] H. Lin, E. Z. Deng, and H. Ding, "iPro54-PseKNC: a sequence-based predictor for identifying sigma-54 promoters in prokaryote with pseudo k-tuple nucleotide composition," Nucleic Acids Res, vol. 42, no. 21, pp. 12961-12972, 2014.
[61] B. Liu, L. Fang, F. Liu, and X. Wang, "Identification of real microRNA precursors with a pseudo structure status composition approach," PLoS ONE, vol. 10, no. e0121501, 2015.
[62] J. Jia, Z. Liu, and X. Xiao, "iPPI-Esml: an ensemble classifier for identifying the interactions of proteins by incorporating their physicochemical properties and wavelet transforms into PseAAC " J. Theor. Biol, vol. 377, pp. 47-56, 2015.
[63] K. C. Chou, "Some remarks on protein attribute prediction and pseudo amino acid composition (50th Anniversary Year Review)," Journal of Theoretical Biology, vol. 273, no. 1, pp. 236-247, 2011.
[64] C. Huang and J. Yuan, "Using radial basis function on the general form of Chou’s pseudo amino acid composition and PSSM to predict subcellular locations of proteins with both single and multiple sites," Biosystems, vol. 113, no. 1, pp. 50-57, 2013.
[65] A. Dehzangi, K. K. Paliwal, A. Sharma, O. Dehzangi, and A. Sattar, "A Combination of Feature Extraction Methods with an Ensemble of Different Classifiers for Protein Structural Class Prediction Problem," IEEE/ACM Transactions on Computational Biology and Bioinformatics, vol. 10, no. 3, pp. 564-576, 2013.
[66] P. Du, S. Gu, and Y. Jiao, "PseAAC-General: Fast building various modes of general form of Chou's pseudo-amino acid composition for large-scale protein datasets," International Journal of Molecular Sciences, vol. 15, no. 3, pp. 3495-3506, 2014.
[67] B. Liu, F. Liu, X. Wang, and J. Chen, "Pse-in-One: a web server for generating various modes of pseudo components of DNA, RNA, and protein sequences," Nucleic Acids Res, 2015.
[68] S. W. Zhang, Y. L. Zhang, H. F. Yang, C. H. Zhao, and Q. Pan, "Using the concept of Chou's pseudo amino acid composition to predict protein subcellular localization: an approach by incorporating evolutionary information and von Neumann entropies," Amino Acids, vol. 34, no. 565-572, 2008.
[69] L. Nanni, A. Lumini, D. Gupta, and A. Garg, "Identifying bacterial virulent proteins by fusing a set of classifiers based on variants of Chou's pseudo amino acid composition and on evolutionary information," IEEE/ACM Trans Comput Biol Bioinform, vol. 9, no.2, pp. 467-475, 2012.
[70] G. L. Fan and Q. Z. Li, "Discriminating bioluminescent proteins by incorporating average chemical shift and evolutionary information into
the general form of Chou's pseudo amino acid composition," J. Theor. Biol, vol. 334, pp. 45-51, 2013.
[71] L. Zhang, X. Zhao, and L. Kong, "Predict protein structural class for low-similarity sequences by evolutionary difference information into the general form of Chou's pseudo amino acid composition," J. Theor. Biol, vol. 2014, no. 355, pp. 105-110, 2014.
[72] X. Wang, W. Zhang, Q. Zhang, and G. Z. Li, "MultiP-SChlo: multi-label protein subchloroplast localization prediction with Chou's pseudo amino acid composition and a novel multi-label classifier," Bioinformatics, vol. 31, no. 16, pp. 2639-2345, 2015.
[73] X. Xiao, P. Wang, and W. Z. Lin, "iAMP-2L: A two-level multi-label classifier for identifying antimicrobial peptides and their functional types," Anal. Biochem, vol. 436, no. 2, pp. 168-177, 2013.
[74] K. C. Chou, "Some Remarks on Predicting Multi-Label Attributes in Molecular Biosystems," Molecular Biosystems, vol. 9, pp. 1092-1100, 2013.
[75] W. Chen, P. M. Feng, and H. Lin, "iRSpot-PseDNC: identify recombination spots with pseudo dinucleotide composition," Nucleic Acids Res, vol. 41, no. 6:e68, 2013.
[76] H. Ding, E. Z. Deng, L. F. Yuan, L. Liu, and H. Lin, "iCTX-Type: A sequence-based predictor for identifying the types of conotoxins in targeting ion channels," BioMed Research International (BMRI), 2014. [77] S. H. Guo, E. Z. Deng, L. Q. Xu, H. Ding, and H. Lin, "iNuc-PseKNC: a
sequence-based predictor for predicting nucleosome positioning in genomes with pseudo k-tuple nucleotide composition," Bioinformatics, vol. 30, no. 11, pp. 1522-1529, 2014.
[78] Z. Liu, X. Xiao, and W. R. Qiu, "iDNA-Methyl: Identifying DNA methylation sites via pseudo trinucleotide composition," Anal. Biochem, vol. 474, pp. 69-77, 2015.
Ronesh Sharma received the BTech
degree from the University of the South Pacific (USP), Suva, Fiji, in 2007 and MEng degree from Mokpo National University, South Korea.
He is now pursuing his PhD degree in bioinformatics at University of the South Pacific, Suva, Fiji. His research interests include Bioinformatics, protein secondary, fold and structural class prediction problems, protein subcellular localization prediction problems, intrinsically disordered protein related problems, data mining, and pattern recognition. He is a member of IEEE.
Abdollah Dehzangi received the B.Sc. degree in Computer Engineering-Hardware from Shiraz University, Iran in 2007 and Master degree, in the area of bioinformatics from Multi Media
University (MMU), Cyberjaya,
Malaysia, in 2011 and Ph.D. degree in Bioinformatics at Griffith University Brisbane, Australia in 2015.
He worked as a researcher in National ICT Australia (NICTA) from 2011 to 2014. He joined the Institute for Integrated and Intelligent Systems (IIIS) as research assistant in 2014. His research interests include Bioinformatics, protein secondary, fold and structural class prediction problems, protein local and subcellular localization prediction problems, data mining, statistical learning theory, and pattern recognition. He reviewed several articles and is in the editorial board of several journals. He is a member of IEEE.
James Lyons received BEng degree
with Honors and a BIT from Griffith University Brisbane, Australia in 2007.
He is now pursuing a PhD degree in robust automatic speech and speaker recognition at Griffith University Brisbane, Australia. His research interests include Automatic Speech and Speaker recognition, Bioinformatics, protein fold and structural class prediction problems and pattern recognition.
Kuldip Paliwal received the B.S. degree from Agra University, Agra, India, in 1969, the M.S. degree from Aligarh Muslim University, Aligarh, India, in 1971 and the Ph.D. degree from Bombay University, Bombay, India, in 1978.
He has been carrying out research in the area of speech processing since 1972. He has worked at a number of organizations including Tata Institute of Fundamental Research, Bombay, India, Norwegian Institute of Technology, Trondheim, Norway, University of Keele, U.K., AT & T Bell Laboratories, Murray Hill, New Jersey, U.S.A., AT & T Shannon Laboratories, Florham Park, New Jersey, U.S.A., and Advanced Telecommunication Research Laboratories, Kyoto, Japan. Since July 1993, he has been a professor at Griffith University, Brisbane, Australia, in the School of Micro electronic Engineering. His current research interests include speech recognition, speech coding, speaker recognition, speech enhancement, face recognition, image coding, bioinformatics, protein fold and structural class prediction problems, pattern recognition and artificial neural networks. He has published more than 300 papers in these research areas.
Dr. Paliwal is a Fellow of Acoustical Society of India. He has served the IEEE Signal Processing Society’s Neural Networks Technical Committee as a founding member from 1991 to 1995 and the Speech Processing Technical Committee from 1999 to 2003. He was an Associate Editor of the IEEE Transactions on Speech and Audio Processing during the periods 1994–1997 and 2003- 2004. He also served as Associate Editor of the IEEE Signal Processing Letters from 1997 to 2000. He was the editor–in– chief of Speech Communication Journal from 2005 to 2011. He was the General Co-Chair of the Tenth IEEE Workshop on Neural Networks for Signal Processing (NNSP2000).
Tatsuhiko Tsunoda, Ph.D. in Medicine and Ph.D. in Engineering, is a Director of Research Group for Medical Informatics, RIKEN Center for Genomic Medicine. He graduated from the Faculty of Science, the University of Tokyo (1989), was educated in elementary particle physics (1989-1991), and obtained his Ph.D.s (1995 in Engineering, and 2007 in Medicine).
After researching as an Assistant Professor of Kyoto University (1995-1997), he started a research on human
genome sequence analysis as a Research Associate of the Institute of Medical Science, the University of Tokyo, and on cancer gene expression in addition, as an Assistant Professor (1998-2000). He has been leading the Laboratory (2000) and the Research Group (2011) for Medical Informatics, RIKEN Center for Genomic Medicine. He has an additional post of Visiting Professor at the Institute of Statistical Mathematics (2012-). He did and has been doing pioneering works in: haplotype block analysis in the first GWAS; development of a high-throughput analysis pipeline of GWAS; analysis of linkage disequilibrium patterns in the whole human genome, which was the first in the world; data coordination, and linkage disequilibrium and homozygosity analyses in the international HapMap project; development of a haplotype phasing algorithm of copy number variation, which was the first in the world; and the first whole genome sequence and comprehensive analysis of a Japanese individual’s genome using a next-generation sequencer. He is leading statistical analyses and applied mathematics in RIKEN Center for Genomic Medicine. He is a member of the International Cancer Genome Consortium. He is also a councilor of the Japanese Cancer Association, is a councilor of the Japanese Society of Human Genetics, is an Associate Editor of Cancer Science Journal, is an Associate Editor of the Journal of Human Genetics, and a member of American Society of Human Genetics.
Alok Sharma received the BTech
degree from the University of the South Pacific (USP), Suva, Fiji, in 2000 and the MEng degree, with an academic excellence award, and the PhD degree in the area of pattern recognition from Griffith University, Brisbane, Australia, in 2001 and 2006, respectively. He was with the University of Tokyo, Japan (2010-2012) as a research fellow. He is an A/Prof. at the USP and an Adjunct A/Prof. at the Institute for Integrated and Intelligent Systems (IIIS), Griffith University. He participated in various projects carried out in conjunction with Motorola (Sydney), Auslog Pty., Ltd. (Brisbane), CRC Micro Technology (Brisbane), the French Embassy (Suva) and JSPS (Japan). His research interests include pattern recognition, computer security, human cancer classification and protein fold and structural class prediction problems. He reviewed several articles and is in the editorial board of several journals. He is a member of IEEE.