Civil Engineering Journal
Vol. 4, No. 9, September, 2018A Fuzzy Inference System in Constructional Engineering Projects
to Evaluate the Design Codes for RC Buildings
Reze Kamgar
a*, Seyed Morteza Hatefi
a, Noorollah Majidi
aa Department of Civil Engineering, Shahrekord University, Shahrekord, Iran. Received 09 June 2018; Accepted 15 September 2018
Abstract
Economical design of a building is one of the main aims that should be followed because of its importance in constructional projects. In order to have an economical design, longitudinal reinforcing bars in the reinforced concrete members are among those parts of the structure that can be designed economically. The application of fuzzy inference systems provides an effective tools to handle the uncertainties and subjectivities arising in the designing process of buildings. Therefore, the main purpose of this paper is to propose a fuzzy inference system to evaluate the building design codes from an economical point of view. For this purpose, after designing the mentioned fuzzy inference system, three examples of three-dimensional concrete buildings are analysed and designed using different codes. For all these codes, the structural properties of concrete buildings, the gravity and the seismic loads are considered to be the same. Finally, it finds that the fuzzy logic theory is an effective and practical tool to compute a value that shows the distance between the designed building and the economically designed building. Also, it concludes that between the studied codes, (EUROCODE 2-1992, Hong Kong CP-04, CSA A23.3-04 and ACI 318-05), the ACI 318-05 and Hong Kong CP04 codes lead to a more economical design for taller buildings. For low-rise buildings, the CSA A23.3-04 and ACI 318-05 codes lead to an economical design. Also, the EUROCODE 2-1992 has a minimum value for the economical design of all the considered buildings.
Keywords: Fuzzy Logic Theory; Economical Design; Seismic Load; Concrete Building; Design Codes.
1. Introduction
In concrete members, longitudinal reinforcing bars are utilized in order to increase low tensile strength. In designing concrete sections, the criterion for selecting standard reinforcing bars is the value of stress which is applied on that section.Therefore, in reinforced concrete beams and columns, due to the weakness of the concrete against the tensile stress, steel bars are placed in tensile zone. In addition,in reinforced concrete members, stretching due to bending is sustained by longitudinal reinforcing bars and pressure due to bending is sustained by the concrete in the compression zone [1-5]. Finding optimum values of steel bars for the concrete sections is effective in such a way that, in addition to sustaining the internal forces induced by the external forces, the project would become more economic.
Nowadays, the principal objectives of structural designing have been used to design a structure for stability, strength and serviceability, while considering it to be both economic and aesthetic. [6]. The stability needs to be considered so as to prevent overturning, sliding or buckling of the structure, or parts of it, under the action of loads (the gravity loads, seismic load, etc.). The strength needs to be taken into account to safely resist the stresses induced by the loads in various structural members and the serviceability is required to be considered to ensure satisfactory performance under service load conditions –implying provision of adequate stiffness and reinforcements to contain deflections, crack-widths and vibrations within acceptable limits, and also providing impermeability, durability (including corrosion-resistance), etc.
* Corresponding author: [email protected] http://dx.doi.org/10.28991/cej-03091147
This is an open access article under the CC-BY license (https://creativecommons.org/licenses/by/4.0/). © Authors retain all copyrights.
Accordingly, all of the above mentioned criteria must be met in designing process of a structure and also the procedure design must be taken to be economic.
A set of assumptions and procedures which are used to obtain serviceability, safety, economy and functionality of the structure, is defined as the design philosophy. There are several design philosophies which have been used by engineers. Some of them are as follows: 1- working stress design (WSD) or allowable stress design (ASD), 2- ultimate load method (ULM) or load factor method (LFM) or ultimate strength method (USM) and 3- limit state method (LSM) [7]. Between these methods, load and resistant factor design (LRFD) is a method which is more frequently used. It is important to note that the LRFD method is categorized as the LSM approach.
Nowadays, soft computing approaches such as fuzzy inference systems (FIS), adaptive neuro-fuzzy inference systems (ANFIS) and artificial neural networks (ANN) have been used for modeling engineering applications [8-17]. Ebrahimpour and Maghsoudi used the ANFIS model to predict the curvature ductility factor for FRP strengthened reinforced high strength concrete beams [8]. In the same line of inquiry, Gu and Oyadiji used the ANFIS controller for reducing the vibration of an multi-degree of freedom structure with magneto-rheological damper [9]. Cevik presented the genetic programming, stepwise regression, neuro-fuzzy and neural networks to model the strength enhancement of FRP confined concrete cylinders [10]. In addition, Amini and Moeini predicted the shear strength of reinforced concrete beams using ANFIS and ANN [11]. The bond strength of FRP-to-concrete joints studied by Mashrei et al using the back-propagation neural network [12]. The deflection of high-strength self-compacting concrete deep beams studied by Mohammadhassani et al using ANFIS [13]. In a similar vein, Melin and Castillo presented a hybrid method for nonlinear dynamic systems using neural networks, fuzzy logic and fractal theory [16]. Das et al. used the artificial neural networks to reduce the amounts of carbon and manganese from the in-process molten steel [17]. Neuro-Fuzzy is mostly used in the water resources management to predict the behavior of these systems. Neuro-Fuzzy GMDH Approach used to predict the longitudinal dispersion in water networks by Najafzadeh and Sattar [18]. In addition, Najafzadeh and Lim used the improved neuro-fuzzy GMDH to predict scour depth at sluice gates [19]. The velocity at limit of deposition in storm sewers predicted using neuro-fuzzy GMDH model by Najafzadeh and Bonakdari [20]. Also, the artificial neural network (ANN) such as M5 model Tree employed by Behnood et al. for the predictions of the elastic modulus of recycled aggregate concrete [21]. The peak and residual conditions for actively confined concrete evaluated using neuro-fuzzy and neural computing techniques by Mansouri et al. [22]. Artificial neural networks utilized by Naderpour and Poursaeidi to predict the shear resistant of concrete beams reinforced by fiber reinforced polymer bars [23]. Additionally, Tomography data and artificial neural networks utilized to evaluate the quality of porous carbon fiber reinforced polymer [24]. By reviewing the literature, it can be concluded that the soft computing techniques has opened a new field in engineering problems.
Based on the above mentioned descriptions, computing the optimal values for the longitudinal bars is essential so that all the above mentioned criteria would be met and that the design would be economic. In fact, the novelty of this paper lies in the notion that it presents an effective and practical tool to find an economical design between existing codes. This is the main necessity to carry out this paper since there is no literature on the investigation of codes from an economic point of view. To find the economical code, all the above mentioned criteria are considered, too. The fuzzy logic is one of the robust tools which is used to compute a value that shows the distance between the designed building and the economically designed one. Thus, in this paper, among many artificial intelligence methods, the fuzzy theory is used to find the best design code from the list of the studied codes, leading to an economical design. For this purpose, three examples of three-dimensional concrete buildings are analyzed and designed using different codes. For all the codes, the structural properties of concrete building, the gravity and seismic loads are considered to be the same. It finds that the fuzzy logic theory is an effective and practical tool to find the best code which leads to having an economical design. Based on the obtained results, it is clear that the ACI 318-05 and Hong Kong CP04 codes leads to a more economical design for taller buildings. For low-rise buildings, the CSA A23.3-04 and ACI 318-05 codes lead to an economical design. Also, the EUROCODE 2-1992 has minimum economical design for all the considered buildings.
2. Modeling and Mathematical Formulation of Fuzzy Logic Theory
In this paper, the following inputs are considered to construct the fuzzy logic model: number of beams and columns which is used in the structure, the effective depth and width of beams, the effective depth and width of columns, the length of beams and columns, the area of reinforced and uncurtailed bars in the beams and columns, the compressive strength of concrete at 28 day (𝑓𝑐′) and the yield stress of reinforcing bars (𝑓𝑦) [25-28]. For each member, to obtain the value of ρ, the total area of the rebars should be divided into the effective area of the cross section. For the columns, there is no need to reinforced rebars and the total area of the rebars can be computed by summing the area of uncurtailed bars.But for the beams section, due to the reinforcing bar, the following formula is used to calculate the equivalent area of rebars.
(1) , 1 1 1 ( s ) n s n n s s A L A L A L A b d
Where As, As1, L1, As,n, Ln, b, d and L are the equivalent area of rebars in the beam section, area of uncurtailed bar, length of uncurtailed bar without development length and curve, area of reinforcing bars, length of reinforcing bars, width of beam section, effective depth of beam section and the length of beam, respectively.
To compare the design codes from an economical point of view, the minimum and maximum limits on the longitudinal reinforcement ratios are selected based on ACI 318-05 requirements [25]. The ACI 318-05 are frequently used by engineering to design the concrete structures in the world. Thus, it can be selected as a reference design code in order to compare the results of designed structures by using different codes simultaneously. For this purpose, the Fuzzy inference system (FIS) and the membership functions for columns, beams and outputs are defined in accordance with the ACI 318-05 requirements [25]. Therefore, the structures are analyzed and designed for the above mentioned design codes separately. Finally, results obtained for the designed structures using different design codes are compared together to find the best design code from an economical point of view.
For a beam section, the minimum and maximum limits on the longitudinal reinforcement ratios(𝜌𝑚𝑖𝑛and 𝜌𝑚𝑎𝑥) are as follows: (2) ' min ( ) 0.25 1.4 4 max , , 3 c s requeid y y f A f f
(3) 1 0.364 t c max y d f d f Where the value of 1parameter can be calculated as follows:
(4)
1 ' 0.85 30 1.064 0.0074 0.65 30 c c c f MPa f f MPa In Equation 3-4, dt and d parameters are the value of effective depth of the cross section and the distance value from the extreme compression fiber to the center of area of tensile rebars, respectively.
The minimum and maximum limits on longitudinal reinforcement ratios in a column section are 𝜌𝑚𝑖𝑛= 1%,
𝜌𝑚𝑎𝑥 = 2.25%, respectively.
Firstly, the values of longitudinal reinforcement ratios for beams and columns are computed. Then, in order to evaluate the economical aspect of a building, the equivalent longitudinal reinforcement ratio (the weighted average of the longitudinal reinforcement ratio for the structure) is computed as follows:
(5) 1 1 n i n equ i i i i L ρ ρ L
Where Li, 𝜌𝑖 and 𝜌𝑒𝑞𝑢 are the length of each element (beam and column sections), the longitudinal reinforcement ratio for each element and the equivalent longitudinal reinforcement ratio for the structure, respectively.
3. Fuzzy Inference System (FIS) and the Membership Function for Columns and Beams
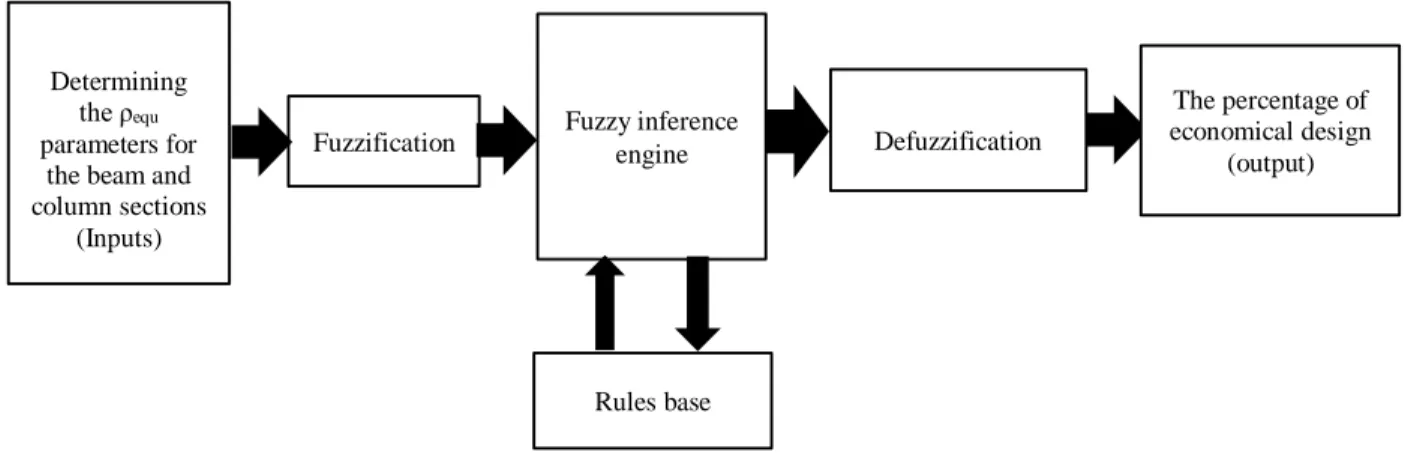
The fuzzy inference system provides a schematic process for converting a knowledge base into a nonlinear mapping [29]. For this reason, fuzzy systems are used in engineering applications and complex decisions. In fuzzy inference system, a given input set is mapped to an output set by using fuzzy logic [30]. A typical fuzzy inference system is depicted in Figure 1. According to Figure 1, the fuzzy inference system has the following components:
1) The fuzzifier that converts the numerical value of input variables to a fuzzy set by defining the membership function.
Triangular and trapezoidal membership functions are the most frequently used methods for converting linguistic terms in the fuzzification process. In this paper, the trapezoidal membership function is utilized to fuzzify inputs in the studied fuzzy inference system. Inputs are beams and columns that are fuzzified based on the values of ρ.
2) The base of the fuzzy rules which is a set of if-then rules.
The fuzzy membership functions constructed for inputs in the previous stage are used to generate fuzzy if-then rules. An if-then rule is constructed based on the experts’ opinions.
3) A fuzzy inference engine that converts inputs into outputs.
This step is the main part of a fuzzy expert system. In this step, the fuzzy inference unit employs fuzzy if-then rules to assign a map from fuzzy inputs to fuzzy outputs. The inference process of the fuzzy inference engine is similar to the process of human reasoning, so that by applying it to the inputs and rules, the output is determined, and this is what human beings use in much of their judgments. The function of the fuzzy inference engine can be divided into several parts [31]. When the number of inputs is greater than one, fuzzy operators must be used to obtain a number representing the result of the antecedent part of the rule; then the number is applied to the output function. This number is called the "minimum matching degree between inputs and output" of that law. Mamedani inference uses the min operator to obtain minimum matching degree of each rule. After obtaining the matching degree of each rule, an aggregation function must be used to aggregate the results of all the fuzzy rules [32].
4) The defuzzifier that converts the fuzzy outputs to a crisp number.
The ultimate step in a fuzzy inference system includes defuzzification process which converts a fuzzy value to a crisp output value. According to [33], there are several defuzzification methods such as centroid average (CA), centre of gravity (COG), maximum centre average (MCA), mean of maximum (MOM), smallest of maximum (SOM), and largest of maximum (LOM) [32].
Figure 1. A typical fuzzy inference system
Based on the aforementioned explanations, this paper customizes the fuzzy inference system for the evaluation of designed building codes. The studied fuzzy inference system has two inputs, including the size of columns and beams and one output, including reinforcement ration percentage. The membership function of beams and columns are different because the value of ρmax is always constant in the columns sections, while it varies in the beams. In this paper, the graphs for the membership function of beams and columns are categorized into three phases based on the values of ρ. These phases are low rebar (L), medium rebar (called economic rebar) (E), and high rebar (H).
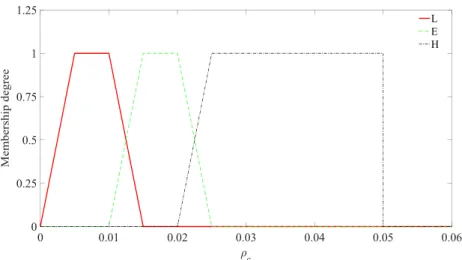
For the columns sections, the trapezoidal fuzzy numbers is used to show the membership functions of columns (see Figure 2) that is shown by the following trapezoidal fuzzy numbers.
(6) ( ) [0,0.005,0.01,0.015] ( ) [0.01,0.015,0.02,0.025] ( ) [0.02,0.025,0.05,0.05] Low rebar L Medium rebar E High rebar H Determining the ρequ parameters for
the beam and column sections
(Inputs)
Fuzzification Fuzzy inference engine
Rules base
Defuzzification
The percentage of economical design
Figure 2. The membership function of the columns used in FIS
Also, to fuzzify the beams sections, the following trapezoidal fuzzy numbers are defined. The membership function of beams is graphically depicted in Figure 3.
(7) max
min min
max max max max
max max max max
( ) [0, ,1.5 ,0.4 ] ( ) [0.1 ,0.4 ,0.6 ,0.8 ] ( ) [0.6 ,0.8 , ,1.2 ] Low rebar L Medium rebar E High rebar H
Figure 3. The membership function of the beams used in FIS
Finally, the membership function for all the structures which are used to determine the output of the fuzzy inference system (called the reinforcement ratio percentage) is as follows (see Figure 5):
Figure 4. The used fuzzy model for the economical design
design, respectively. The percentages which are considered to draw Figure 4 are displayed in the matrix form as follows: (8) ( ) [0,40,60,100] ( ) [60,100,100,120] ( ) [110,120,200,200] Loweconomic design L Economic design E Non economic design H
According to the above expression, the rules for the fuzzy inference engine should be expressed based on the engineering visibility. In this paper, Mamdani fuzzy inference engine is used. Also, in order to aggregate the results of all the rules, the maximum method is chosen. For this paper, the following rule base is used, which has 9 fuzzy rules (see Table 1). For example, the first fuzzy rule can be stated as follows: If (column is Low rebar) and (beam is Low rebar) then (the building is Low economic design).
Table 1. The used rules in the fuzzy system H M L beams columns M M L L H M M M H H M H
Finally, based on the obtained number at the end of the inference, the economics of the structure is estimated. This structure is economic if the obtained number is placed somewhere between %80 and %100; if the obtained number is below %80, the design of structure should be checked; and, if it is above 100%, the design of this structure is not economic.
4. Evaluating the Economical Design of three Different Buildings Designed by Different Codes
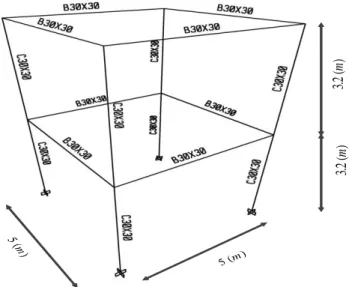
In this paper, as in example one, a two-storey three-dimensional concrete building is considered. The height of each storey is 3.2m. The length of beams in all two directions is 5m. The beams and the columns section are squares with cross sections 0.3×0.3m. The concrete cover on the beams and the columns sections is about 0.05 (m) on the upper and lower sides. For each storey, the values of dead and live loads are 500 𝑘𝑔/𝑚2 and 200 𝑘𝑔/𝑚2, respectively. The 2800 code is used to consider the seismic load on the structure [34]. The building is assumed to be residential and constructed in the moderate seismic zone at type II soil. The lateral loading system is the moderate bending frame and the effect of infill wall on the natural frequency of the structure is considered. Thus, the earthquake coefficient C for the mentioned building is 0.125. Also, the strength of concrete and steel is 25 MPa and 400 MPa, respectively. In addition, the number of beams and columns is equal to 8 (see Figure 5). The mentioned building is analyzed and designed using different design codes such as ACI 318-05 code, Hong Kong CP 4, CSA A23.3-04 and EUROCODE 2-1992 by Etabs software [35]. In Figure 5, B30×30 and C30×30 show a beam and column with 30 cm width and height in the cross section.
Figure 5. The three-dimensional model of the used building
3. 2 ( ) m 5 (m) 5 ( ) m 3. 2 ( ) m
The next section shows the area of uncurtailed and reinforcing bars and the equivalent area of rebars in the beams section which is designed based on different codes. The area of the required bars for the beam sections are computed in six sections of the beam. Then, the value of uncurtailed and reinforcing bars are determined. The value of reinforcing bars are determined at the start and the end section of the beam for top and bottom sections. The following abbreviation signs are used to show the location of beam’s sections.
The required reinforcing area for the left/top location of the beam (LT) The required reinforcing area for the left/bottom location of the beam (LB) The required reinforcing area for the right/top location of the beam (RT) The required reinforcing area for the right/bottom location of the beam (RB)
5. Area of Rebars Designed by Different Codes
5.1. ACI 318-05
For the ACI code, the minimum and maximum values for the longitudinal reinforcement in all columns are 900 (mm2). Based on the above expression, the average ρ for the columns section is 0.0120, the average ρ for the beams section is 0.0026 and the fuzzy matrix for the columns and the beams section are as bellow (see Figures 2 and 3).
Table 2. The upper and lower bounds of the computed area for rebars of beam’s sections designed by ACI 318-05 [25] Upper and
lower bounds
Uncurtailed
bar (mm2) LT (mm2) LB (mm2) RT (mm2) RB (mm2)
equivalent area of rebars (mm2) Minimum 105 47 0 47 0 98.709 Maximum 475 175 79 175 79 281.057 (9) 0 0.0050 0.0100 0.0150 0.0100 0.0150 0.0200 0.0250 0.0200 0.0250 0.0500 0.0500 0 0.0035 0.0052 0.0077 0.0052 0 .0077 0.0116 0.0155 0.0116 0.0193 0.0232 0. 232 0 Columns Beams
Therefore, the following final results can be obtained for the designed building by the ACI code. The results of applying fuzzy inference system are obtained by using Fuzzy Logic Toolbox in Matlab software. As can be seen in Figure 6, the final output is 59.4. To obtain the results that have been shown in this figure, for all the structural members (beams and columns) of this considered building, the equivalent longitudinal reinforcement ratios are computed. The equivalent longitudinal reinforcement ratios for the column and the beam elements are 0.012 and 0.0026, respectively. Then, considering Figures (2-3) and using FIS, the membership degrees for beams and columns elements for each rule is computed. The first and the second columns in Figure 6 show these values for beam and column elements in each rule. Then, considering the selected rules that are introduced in Table 1, the economical percentage of the structure is computed for each rule. The third column shows the economical percentage of the structure for each rule. Finally, based on the FIS rules, a single output is computed indicating the economical percentage of the structure based on all the considered rules. For these considered building and code, the final output is 59.4. This value shows the percentage of economical design.
Figure 6. The obtained results for the designed building by ACI 318-05 5.2. CSA A23.3-04
The mentioned building is also designed according to the CSA A23.3-04 code and the following results are obtained.
Table 3. The upper and lower bounds of computed area for rebars of beam’s sections designed by CSA A23.3-04 [26] Upper and lower bounds Uncurtailed bar (mm2) LT (mm2) LB (mm2) RT (mm2) RB (mm2) equivalent area of rebars (mm2) Minimum 262 0 0 0 0 144.273 Maximum 520 200 0 54 0 298.476
For the CSA code, the minimum and maximum values for the longitudinal reinforcement in all the columns are 900 (mm2). Therefore, the following final results can be obtained for the designed building by the CSA code. As can be observed in Figure 7, the final output is 59.9. In a similar vein, the equivalent longitudinal reinforcement ratios for the column and the beam elements are 0.0121 and 0.0029, respectively. Also, based on the FIS rules, the percentage of economical design is 59.9 for the considered building and code.
Figure 7. The obtained results for the designed building by CSA
5.3. Hong Kong CP-04
Also, the mentioned building is also designed according to the Hong Kong CP-04 code and the following results are obtained.
Table 4. The upper and lower bounds of computed area for rebars of beam’s sections designed by Hong Kong CP-04 [27] Upper and lower
bounds Uncurtailed bar (mm2) LT (mm2) LB (mm2) RT (mm2) RB (mm2) equivalent area of rebars (mm2) Minimum 298 46 0 46 0 92.383 Maximum 518 14 206 14 245.097
For the Hong Kong CP-04 code, the minimum and maximum values for the longitudinal reinforcement in all the columns are 720 (mm2). Therefore, the following final results can be obtained for the designed building by the Hong Kong CP-04 code. As it is evident in Figure 8, the final output is 55.3. In a same way, the equivalent longitudinal reinforcement ratios for the column and the beam elements are 0.0111 and 0.0022, respectively. Also, based on the FIS rules, for these considered building and code, the percentage of economical design is 55.3.
Figure 8. The obtained results for the designed building by Hong Kong CP-04
5.4. EUROCODE 2-1992
Finally, the mentioned building is also designed according to the EUROCODE 2-1992 and the following results are obtained.
Table 5. The upper and lower bounds of computed area for rebars of beam’s sections designed by EUROCODE 2-1992 [28] Upper and lower
bounds Uncurtailed bar (mm2) LT (mm2) LB (mm2) RT (mm2) RB (mm2) equivalent area of rebars (mm2) Minimum 224 52 0 52 0 80.546 Maximum 1016 195 79 195 79 301.520
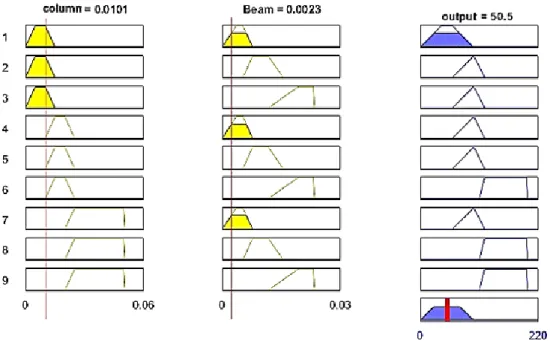
For the EUROCODE 2-1992, the minimum and maximum values for the longitudinal reinforcement in all the columns are 396 and 640 (mm2), respectively. Therefore, the following final results can be obtained for the designed building by the EUROCODE 2-1992. As it is obvious in Figure 9, the final output is 50.5. Similarly, the equivalent longitudinal reinforcement ratios for the column and the beam elements are 0.0101 and 0.0023, respectively. Also, based on the FIS rules, the percentage of economical design is 50.5 for this considered building and code.
Figure 9. The obtained results for the designed building by EUROCODE 2-1992
Based on the obtained results (Table 6), it is clear that CSA A23.3-04 can be taken as the most economic codes among the studied codes and that EUROCODE 2-1992 has the minimum value for this parameter.
Table 6. Results for percentage of economic design for different codes Percentage of economic design
Codes 50.5 EUROCODE 2-1992 55.3 Hong Kong CP-04 59.4 ACI 318-05 59.9 CSA A23.3-04
As a second example, a five-storey three-dimensional concrete building is also considered. The height of each storey is 3.2 (m). The used sections for the beams and the columns are shown in Figure 10. The concrete cover on the beams and the columns sections is about 0.05 (m) on the upper and lower sides. For each storey, the values of dead and live loads are 500 𝑘𝑔/𝑚2 and 200 𝑘𝑔/𝑚2, respectively. The 2800 code is used to consider the seismic load on the structure. The building is assumed to be residential with Medium degree of importance and constructed in the very high seismic zone at type III soil. The lateral loading system is the moderate bending frame and the effect of infill wall on the natural frequency of the structure is not considered. Thus, the earthquake coefficient C for the mentioned building is 0.1543. Also, the strength of concrete and steel is 25 and 400 MPa, respectively. In addition, the number of beams is equal to 35 and the number of columns is equal to 30 (see Figure 10). The length of beams in x direction is 6 (m) and this value in y direction is 5 (m). The mentioned building is analyzed and designed using different design codes such as ACI 318-05 code, Hong Kong CP 4, CSA A23.3-04 and EUROCODE 2-1992 by Etabs software [35].
Figure 10. The three-dimensional model of the used building 5.5. ACI 318-05
For the ACI 318-05, the minimum and maximum values for the longitudinal reinforcement in all the columns are 900 and 2025 (mm2), respectively. Therefore, the following final results can be obtained for the designed building by the ACI code. As can be seen in Figure 11, the final output is 66.8. The equivalent longitudinal reinforcement ratios for the column and the beam elements are 0.0131 and 0.0022, respectively. Also, based on the FIS rules, for the considered building and code, the percentage of economical design is 66.8.
Table 7. The upper and lower bounds of computed area for rebars of beam’s sections designed by ACI 318-05 [25] Upper and
lower bounds
Uncurtailed
bar (mm2) LT (mm
2) LB (mm2) RT (mm2) RB (mm2) equivalent area of rebars
(mm2)
Minimum 37 0 0 7 0 39.709
Maximum 572 417 194 447 194 369.797
Figure 11. The obtained results for the designed building by ACI 318-05
3. 2 ( ) m 3. 2 ( ) m 3. 2 ( ) m 3. 2 ( ) m 3. 2 ( ) m 5 (m) 5 (m) 5 ( ) m
5.6. CSA A23.3-04
The mentioned building is also designed according to CSA A23.3-04 code and the following results are obtained.
Table 8. The upper and lower bounds of computed area for rebars of beam’s sections designed by CSA A23.3-04 [26] Upper and lower bounds Uncurtailed bar (mm2) LT (mm2) LB (mm2) RT (mm2) RB (mm2) equivalent area of rebars (mm2) Maximum 262 0 0 0 0 144.273 Minimum 619 470 155 505 155 402.643
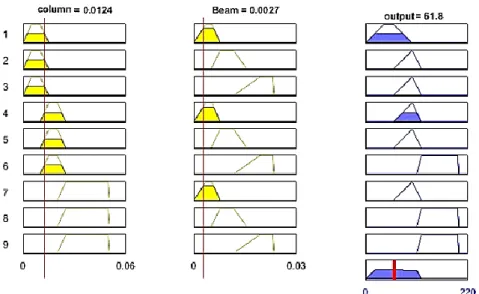
Regarding CSA A23.3-04, the minimum and maximum values for the longitudinal reinforcement in all columns are 900 and 2025 (mm2), respectively. Therefore, the following final results can be obtained for the designed building by the CSA code. As it can be observed in Figure 12, the final output is 61.8. In addition, the equivalent longitudinal reinforcement ratios for the column and the beam elements are 0.0124 and 0.0027, respectively. Also, based on the FIS rules, for these considered building and code, the percentage of economical design is 61.8.
Figure 12. The obtained results for the designed building by CSA 5.7. Hong Kong CP-04
Also, the mentioned building is also designed according to the Hong Kong CP-04 code and the following results are obtained.
Table 9. The upper and lower bounds of computed area for rebars of beam’s sections designed by Hong Kong CP-04 [27] Upper and lower bounds Uncurtailed bar (mm2) LT (mm 2) LB (mm2) RT (mm2) RB (mm2) equivalent area of rebars (mm2) Maximum 149 0 0 0 0 82.048 Minimum 720 477 302 514 302 400.789
For the Hong Kong CP 04, the minimum and maximum values for the longitudinal reinforcement in all the columns are 720 and 2110 (mm2), respectively. Therefore, the following final results can be obtained for the designed building by the Hong Kong CP-04 code. As it is depicted in Figure 13, the final output is 68.7. Subsequently, the equivalent longitudinal reinforcement ratios for the column and the beam elements are 0.0134 and 0.0022, respectively. Also, based on the FIS rules, for the considered building and code, the percentage of economical design is 68.7.
Figure 13. The obtained results for the designed building by Hong Kong CP-04 5.8. EUROCODE 2-1992
Finally, the mentioned building is also designed according to the EUROCODE 2-1992 and the following results are obtained.
Table 10. The upper and lower bounds of computed area for rebars of beam’s sections designed by EUROCODE 2-1992 [28] Upper and lower bounds Uncurtailed bar (mm2) LT (mm2) LB (mm2) RT (mm2) RB (mm2) equivalent area of rebars (mm2) Maximum 112 0 0 0 0 61.674 Minimum 605 458 300 492 300 393.361
For the EUROCODE 2-1992, the minimum and maximum values for the longitudinal reinforcement in all the columns are 505 and 1477 (mm2), respectively. Therefore, the following final results can be obtained for the designed building by the EUROCODE 2-1992. As can be seen in Figure 9, the final output is 50. Similarly, the equivalent longitudinal reinforcement ratios for the column and the beam elements are 0.0071 and 0.0023, respectively. Also, based on the FIS rules, for these considered building and code, the percentage of economical design is 50.
Based on the obtained results (Table 11), it is evident that the ACI 318-05 and Hong Kong CP-04 are economic codes among the studied codes and the EUROCODE 2-1992 has the minimum value for this parameter.
Table 11. Results for percentage of economic design for different codes Percentage of economic design
Codes 50 EUROCODE 2-1992 61.8 CSA A23.3-04 66.8 ACI 318-05 68.7 Hong Kong CP-04
As a third example, an eight-storey three-dimensional concrete building is also considered. The height of each storey is 3.2 (m). The used sections for beams and columns are shown in Figure 15. The concrete cover on beams and columns sections is about 0.05 (m) on the upper and lower sides. For each storey, the values of dead and live loads are
2
500kg /m and500kg /m2, respectively. The 2800 code is used to consider the seismic load on the structure. The building is assumed to be a hospital with very high degree of importance and constructed in the very high seismic zone at type IV soil. The lateral loading system is the special bending frame and the effect of infill wall on the natural frequency of the structure is not considered. Thus, the earthquake coefficient C for the mentioned building is 0.18. Also, the strength of concrete and steel is 25 and 400 MPa, respectively. In addition, the number of beams is equal to 56 and the number of columns is equal to 48 (see Figure 15). The length of beams in x direction is 6 (m) and the length of beams in y direction is 5 (m). The mentioned building is analyzed and designed using different design codes such as ACI 318-05 code, Hong Kong CP 4, CSA A23.3-04 and EUROCODE 2-1992 by Etabs software [35].
Figure 15. The three-dimensional model of the used building 5.9. ACI 318-05
For the ACI 318-05, the minimum and maximum values for the longitudinal reinforcement in all the columns are 900 and 4804 (mm2), respectively. Therefore, the following final results can be obtained for the designed building by ACI code. As can be seen in Figure 16, the final output is 93.3. In a similar vein, the equivalent longitudinal reinforcement ratios for the column and the beam elements are 0.0157 and 0.0031, respectively. Also, based on the FIS rules, for the considered building and code, the percentage of economical design is 93.3.
Table 12. The upper and lower bounds of computed area for rebars of beam’s sections designed by ACI 318-05 [25] Upper and
lower bounds
Uncurtailed
bar (mm2) LT (mm2) LB (mm2) RT (mm2) RB (mm2)
equivalent area of rebars (mm2) Maximum 35 0 0 0 0 28.700 Minimum 885 523 361 580 361 598.563 3.2 ( ) m ) m ( 3.2 ) m ( 3.2 ) m ( 3.2 ) m ( 3.2 ) m ( 3.2 ) m ( 3.2 ) m ( 3.2 5 ( ) m 5 ( ) m 5 (m)
Figure 16. The obtained results for the designed building by ACI 318-05 5.10. CSA A23.3-04
The mentioned building is also designed according to the CSA A23.3-04 code and the following results are obtained.
Table 13. The upper and lower bounds of computed area for rebars of beam’s sections designed by CSA A23.3-04 [26] Upper and lower bounds Uncurtailed bar (mm2) LT (mm2) LB (mm2) RT (mm2) RB (mm2) equivalent area of rebars (mm2) Maximum 262 262 0 0 0 0 Minimum 791 973 617 428 687 428
For the CSA A23.3-04, the minimum and maximum values for the longitudinal reinforcement in all the columns are 900 and 3698 (mm2), respectively. Therefore, the following final results can be obtained for the designed building by the CSA code. As can be seen in Figure 17, the final output is 79.8. In the same way, the equivalent longitudinal reinforcement ratios for the column and the beam elements are 0.0143 and 0.0039, respectively. Also, based on the FIS rules, the percentage of economical design is 79.8 for these considered building and code.
Figure 17. The obtained results for the designed building by CSA 5.11. Hong Kong CP-04
Also, the mentioned building is also designed according to the Hong Kong CP-04 code and the following results are obtained.
Table 14. The upper and lower bounds of computed area for rebars of beam’s sections designed by Hong Kong CP-04 [27] Upper and lower bounds Uncurtailed bar (mm2) LT (mm2) LB (mm2) RT (mm2) RB (mm2) equivalent area of rebars (mm2) Maximum 149 0 0 0 0 82.048 Minimum 974 650 480 726 480 672.563
For the Hong Kong CP 04, the minimum and maximum values for the longitudinal reinforcement in all the columns are 1429 and 4888 (mm2), respectively. Therefore, the following final results can be obtained for the designed building by the Hong Kong CP-04 code. According to Figure 18, the final output is 93.3. In the same way, the equivalent longitudinal reinforcement ratios for the column and the beam elements are 0.0191 and 0.0031, respectively. Also, based on the FIS rules, for these considered building and code, the percentage of economical design is 93.3.
Figure 18. The obtained results for the designed building by Hong Kong CP-04 5.12. Euro code 2-1992
Finally, the mentioned building is also designed according to the EUROCODE 2-1992 and the following results are obtained.
Table 15. Computed area for rebars of beam sections designed EUROCODE 2-1992 [28] Upper and lower
bounds Uncurtailed bar (mm2) LT (mm2) LB (mm2) RT (mm2) RB (mm2) equivalent area of rebars (mm2) Maximum 112 0 0 0 0 61.674 Minimum 960 550 291 586 291 705.269
For the Hong Kong CP 04, the minimum and maximum values for the longitudinal reinforcement in all the columns are 406 and 2433 (mm2), respectively. Therefore, the following final results can be obtained for the designed building by the EUROCODE 2-1992. As can be seen in Figure 19, the final output is 50. In the same way, the equivalent longitudinal reinforcement ratios for the column and the beam elements are 0.0074 and 0.0035, respectively. Also, based on the FIS rules, for this considered building and code, the percentage of economical design is 50.
Figure 19. The obtained results for the designed building by EUROCODE 2-1992
Based on the obtained results (Table 16), it can be observed that the ACI 318-05 and Hong Kong CP-04 can be considered as the economic codes among the studied codes here and that the EUROCODE 2-1992 has the minimum value for this parameter.
Table 16. Results for percentage of economic design for different codes Percentage of economic design Codes 50 EUROCODE 2-1992 79.8 CSA A23.3-04 93.3 ACI 318-05 93.3 Hong Kong CP-04
6. Conclusion
This paper investigates the economical design of longitudinal reinforcing bars for a building. For this purpose, three examples of three-dimensional concrete buildings are analyzed and designed using different codes. For all these codes, the structural properties of concrete building, the gravity and the seismic loads are considered to be the same. Finally, using the fuzzy logic theory, the percentage of economic design is computed and the best design code is determined. The study concludes that the fuzzy logic theory is an effective and practical tool to find the best code which leads to an economical design. Based on the obtained results, it is clear that the ACI 318-05 and Hong Kong CP04 codes lead to more economical designs for taller buildings. However, for low-rise buildings, the CSA A23.3-04 and ACI 318-05 codes lead to more economical designs. Also, the EUROCODE 2-1992 has the minimum economical design for all the three considered buildings.
7. References
[1] Nilson, Arthur, Darwin David, and Dolan Charles. “Design of concrete structures, Thirteenth Edition” McGraw Hill, New York. (2004).
[2] McCormac, Jack C, and Brown, Russell H. “Design of reinforced concrete, Tenth Edition” John Wiley and Sons, USA. Inc. (2016).
[3] Subramanian, N. “Design of reinforced concrete structures” Oxford University Press, USA. (2014).
[4] Hassoun, M. Nadim, and Al-Manaseer Akthem. “Structural concrete, Theory & Design, Sixth Edition” John Wiley & Sons, Inc., Hoboken, New Jersey. (2015).
[5] Punmia, B.C., Kumar Jain, Ashok. and Kumar Jain, Arun. “Reinforced concrete structures” Laxmi Publication (P) LTD, New Delhi. (1995).
[6] Jahankhani, H., Carlile, A., Emm, D., Hosseinian-Far, A., Brown, G., Sexton, G. and Jamal, A. “Global security, safety, and sustainability: The Security Challenges of the Connected World.” 11th International Conference, ICGS3 2017, London, UK, January 18-20, 2017.
[7] Choi, K.K. “Reinforced concrete structure design assistant tool for beginners.” MS. C thesis, University of Southern California, 2002.
[8] Ebrahimpour Komleh, H. and Maghsoudi, A.A. “Prediction of curvature ductility factor for FRP strengthened RHSC beams using ANFIS and regression models.” Computers & Concrete 16 (September 2015): 399-414. doi: 10.12989/cac.2015.16.3.399.
[9] Gu, ZQ. and Oyadiji, S.O. “Application of MR damper in structural control using ANFIS method.” Computers and Structures 86 (February 2008): 427-436. doi: 10.1016/j.compstruc.2007.02.024.
[10] Cevik, A. “Modeling strength enhancement of FRP confined concrete cylinders using soft computing.” Expert Systems with Applications 38 (May 2011): 5662-5673. doi: 10.1016/j.eswa.2010.10.069.
[11] Amini, J. and Moeini, R. “Prediction of shear strength of reinforced concrete beams using adaptive neuro-fuzzy inference system and artificial neural network.” Scientia Iranica, Transaction A. 19 (April 2012): 242-248. doi: 10.1016/j.scient.2012.02.009. [12] Mashrei, M.A., Seracino, R. and Rahman, M.S. “Application of artificial neural networks to predict the bond strength of FRP-to-concrete joints.” Constructional Building Materials 40, (March 2013): 812-821. doi: 10.1016/j.conbuildmat.2012.11.109. [13] Mohammadhassani, M., Nezamabadi-Pour, H., Jumaat, M., Jameel, M., Hakim, S.J.S. and Zargar, M. “Application of the ANFIS
model in deflection prediction of concrete deep beam.” Structural Engineering and Mechanics 45, (February 2013): 319-332. doi: 10.12989/sem.2013.45.3.323.
[14] Buckley, J.J. and Eslami, E. “Advances in soft computing, an introduction to fuzzy logic and fuzzy sets” Heidelberg, New York, Physica-Verlag. (2002).
[15] Moraga, C. “Introduction to fuzzy logic.” Facta Universitatis: Electronics and Energetics 18, (2005): 319-328. doi: 10.2298/FUEE0502319M.
[16] Melin, P. and Castillo, O. “Adaptive intelligent control of aircraft systems with a hybrid approach combining neural networks, fuzzy logic and fractal theory.” Applied Soft Computing 3, (December 2003): 353-362. doi: 10.1016/j.asoc.2003.05.006.
[17] Das, A., Maiti, J. and Banerjee, R.N. “Process control strategies for a steel making furnace using ANN with bayesian regularization and ANFIS.” Expert Systems with Applications 37, (March 2010): 1075-1085. doi: 10.1016/j.eswa.2009.06.056.
[18] Najafzadeh, M. and Sattar, A.M.A. “Neuro-fuzzy GMDH approach to predict longitudinal dispersion in water networks.” Water Resources Management 29, (May 2015): 2205-2219. doi: 10.1007/s11269-015-0936-8.
[19] Najafzadeh, M. and Lim S.Y. “Application of improved neuro-fuzzy GMDH to predict scour depth at sluice gates.” Earth Science Informatics 8, (March 2015): 187-196. doi: 10.1007/s12145-014-0144-8.
[20] Najafzadeh, M. and Bonakdari, H. “Application of a neuro-fuzzy GMDH model for predicting the velocity at limit of deposition in storm sewers.” Journal of Pipeline Systems Engineering and Practice 8, (February 2017): 1-8. doi: 10.1061/(ASCE)PS.1949-1204.0000249.
[21] Behnood, A., Olek, J. and Glinicki, M.A. “Predicting modulus elasticity of recycled aggregate concrete using M 5′ model tree algorithm.” Construction and Building Materials 94, (September 2015): 137–147. doi: 10.1016/j.conbuildmat.2015.06.055. [22] Mansouri, Iman, Aliakbar Gholampour, Ozgur Kisi, and Togay Ozbakkaloglu. “Evaluation of Peak and Residual Conditions of Actively Confined Concrete Using Neuro-Fuzzy and Neural Computing Techniques.” Neural Computing and Applications 29, no. 3 (July 25, 2016): 873–888. doi:10.1007/s00521-016-2492-4.
[23] Naderpour, H. and Poursaeidi, M.A. “Shear resistance prediction of concrete beams reinforced by FRP bars using artificial neural networks.” Measurement 126, (October 2018): 299-308. doi: 10.1016/j.measurement.2018.05.051.
[24] Stamopoulos, A.G., Tserpes, K.I. and Dentsoras, A.J. “Quality assessment of porous CFRP specimens using X-ray Computed
Tomography data and Artificial Neural Networks.” Composites Structures 192, (May 2018): 327-335. doi: 10.1016/j.compstruct.2018.02.096.
[25] ACI 318-05. “Building code requirements for structural concrete and commentary, ACI Committee 318.” Structural Building Code, American Concrete Institute, Farmington Hills, MI, USA, (2005).
[26] CSA. “Design of concrete structures. CSA standard A23.3-04.” Canadian Standards Association (CSA), Mississauga, Ont, (2004).
[27] Hong Kong CP-04. “Design of concrete structures.” China, (2004).
[28] Eurocode 2. “Design of concrete structures: 1-1: General rules and rules for buildings.” ENV 1992-1-1.22, (1992). [29] Wang, L.X. “Adaptive fuzzy systems and control: Design and stability analysis” Prentice Hall, New York. (1994).
[30] Elsayed, T. “Fuzzy inference system for the risk assessment of liquefied natural gas carriers during loading/offloading at terminals.” Applied Ocean Research 31, (July 2009): 179–185. doi: 10.1016/j.apor.2009.08.004.
[31] Ghasemi, E. and Ataei, M. “Application of fuzzy logic for predicting roof fall rate in coal mines.” Neural Computing and Applications 22, (May 2013): 311–321. doi: 10.1007/s00521-012-0819-3.
[32] Jamshidi, A., Yazdani-Chamzini, A., Yakhchali, S.H. and Khaleghi, S. “Developing a new fuzzy inference system for pipeline risk assessment.” Journal of Loss Prevention in the Process Industries 26, (January 2013): 197–208. doi: 10.1016/j.jlp.2012.10.010. [33] Wong, B.K. and Monaco, J.A. “A bibliography of expert system applications for business (1984–1992).” European Journal of Operational Research 85, (September 1995): 416–432. doi: 10.1016/0377-2217(95)00047-t.
[34] BHRC. “Standard No. 2800 Iranian code of practice for seismic resistant design of buildings” Building and Housing Research Center, Iran. (2014).
![Table 2. The upper and lower bounds of the computed area for rebars of beam’s sections designed by ACI 318-05 [25]](https://thumb-us.123doks.com/thumbv2/123dok_us/9933499.2486221/7.893.100.793.496.746/table-upper-lower-bounds-computed-rebars-sections-designed.webp)


![Table 7. The upper and lower bounds of computed area for rebars of beam’s sections designed by ACI 318-05 [25]](https://thumb-us.123doks.com/thumbv2/123dok_us/9933499.2486221/11.893.84.800.718.1152/table-upper-lower-bounds-computed-rebars-sections-designed.webp)