Model-free inference of direct network interactions
from nonlinear collective dynamics
Jose Casadiego
1,2, Mor Nitzan
3,4,5, Sarah Hallerberg
2,6& Marc Timme
1,2,7,8The topology of interactions in network dynamical systems fundamentally underlies their function. Accelerating technological progress creates massively available data about collec-tive nonlinear dynamics in physical, biological, and technological systems. Detecting direct interaction patterns from those dynamics still constitutes a major open problem. In particular, current nonlinear dynamics approaches mostly require to know a priori a model of the (often high dimensional) system dynamics. Here we develop a model-independent framework for inferring direct interactions solely from recording the nonlinear collective dynamics gener-ated. Introducing an explicit dependency matrix in combination with a block-orthogonal regression algorithm, the approach works reliably across many dynamical regimes, including transient dynamics toward steady states, periodic and non-periodic dynamics, and chaos. Together with its capabilities to reveal network (two point) as well as hypernetwork (e.g., three point) interactions, this framework may thus open up nonlinear dynamics options of inferring direct interaction patterns across systems where no model is known.
DOI: 10.1038/s41467-017-02288-4 OPEN
1Chair for Network Dynamics, Institute for Theoretical Physics and Center for Advancing Electronics Dresden (cfaed), Technical University of Dresden, 01062 Dresden, Germany.2Network Dynamics, Max Planck Institute for Dynamics and Self-Organization (MPIDS), 37077 Goettingen, Germany.3Racah Institute of Physics, The Hebrew University, 9190401 Jerusalem, Israel.4Department of Microbiology and Molecular Genetics, The Hebrew University, 9112001 Jerusalem, Israel.5School of Computer Science, The Hebrew University, 9190401 Jerusalem, Israel.6Fakultät Technik und Informatik, Hamburg University of Applied Sciences, 20099 Hamburg, Germany.7Bernstein Center for Computational Neuroscience (BCCN), 37077 Goettingen, Germany.8Department of Physics, Technical University of Darmstadt, 64289 Darmstadt, Germany. Correspondence and requests for materials should be addressed to
J.C. (email:[email protected]) or to M.T. (email:[email protected])
123456789
T
from regulatory circuits and metabolic systems to communication, distribution, and supply networks8,9 is derived from the direct interactions of their parts. Determining how such systems are connected may help us in understanding and controlling their function10,11. Current nonlinear dynamics approaches may recover direct interactions from the collective dynamics of a system if a mathematical model is provided in advance and only their unknown parameters, network links, and nonlinear terms are to be determined11–19. Such models, how-ever, are usually not at hand under most experimental conditions, thereby constraining the applicability of these methods to a limited number of examples. Recent works20,21 on low-dimensional systems suggest that approximating the dynamics through expansions in basis functions may reveal the interaction patterns, if such dynamics admits a sparse representation in the proposed basis. A more recent model-free approach that takes into account the nonlinear network dynamics requires to exter-nally drive the systems in a controlled way, thus enabling reconstruction from experimental settings for one particular range of settings22. Common model-free approaches not considering the nonlinear system dynamics construct functional links by detecting statistical dependencies (e.g., correlations, mutual information, Granger causality, and extensions thereof)23–31and thus are prone to recover indirect interactions among the units of a network, for instance, due to common external inputs or decorrelating effects induced by other units in the network11,27,28,32–34. Although latest efforts have focused on filtering indirect connections27,28 from pairwise statistical dependencies, recent studies show that these functional links can only match direct connections under specific homogeneity conditions35, which rarely occur in real-world systems.In this article, we propose a novel concept for inferring direct interactions in coupled dynamical systems, relying only on their nonlinear collective dynamics, with neither assuming specific dynamic models to be known in advance nor assuming the dynamics admits a sparse representation, nor imposing controlled drivings, nor expecting statistical dependencies to faithfully reveal direct, physical interactions. To achieve this goal, we here change the perspective and ask which units j of the network provide direct physical interactions to a given unit iand appear on the right hand side of its differential equation, rather than asking for details of the interaction functions among those units. We demonstrate that the problem of inferring direct interactions based on observed nonlinear dynamics may be posed as a mul-tivariate regression problem by introducing an explicit depen-dency matrix and thereby systematically decomposing each units dynamics into pairwise, three-point, and higher-order interac-tions with other units in the network. Such decomposiinterac-tions provide restricting equations for mapping the collective dynamics to direct interactions. We validate and characterize the predictive power of our approach by successfully revealing the structure of generic as well as specific biological model systems. These model systems may exhibit complex noisy dynamics such as transient dynamics toward steady states, periodic and non-periodic dynamics, or chaos, and have standard pairwise as well as hypernetwork (such as three point) interactions. Interaction networks may even be revealed if some units are not measured (and thus hidden during observation).
Results
Mapping time series to direct interactions. To understand which information a time series contains about the direct inter-actions in networks, consider a system whose time evolution is
x¼FðxðtÞÞ þξðtÞ ð1Þ
wherexðtÞ ¼½x1ðtÞ; :::;xNðtÞ2RNis the state of the entire system consisting of units with variables xi(t),x¼dxðtÞ=dt denotes its temporal derivative, ξðtÞ ¼½ξ1ðtÞ;¼;ξNðtÞ 2RN represents external noise acting on the whole system, and F:RN!RN is any smooth, typically nonlinear function that we assume to be unknown. Common examples are the regulation functions in models for gene regulatory networks3,5,7or rate laws in metabolic systems36.
Given a multivariate time series
xi;m:¼xið Þtm ð2Þ recorded at discrete time pointstm=mΔt+t0, system identifica-tion aims to reveal the exact funcidentifica-tional form ofFand to exactly predict the systems future37. Owing to the high dimensionality of most networks, such identification is typically restricted or even impossible. Here we address the problem in a slightly yet essentially different manner, asking only: which of the variablesxj directly acts on a given unitiand thus explicitly appears on the right hand side of Eq. (1)? We aim to reveal not only pairwise network interactions, specified by terms of the form x_i¼:::þ gi
j xj þgiij xi;xj
þ¼; but also higher-order hypernetwork interactions, induced, for instance, by terms of the form xi_ ¼ :::þgi jk xj;xk þgi ijk xi;xj;xk
þ::: where two or more units j andkdifferent thanijointly influence unitidirectly.
To distinguish among units and at the same time treat all orders of interactions simultaneously, we introduce explicit dependency matricesΛi∈{0, 1}N×N, diagonal matrices defined by
Λi jj¼ 0 if ∂Fi ∂xj0 1 if ∂Fi ∂xj≠0 0 @ : ð3Þ
Hence, if a unitjdirectly acts on uniti, we haveΛi
jjequals 1, and Λi
jj equals 0 otherwise. With this notation, the dynamics of the units becomes
_
xi¼fiðΛixðtÞÞ þξiðtÞ; ð4Þ
where fi:RN !R is a smooth function that specifies the deterministic evolution of component iandξiðtÞ 2Rrepresents external noise acting oni.
The explicit dependency matrix Λi selects which variables xj directly control the rate of change of xi, thus going beyond the related graph-theoretical notions of adjacency and incidence matrices and thereby emphasizing aspects of the dynamics:first, it offers a uniform representation of pairwise and higher-order interactions; and second, it is thus suitable for generic dynamical systems representations, as it appears exactly once in the right hand side of Eq. (4).
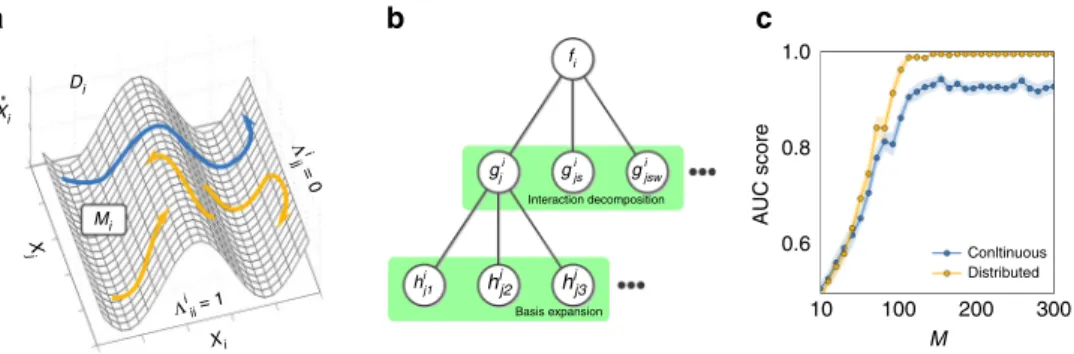
The resulting generic model (Eq. (4)) links state space pointsx (t) at time t to their rate of change x_iðtÞ. In particular, the complemented system state siðtÞ ¼½xðtÞ;xiðtÞ_ 2RNþ1 is an element of a higher-dimensional “dynamics space”Di for eachi formed by the state space and the rate of change of unit i. Therefore, the fi specifying the dynamics defines a smooth manifoldMi Di, with theΛijjindicating whether or notMiis constant in directionxj. cf. Fig.1.
In practical scenarios, the functions fi are generally not accessible. We address this challenge in two stages. First, we functionally decompose the dynamics of unitsi∈{1, 2, ...,N} into
interaction terms with the entire network as _ xi¼fiΛix¼P N j¼1 Λi jjgji xj þ PN j¼1 PN s¼1 Λi jjΛissgjsi xj;xs þPN j¼1 PN s¼1 PN w¼1Λ i jjΛissΛiwwgjswi xj;xs;xw þ¼ þξi; ð5Þ
where gji:R!R, gjsi :R2!R, gjswi :R3!R and, in general gi
j1j2¼jK:R
K !R, represent the (unknown) K-th order interac-tions between units jk for all k∈{1, 2, …, K} and unit i. Specifically, the decomposition (Eq. (5)) separates contributions to unit iarising from different orders, e.g., pairwise and higher-order interactions with other units in the system. The Λi are defined such that, ifΛi
rr0, all functionsgji1;j2;:::;jKwith any of the indices jk=rdisappear from the right hand side of Eq. (5).
Given that functionsgi
j1;j2;:::;jKare taken to not be accessible, we decompose eachgi
j1;j2;:::;jK into basis functionshas
_ xi¼PN j¼1Λ i jj PP1 p¼1 ci j;phj;p xj þ PN j¼1 PN s¼1Λ i jjΛiss PP2 p¼1 ci js;phjs;p xj;xs þPN j¼1 PN s¼1 PN w¼1 Λi jjΛissΛiww PP3 p¼1 ci jsw;phjsw;p xj;xs;xw þ¼ þξi; ð6Þ wherePkindicates the number of basis functions employed in the expansion, c.f. ref.38. Thus, provided a time series (2) whereΔtis sufficiently small such as to reliably estimate time derivativesxi_;m, revealing direct interactions becomes identifying the non-zero coefficients in the right hand side of Eq. (6) that best fit the estimatedxi_;m. Such expansions (Eq. (6)) differ qualitatively from those developed in refs. 15,16,18,20 since ours do neither require the functions gi
j1;j2;:::;jK to be represented exactly by the basis functions chosen nor the condition to admit a sparse representa-tion in the basis. Instead, we only require the funcrepresenta-tionshto form any basis of a relevant function space, thereby additionally allowing the investigator to choose basis functions not appearing explicitly in any of theg:i. In particular, this reduced requirement implies that, for instance, all coefficients ci
j;p0 are (indis-tinguishable from) zero for all p if there is no functional dependencygi
j xj ¼ P
pcij;phj;pðxjÞ 0.
This weaker requirement is sufficient to impose a structure of blocks of zero and non-zero coefficients in Eq. (6), representing absent and existing interactions, respectively, thereby posing a
mathematical regression problem with grouped variables38–42. To solve such structured problems, we developed the Algorithm for Revealing Network Interactions (ARNI) (Supplementary Note1), a greedy approach based on the Block Orthogonal Least Squares (BOLS) algorithm40. Specifically, our approach takes the time series of all units in the network as inputs and returns a ranked list of interactions indicating the order in which interactions in the right hand side of Eq. (6) were identified as most strongly
lowering a cost function (see text below and Supplementary Note 1/Supplementary Fig.3). We remark that here we do not intend to recover the actual functional form of interactions, but instead we aim at determining the existence or absence of interactions between units. So, even if our scheme infers an optimal model from a given time series, it is not guaranteed that such a model would agree with an actual model generating the dynamics43. Indeed, the fact that we only ask for the units interacting with a given unit and not for details of the coupling functions enables robust performance across systems (compare Figs.1,2,3,4,5, and6).
Revealing direct links in model systems. To demonstrate the robustness of our approach, we inferred the interactions of model systems and compared our results to those obtained from thresholding correlations11,44, partial correlations45, and transfer entropy46. In particular, we have selected such quantities because they are model independent, and they have been traditionally used to quantify interactions in networked systems. We tested our framework on systems displaying diverse types of collective dynamics, such as transient dynamics toward steady states, non-periodic dynamics, and chaotic and noisy dynamics, as emerging in models of Michaelis Menten kinetics in gene regulation, gen-eric heteroclinic, and gengen-eric chaotic oscillatory dynamics. We measured the quality of reconstruction in terms of area under the receiver-operating-characteristic curve (AUC) score (Supple-mentary Note 3). The AUC score equals 1 for perfect recon-struction and it equals 1/2 for predictions equivalent to random guessing.
Predictions improve with longer time series as well as by composing one long time series out of different short ones, as illustrated for non-periodic dynamics in Fig. 1c. This indicates that sampling sufficient parts of state space is essential for revealing direct network interactions. Generally, we found that if long time series are not available (or not preferred, see the following), compositions of short time series are at least equally
Xi Xi Di Mi X j 1.0 f i gji hi j1 gi js g i jsw hij2 h i j3 0.8 AUC score 0.6 Interaction decomposition Basis expansion Λi jj = 0 Λi ii = 1 10 100 200 Conltinuous Distributed 300 M a b c
Fig. 1Sampling dynamics spaces to reveal network structure.aEq. (4) determines a mapping from state space componentsxto rates of changex_i, defining
a smooth manifoldMi(in dynamics spaceDi) determined byfiandΛi.bTwo-stage decomposition of unknown functionsfi,first into interactions of
different orders with other units in the network, second each interaction into basis functions, thereby resulting in a linear system (Eq. (6)) restricting the
connectivity structure.cQuality of inferences versus the numberMof measurements (displayed here for non-periodic dynamics of networks of
phase-coupled oscillators ofN=20 andni=10 incoming connections per unit).“Continuous sampling”takes as observed dynamics one long trajectory ofM
sample time steps;“distributed sampling”takesM/mshort time series ofm=10 sample time steps starting from different initial conditions, creating a
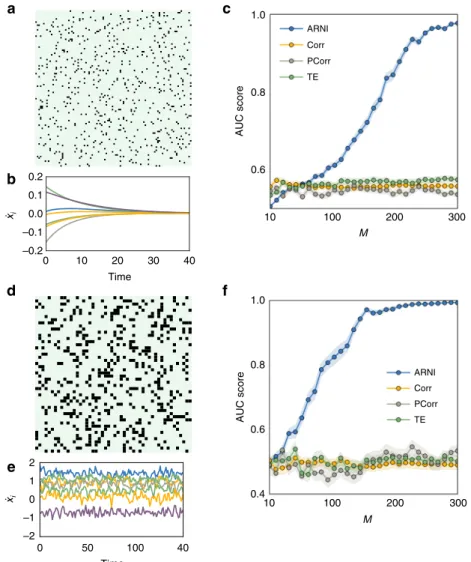
appropriate for reconstruction, see, e.g., Fig. 1c. Exemplary tests demonstrate that even time series as short as m=5 time points recorded from dynamics from different trajectories evolving toward a steady state might be sufficient. Moreover, reconstruc-tion quality improves with the total number of available recordingsM=S×m whereSis the number of experiments, in contrast to inferences from thresholding correlations, partial correlations, and transfer entropy, which cannot predict existing interactions under these minimal sampling conditions (Fig.2a–c).
Moreover, inference studies on collections of short time series extracted from non-periodic dynamics further confirms that larger numbers M=S×m of recordings improve quality (as expected). Again, correlations, partial correlations, and transfer entropy are in general less capable of capturing the intrinsic structure of interactions under equally minimal conditions (Fig. 2d–f). Finally, interactions may still be
recovered in networks of higher-dimensional units by extending Eq. (5) to include all componentsxd
iðtÞofi∈{1, 2,…,N}, where d∈{1, 2,…,Di} andDiis the number of components of unit i, Fig.3a–c.
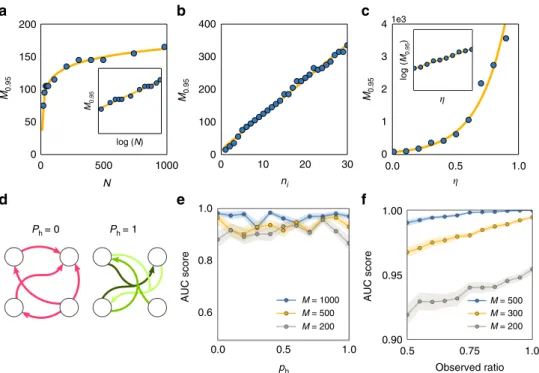
Performance. To further characterize the performance of our approach, we carried out systematic reconstructions of various networks of different sizes, numbers of incoming connections per unit, noise levels, fraction of higher-order (hypernetwork) inter-actions, and number of hidden units (Fig. 4). We report four classes of results. First, the number Mθof time points necessary
for AUC scores larger than a thresholdθscales sublinearly with the size of the network, Fig.4a, and linearly with the number of incoming connections per unit, Fig. 4b. Moreover, inferring the incoming connections of single units in large sparse networks (N
=1000, ni=10) in conventional hardware (Intel® CoreTM i5-2430M) takes 65±26 s per unit. Such results highlight the potential applicability of our approach in combination with parallel computing for revealing interactions in real-world net-works, which are often large in size and sparsely connected. Second, Mθ depends supralinearly on the noise level η, Fig. 4c.
Here, sampling longer time series (more data) improves recon-struction quality. These results indicate that inference is still viable for highly noisy dynamics at the expense of recording longer time series. Third, systematic reconstructions of
0.2 0.1 0 10 20 30 40 Time 0.0 –0.1 –0.2 xi xi 2 1 0 50 100 40 Time 0 –1 –2 10 ARNI Corr PCorr TE 0.8 0.6 AUC score 100 M 200 300 10 1.0 ARNI Corr PCorr TE 0.8 0.6 0.4 AUC score 100 M 200 300 b d e f
Fig. 2Inferring interactions from transients to steady state and from non-periodic dynamics. We simulated short transient time series ofm=5 time points
starting from different initial conditions and created composite longer time series as in Fig.1. ThusM=S×m, whereSis the number of distinct transient
dynamics.a–cRevealing interactions from transients toward steady state.aAdjacency matrix of a network ofN=100 units under Michaelis–Menten
kinetics withni=10 incoming connections.bExample of transient dynamics toward steady states, wherex_j¼0 for allj∈{1, 2, ...,N}.cQuality of
inferences with respect toMusing our approach (ARNI), correlations (Corr), partial correlations (PCorr), and transfer entropy (TE).d–fRevealing
interactions from non-periodic dynamics.dAdjacency matrix of a network ofN=50 phase-coupled oscillators withni=10 incoming connections (black
hypernetwork interactions in exemplary models of phase-coupled oscillators (Supplementary Note 4) suggest that our results are independent of the probability of having hypernetwork interac-tionsph, Fig.4d, e. This is a consequence of treating pairwise and higher-order interactions equally, by decomposing the coupling into orders of jointly acting units via explicit dependency matrices (Eq. (3)). Thus the approach is insensitive to the appearance of higher-order interactions. Finally, even if some units of the net-work are not measured (hidden units), existing and non-existing links among measured units may still be reliably inferred, Fig.4f. To compute AUC scores, we compare our predictions for the existence and absence of links among the measured units with those actually existing and not existing among those units, making no statement about indirect interactions mediated by hidden units. As more units are hidden, the quality of recon-struction decreases because the hidden units act upon the mea-sured units in an unknown way. Still, sampling longer time series again improves reconstruction quality. Thereby, the model-free approach provides accurate predictions even if only a fraction of the network is recorded.
Proper basis functions and learning curves. Selecting an appropriate class of basis functions to represent the network interactions in system (Eq. (6)) is vital for any such approach. Choosing basis functions that capture the intrinsic nature of interactions (e.g., h(xi), h(xi, xj), h(xi, xj, xw), and so on) by construction yields optimal results. However, to exactly pick the correct interaction function requires prior knowledge of the potential functions involved in coupling units of the system under consideration. To overcome this limitation, we aim at appropriate classes of coupling functions only but do not require to pick a correct function (that would enable prediction of time series). While the former implies tofind basis functions of correct order, the latter implies tofind a unique set of basis functions capable of fitting the recorded dynamics (see below for further con-sequences). We remark that a particularly chosen basis function constitutes a representative of an entire class of appropriate functions. For instance, the functions indexeda–din Table1are all equally appropriate representatives of the class of pairwise functionsgi
ij xi;xj
, Fig.5.
We investigated the effects of selecting different basis functions. For the example shown in Fig.5, we studied networks of phase-coupled oscillators and divided the time series in a training set (60% of time points) for inferring interactions and a validation set (40% of time points) for evaluating the predictions;
we tracked the evolution of afitting cost function with respect to the l-th discovered interaction. Specifically, the fitting cost function is defined as CiðlÞ:¼ 1 Ms XMs m¼1 _ xi;mbxi_;mðlÞ 2 ; ð7Þ
whereMsis the number of time points in the set andbxi_;mðlÞ 2R is the prediction by our approach of a computedxi_;m using the inferred interactions up to thel-th discovered interaction.
The functional forms of the cost functionCi(l), depending on the number l of interactions considered, are either L-shaped, indicating the number of incoming connections at the kneel* of the L (basis functionsa–dof Table1, Fig.5a–d), or not, thereby
not revealing any features of the network (basis functionseandf of Table 1, Fig. 5e, f). Simultaneously to reveal the number of incoming connections, the first l* interactions actually chosen provide the full information about which unitsjdirectly act on unit i. We remark that, for sufficiently short sampling intervals, both the time derivative xi_;m as well as its estimator bxi_;m are obtainable from recorded dynamics data without any model assumption.
Thesefindings confirm that basis functions that merely capture the essential structure of the interactions but not necessarily exactly represent the full dynamics are sufficient to reveal network connectivity. As a consequence, reconstruction of direct network interactions is possible without preknowlegde about a system model.
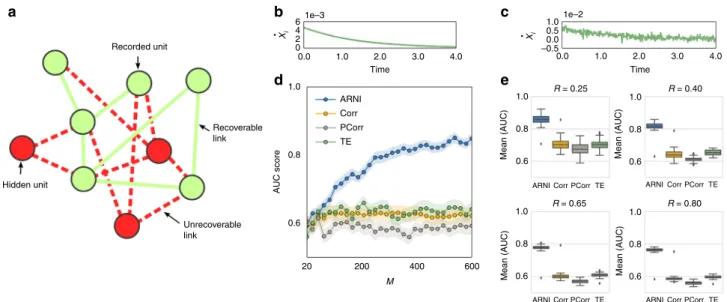
Effects of noise and hidden units. In experimentally relevant biological settings, there may be several uncontrolled factors affecting the recorded time series. For instance, in gene networks, noisy dynamics is simultaneously present at several different levels (e.g., gene-intrinsic, network intrinsic, and cell-intrinsic)2. Fundamentally, noise complicates the inference process by cor-rupting measurements of units dynamics, thereby masking net-work interactions. Moreover, one may not have complete access to measure all units in the network. This may induce correlating or decorrelating effects among units, thus promoting the recovery of indirect interactions34,47.
To test the robustness of our approach against the combination of both noise and hidden units, we simulated transients toward steady states under the external influence of Gaussian noise and recorded the dynamics of only a subset of randomly selected units in the network. Results indicate that both noise and hidden units
7 4 5 2 9 6 12 1 3 10 16 20 13 14 19 11 8 17 15 18 –5 0 5 –5 0 5 0 2 3 1 1 0 –1 0 100 200 50 1.0 ARNI Corr PCorr TE 0.8 0.6 0.4 AUC score 250 500 M 750 1000 Time Xi a b c
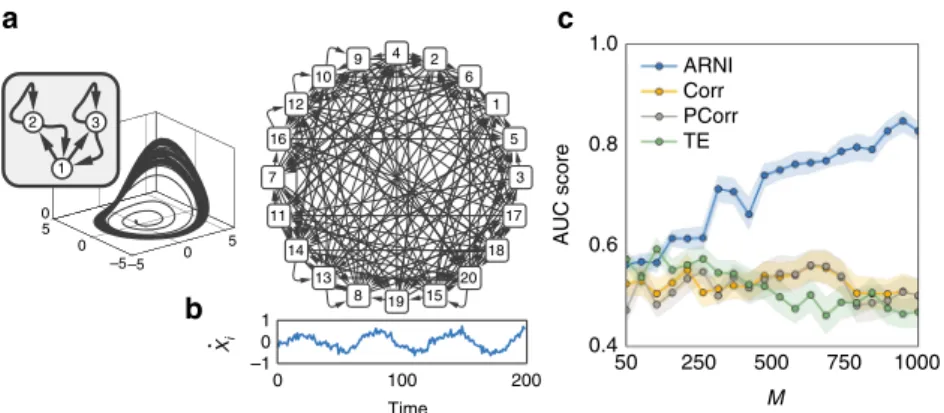
Fig. 3Inferring interactions from noisy and chaotic dynamics. Reconstruction of chaotic oscillator networks ofN=20 andni=5 incoming interactions.a
Rössler oscillators themselves constitute subnetworks of three interconnected units.bExample of noisy derivatives in a Rössler oscillator.cQuality of
reconstruction from transient trajectories with respect toM=S×mwithm=10, using our approach (ARNI), correlations (Corr), partial correlations
moderately reduce the performance of our approach, Fig. 6. However, the inference quality still increases withM, Fig.6d, such that larger sampling collections may still reveal interaction topology. Moreover, systematic reconstructions of different sets of recorded units indicate that our predictions generally outper-form those extracted from correlations, partial correlations, and transfer entropy.
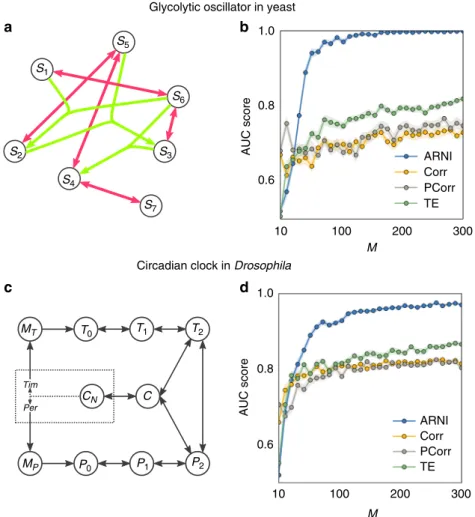
Robust inference of biological networks. Next we establish the potential of our framework to reconstruct interactions for bio-logical system settings. Specifically, we demonstrate results on two networked model biological systems: glycolytic oscillator in yeast48 and circadian clock in Drosophila49. The glycolytic oscillator, exhibiting one of the classical examples for cellular oscillations, accounts for the main reactions of glycolysis. Here we
200 d e f 400 1.0 1.00 0.95 0.90 0.8
AUC score AUC score 0.6 0.0 0.5 0.5 Observed ratio 0.75 1.0 M = 1000 M = 500 M = 200 M = 500 M = 300 M = 200 1.0 ph Ph = 1 Ph = 0 4 3 2 1 0 300 200 100 0 0 10 20 30 0.0 0.5 1.0 ni 150 M0.95 M0.95 M0.95 M0.95 100 50 0 0 500 log (N) log ( M0.95 ) 1000 N
Fig. 4Performance on networks and hypernetworks.aMinimum lengthM0.95of time series required for achieving AUC score>0.95 versus the number of
unitsNwith a logarithmicfit. The inset shows the same data withNon logarithmic scale. The number of incoming interactionsni=10 wasfixed for all
networks.bM0.95versusniwith a linearfit, for networks offixed sizeN=50.cM0.95versus standard deviation of noise levelηwith a exponentialfit. The
inset shows the same data withM0.95on logarithmic scale.dCartoon of networks withph=0 andph=1.eSystematic reconstructions of hypernetworks of
N=20 phase-coupled oscillators for varyingph∈[0, 1] andM∈{200, 500, 1000} andfixedni=5.fSystematic reconstructions of networks ofN=20 (ni
=10) units versus the fraction of observed (non-hidden) units
6 1e–2
Appropriate bases Inappropriate bases
1e–2 1e–2 4 2 0 0 5 10 15 20 l 6 1e–2 4 2 0 0 5 10 15 20 l 6 1e–2 4 2 0 0 5 10 15 20 l 6 1e–2 4 2 0 0 5 10 15 20 l 6 4 2 0 0 5 10 15 20 l 6 4 Ci ( l ) Ci ( l ) Ci ( l ) Ci ( l ) Ci ( l ) Ci ( l ) 2 0 0 5 10 15 20 Training Validation l a b c d e f
Fig. 5Learning curves with respect to the number of iterationslreveal appropriate expansions.a–fLearning curves for basis functions shown in Table1;
indices in Table1equal panel identification. The training and validation sets are composed by the 60 and 40% of recordings, respectively. For all basis
functionsa–dchosen from an appropriate class (here: true pairwise interactions), the curve exhibits an L-shape with a clear plateau starting at the correct
number of incoming interactions (vertical dashed line), above adding more interactions reduces thefitting costs only weakly or not at all. If basis functions
focus on a model for anaerobic glycolytic oscillations in yeast, containing the influx of glucose and outflux of pyruvate and/or acetaldehyde48 (see Supplementary Note 5 for an extended description). The circadian clock underlies the biological response to the day–night cycle, and the oscillations it exhibits in Droso-philaare driven by a negative feedback between two genes and the complex that is formed by the proteins they code for. The model equations for the circadian clock are based on ref. 49 (see Sup-plementary Note5).
Employing the above approach of combining a dynamics space representation, expanding in suitable families of basis functions, and solving the resulting linear regression problem by an orthogonal least squares method, we reconstructed the interac-tions between the different components of the glycolytic oscillator (Fig. 7a, b) and the circadian clock (Fig. 7c, d) from transient dynamics toward their periodic orbits. As for the other systems’ settings, the results confirm that larger numberMof observations improve the predictions. Moreover, the reconstruction quality by this method again outperforms those resulting from correlations, partial correlations, and transfer entropy.
Discussion
We proposed a model-free framework for inferring direct inter-action networks from only the time series of collective nonlinear system dynamics. First, defining the notion of explicit depen-dency matrices enabled us to systematically decompose each units’ dynamics into pairwise, three-point, and higher-order interactions and at the same time treat present influences from one unit to another on the same footing independently of the interaction order. Second, by capturing the structure (but not necessarily the exact functional form) of the dynamical influences through appropriately chosen basis functions, we posed the reconstruction problem based on nonlinear dynamics as a mathematical regression problem with grouped variables. Given that the reconstructions of the sets of incoming connections to different units of the network are mathematically independent (despite using overlapping recorded dynamical data), the frame-work is scalable (see Supplementary Note2) and computationally parallelizable for large networks. Reconstruction is robust across a wide range of dynamical regimes, combined pairwise and hypernetwork interactions, noise, and hidden units.
The main advantage of our framework is its minimal sampling conditions. For instance, in systems during transients to steady states (such as in gene regulation3,5,7) or periodic orbits (such as in glycolytic oscillations48), we reconstructed direct interactions without the need to know the actual strength or actual distributed patterns of perturbations from those states. In contrast to several previous studies1,11,13,49, our framework in general does not require to apply external driving signals and if a system is externally driven, e.g., to create transients, these signals need not be controlled; thus our framework might be suitable for systems not easily accessible for controlled driving or external driving at all. Moreover, collections of very short time series, in practice potentially resulting from different experiments on the same system, are sufficient for reconstruction. In particular, collective dynamics that is transient, stochastically driven, or otherwise sufficiently complex helps revealing interactions, whereas certain stable dynamics on low-dimensional subsets of state space only sample limited regions of the dynamics space and thus in Recorded unit 61e–3 1e–2 Xi 1.0 0.5 0.0 –0.5 1.0 0.8 Mean (AUC) 0.6 1.0 0.8 Mean (AUC) 0.6
ARNI Corr PCorr TE
1.0
0.8
Mean (AUC) 0.6
ARNI Corr PCorr TE
ARNI Corr PCorr TE
1.0
0.8
Mean (AUC) 0.6
ARNI Corr PCorr TE
0.0 R = 0.25 R = 0.65 R = 0.40 R = 0.80 2.0 3.0 4.0 Time 1.0 4 2 0 0.0 1.0 1.0 0.8 0.6 20 200 400 600 M AUC score 2.0 3.0 4.0 Time ARNI Corr TE PCorr Recoverable link Unrecoverable link Hidden unit Xi a b c d e
Fig. 6Reconstructions are still viable if units are hidden and measurements are noisy. Revealing direct interactions within a subset of units from noisy
transients toward steady states. The network size isfixed atN=100.aRepresentation of a network with a subset of measured units (green) and a subset
of hidden units (red).b,cx_iin noise-free and noisy transients.dQuality of reconstruction versus number of measurements employing our approach
(ARNI), correlations (Corr), partial correlations (PCorr), and transfer entropy (TE) on a subset of 40 (randomly selected) recorded units.eSystematic
reconstruction over different collections of subsets. The variableRindicates the fraction of recorded units. Averages over 50 random subsets ofR<1
indicate that our approach outperforms correlations, partial correlations, and transfer entropy across differentRvalues
Table 1 Interactions may be represented in different basis functions
Index Basis function
a hi ij;pðxi;xjÞ ¼ ðxjxiÞp b hi ij;p1p2ðxi;xjÞ ¼x p1 ixp 2 j c hi
ij;pðxi;xjÞ ¼sin p xððjxiÞÞandhiij;pðxi;xjÞ ¼cos p xððjxiÞÞ
d hi
ij;pðxi;xjÞ ¼1þxijxij;p
2
;xij¼ðxi;xjÞandxij;p¼ xi;p;xj;p
e hi
j;pðxjÞ ¼xpj
f hi
j;pðxjÞ ¼sin pxð Þj andhij;pðxjÞ ¼cos pxð Þj
Different basis functions can be employed to represent a specific interaction. Basis functions of correct order are more likely to reveal true interactions than functions of incorrect order (see also Supplementary Note6), Fig.5. Basis functiondbelongs to a class of radial basis functions, soxij,prepresent thep-th center of the expansion56
principle do not provide full information about network inter-actions. Lower-dimensional dynamics may in particular be induced by symmetries or other invariants represented by alge-braic conditions, such as z(x)=0. For instance, in systems evol-ving in synchronized states, the existence and directionality of interactions are impossible to extract from time series32. Fur-thermore, the number of independent measurements required for successful reconstruction grows linearly with the local number of interaction partners and sublinearly with the number of units in the network, providing an advantage for reconstructing large systems. As we illustrated by examples, our framework may be easily combined with learning curves derivable from recorded data only and thus enables researchers to determine the accuracy of inferences when there is no ground truth available.
Previous studies on inferring the direct interaction structure from time series have focused on the reconstruction of networks with known local dynamics and coupling functions11,12,14–18. Such prior knowledge reduces the task to a standard linear algebra problem, where one has to solve linear systems of equa-tions to reveal the network connecequa-tions, cf. ref.11for a compre-hensive review. Recent work on low-dimensional dynamical systems20, based on expanding the system dynamics in basis functions, requires the dynamics to admit a sparse representation in the proposed basis. Moreover, a work21applying an extension of the method described in ref.20on models for gene regulation also suggests that such approaches scale supralinearly with the dimensionality of the network for both the number of candidate coupling functions and the time points necessary for successful
reconstruction. The theory presented above does neither require prior knowledge of parameters and coupling functions involved in the network dynamics nor does it require these functions to admit a sparse representations in any basis chosen; it is not limited to low-dimensional networked systems, also because the number of necessary time points for successful reconstruction scales sublinearly with network size.
Taken together, this model-free, robust framework can be based on collections of short time series, noisy data, partially inaccessible units, and essentially arbitrary nonlinear dynamics and may thus enable the reconstruction of direct interaction networks from dynamical data from a new range of times series from coupled dynamical systems where no model is known.
Methods
Overview. To generate dynamical trajectories displaying transients toward steady states, we simulated dynamical systems employing Michaelis–Menten kinetics (Supplementary Note4), systems frequently used to model gene regulation3,5,27. To generate dynamical trajectories exhibiting transients to periodic dynamics, we employed two biological model systems: (i) glycolytic oscillations in yeast48and circadian clock inDrosophila49(Supplementary Note5), which possess hyper-network interactions, where two units jointly and directly influence a third such that their interaction function cannot be disentangled into sums of pairwise interactions. To study the effects of non-periodicity, we simulated networks of phase-coupled oscillators (Supplementary Note4) whose coupling stems from a simple model of weakly coupled populations of biological neurons51–54. Finally, to test robustness against chaos and noise, we simulated networks of noisy and asynchronous Rössler oscillators (Supplementary Note4), prototypical systems for studying chaos55.
Circadian clock in Drosophila
Per Tim S1 S5 S6 S3 S7 T0 P0 P1 P2 T1 T2 C MT MP CN S4 S2 1.0 1.0 0.8 AUC score 0.6 10 100 200 ARNI Corr PCorr TE 300 M 0.8 AUC score 0.6 10 100 200 ARNI Corr PCorr TE 300 M a b c d
Fig. 7Reconstructing biological model systems.a–cRevealing interactions of glycolytic oscillator in yeast.aGlycolytic oscillator network, red and green
links represent network and hypernetwork interactions, respectively.bQuality of reconstruction from transient trajectories as a function ofM=S×mwith
In what follows, we provide a brief description of each model (see Supplementary Notes4and5for further details).
Gene regulatory circuits. To simulate systems mimicking gene regulation, we simulated networks of dynamical systems having Michaelis–Menten kinetics3,27
_ xi¼ xiþ 1 ni XN j¼1 Jij xj 1þxjþξi; ð8Þ
havingnirandomly-selected incoming connections per node. HereJijofJ2RN´N represents a weighted and directed link from unitjtoi.
Networks and hypernetworks of phase-coupled oscillators. To generate non-periodic dynamics, we simulated a model52of phase-coupled oscillators with coupling functions having two Fourier modes
_ xi¼ωiþ 1 ni XN j¼1 Jij sinxjxi1:05 þ0:33 sin 2xjxi þξi; ð9Þ
with constant natural frequenciesωi.
We extended this model to hypernetworks of the form
_ xi¼ωiþ 1 ni XN j¼1 XN k¼1 Ei jksinxjxk1:05 þ0:33 sin 2xjxk þξi: ð10Þ
Differently from (Eq. (9)), here we introduce the second-order interaction matrixEi2RN´Nfor alli={1, 2,…,N}. Specifically, the elementEi
jkquantify how strongly unitsjandkjointly and directly influence uniti.
Networks of Rössler oscillators. To generate chaotic dynamics, we simulated networks of coupled Rössler oscillators55. The dynamics of each oscillatorx
i¼
x1
i;x2i;x3i
2R3is set by three differential equations _ x1 i¼ x2ix3iþ 1 ni XN j¼1 Jijsin x1j þξ1i; ð11Þ _ xi2¼xi1þ0:1x2iþξ2i; ð12Þ _ xi3¼0:1þxi3xi118:0 þξ3 i; ð13Þ whereξk
i withk∈{1, 2, 3} represent external noisy signals acting on the unit’s components.
Glycolytic oscillator model. To test performance on biological model systems, we first simulated the glycolytic oscillator defined as48
_ S1¼J0 k1S1S6 1þ ðS6=K1Þq ð14Þ _ S2¼2 k1S1S6 1þ ðS6=K1Þq k2S2ðNS5Þ k6S2S5 ð15Þ _ S3¼k2S2ðNS5Þ k3S3ðAS6Þ ð16Þ _ S4¼k3S3ðAS6Þ k4S4S5κðS4S7Þ ð17Þ _ S5¼k2S2ðNS5Þ k4S4S5k6S2S5 ð18Þ _ S6¼ 2 k1S1S6 1þ ðS6=K1Þqþ 2k3S3ðAS6Þ k5S6 ð19Þ _ S7¼ψκðS4S7Þ kS7 ð20Þ
whereS1represents the concentration of glucose,S2that of
glyceraldehydes-3-phosphate and dihydroxyacetone glyceraldehydes-3-phosphate pool,S3that of 1,
3-bispho-sphoglycerate,S4that of cytosolic pyruvate and acetaldehyde pool,S5that of
NADH,S6that of ATP, andS7that of extracellular pyruvate and the acetaldehyde
pool.
Circadian clock. A second biological model system we have studied is the circadian clock, underlying the response to the day–night cycle. It is defined as49:
_ Mp¼vsP K n IP Kn IPþCnN vmP MP KmPþMP kdMP ð21Þ _ P0¼ksPMPV1p P0 K1PþP0þ V2p P1 K2PþP1 kdP0 ð22Þ _ P1¼V1p P0 K1PþP0 V2p P1 K2PþP1 V3p P1 K3PþP1þ V4p P2 K4PþP2 kdP1 ð23Þ _ P2¼V3P P1 K3PþP1 V4p P2 K4PþP2 k3P2T2þk4CvdP P2 KdPþP2 kdP2 ð24Þ _ MT¼vsT Kn IT Kn ITþCnN vmT MT KmTþMT kdMT ð25Þ _ T0¼ksTMTV1T T0 K1TþT0þV2T T1 K2TþT1kdTo ð26Þ _ T1¼V1T T0 K1TþT0 V2T T1 K2TþT1 V3T T1 K3TþT1þ V4T T2 K4TþT2 kdT1 ð27Þ _ T2¼V3T T1 K3TþT1 V4T T2 K4TþT2 k3P2T2þk4CVdT T2 KdTþT2 kdT2 ð28Þ _ C¼k3P2T2k4Ck1Ck2CNkdCC ð29Þ _ CN¼k1Ck2CNkdNCN ð30Þ whereMTandMParetimandpermRNAs, respectively.T0,T1, andT2are forms of
the TIM protein,P0,P1, andP2are forms of the PER protein, andCandCNare forms of the PER–TIM complex.
Data availability. All data reported in this study are available from the corre-sponding authors upon request. Example codes for simulating and reconstructing network dynamical systems may be found athttps://github.com/networkinference/ ARNI.
Received: 16 March 2017 Accepted: 17 November 2017
References
1. Gardner, T. S., di Bernardo, D., Lorenz, D. & Collins, J. J. Inferring genetic networks and identifying compound mode of action via expression profiling.
Science301, 102–105 (2003).
2. Kaern, M., Elston, T. C., Blake, W. J. & Collins, J. J. Stochasticity in gene expression: from theories to phenotypes.Nat. Rev. Genet.6, 451–464 (2005). 3. Karlebach, G. & Shamir, R. Modelling and analysis of gene regulatory networks.
Nat. Rev. Mol. Cell Biol.9, 770–780 (2008).
4. Fujita, A. et al. Modeling nonlinear gene regulatory networks from time series gene expression data.J. Bioinform. Comput. Biol.6, 961–979 (2008). 5. Marbach, D. et al. Revealing strengths and weaknesses of methods for gene
network inference.Proc. Natl. Acad. Sci. USA107, 6286–6291 (2010). 6. Bar-Joseph, Z., Gitter, A. & Simon, I. Studying and modelling dynamic
biological processes using time-series gene expression data.Nat. Rev. Genet.13, 552–564 (2012).
7. Marbach, D. et al. Wisdom of crowds for robust gene network inference.Nat. Methods9, 796–804 (2012).
8. Ronellenfitsch, H., Lasser, J., Daly, D. C. & Katifori, E. Topological phenotypes constitute a new dimension in the phenotypic space of leaf venation networks.
PLoS Comput. Biol.11, e1004680 (2015).
9. Kirst, C., Timme, M. & Battaglia, D. Dynamic information routing in complex networks.Nat. Commun.7, 11061 (2016).
10. Cornelius, S. P., Kath, W. L. & Motter, A. E. Realistic control of network dynamics.Nat. Commun.4, 1942 (2013).
introduction.J. Phys. A Math. Theor.47, 343001 (2014).
12. Yu, D., Righero, M. & Kocarev, L. Estimating topology of networks.Phys. Rev. Lett.97, 188701 (2006).
13. Timme, M. Revealing network connectivity from response dynamics.Phys. Rev. Lett.98, 224101 (2007).
14. Shandilya, S. G. & Timme, M. Inferring network topology from complex dynamics.New J. Phys.13, 013004 (2011).
15. Wang, W.-X., Yang, R., Lai, Y.-C., Kovanis, V. & Harrison, M. A. F. Time-series based prediction of complex oscillator networks via compressive sensing.
Europhys. Lett.94, 48006 (2011).
16. Wang, W. X., Yang, R., Lai, Y. C., Kovanis, V. & Grebogi, C. Predicting catastrophes in nonlinear dynamical systems by compressive sensing.Phys. Rev. Lett.106, 154101 (2011).
17. Han, X., Shen, Z., Wang, W. X. & Di, Z. Robust reconstruction of complex networks from sparse data.Phys. Rev. Lett.114, 028701 (2015).
18. Wang, W.-X., Lai, Y.-C. & Grebogi, C. Data based identification and prediction of nonlinear and complex dynamical systems.Phys. Rep.644, 1–76 (2016). 19. Liu, Y.-Y. & Barabási, A.-L. Control principles of complex systems.Rev. Mod.
Phys.88, 035006 (2016).
20. Brunton, S. L., Proctor, J. L. & Kutz, J. N. Discovering governing equations from data by sparse identification of nonlinear dynamical systems.Proc. Natl. Acad. Sci. USA113, 3932–3937 (2016).
21. Mangan, N. M., Brunton, S. L., Proctor, J. L. & Kutz, J. N. Inferring biological networks by sparse identification of nonlinear dynamics.IEEE Trans. Mol. Biol. Multiscale Commun.2, 52–63 (2016).
22. Nitzan, M., Casadiego, J. & Timme, M. Revealing physical interaction networks from statistics of collective dynamics.Sci. Adv. 3 e1600396 (2017).
23. Granger, C. W. J. Investigating causal relations by econometric models and cross-spectral methods.Econometrica37, 424–438 (1969).
24. Ren, J., Wang, W. X., Li, B. & Lai, Y. C. Noise bridges dynamical correlation and topology in coupled oscillator networks.Phys. Rev. Lett.104, 058701 (2010).
25. Quinn, C. J., Coleman, T. P., Kiyavash, N. & Hatsopoulos, N. G. Estimating the directed information to infer causal relationships in ensemble neural spike train recordings.J. Comput. Neurosci.30, 17–44 (2011).
26. Friston, K. J. Functional and effective connectivity: a review.Brain Connect.1, 13–36 (2011).
27. Barzel, B. & Barabási, A.-L. Network link prediction by global silencing of indirect correlations.Nat. Biotechnol.31, 720–725 (2013).
28. Feizi, S., Marbach, D., Médard, M. & Kellis, M. Network deconvolution as a general method to distinguish direct dependencies in networks.Nat. Biotechnol. 31, 726–733 (2013).
29. Guo, X., Zhang, Y., Hu, W., Tan, H. & Wang, X. Inferring nonlinear gene regulatory networks from gene expression data based on distance correlation.
PLoS One.9, e87446 (2014).
30. Tirabassi, G., Sevilla-Escoboza, R., Buldú, J. M. & Masoller, C. Inferring the connectivity of coupled oscillators from time-series statistical similarity analysis.Sci. Rep.5, 10829 (2015).
31. Ching, E. S. C. & Tam, H. C. Reconstructing links in directed networks from noisy dynamics.Phys. Rev. E95, 010301 (2017).
32. Paluš, M. & Vejmelka, M. Directionality of coupling from bivariate time series: How to avoid false causalities and missed connections.Phys. Rev. E75, 056211 (2007).
33. Nawrath, J. et al. Distinguishing direct from indirect interactions in oscillatory networks with multiple time scales.Phys. Rev. Lett.104, 38701 (2010). 34. Zou, Y., Romano, M. C., Thiel, M., Marwan, N. & Kurths, J. Inferring indirect
coupling by means of recurrences.Int. J. Bifurc. Chaos21, 1099–1111 (2011). 35. Lin, W., Wang, Y., Ying, H., Lai, Y. C. & Wang, X. Consistency between
functional and structural networks of coupled nonlinear oscillators.Phys. Rev. E 92, 012912 (2015).
36. Kaplan, U., Türkay, M., Biegler, L. & Karasözen, B. Modeling and simulation of metabolic networks for estimation of biomass accumulation parameters.
Discret. Appl. Math.157, 2483–2493 (2009).
37. Bekey, G. A.System Identification-An Introduction and a Survey15 (Springer London, London, 1970).
38. Hastie, T., Tibshirani, R. & Friedman, J.The Elements of Statistical Learning, Springer Series in Statistics. (Springer New York, NY, 2009).
39. Eldar, Y. C. & Mishali, M. Robust recovery of signals from a structured union of subspaces.IEEE Trans. Inf. Theory55, 5302–5316 (2009).
40. Majumdar, A. & Ward, R. K. Fast group sparse classification.Can. J. Electr. Comput. Eng.34, 136–144 (2009).
41. Eldar, Y. C., Kuppinger, P. & Bölcskei, H. Block-sparse signals: uncertainty relations and efficient recovery.IEEE Trans. Signal Process.58, 3042–3054 (2010). 42. Duarte, M. F. & Eldar, Y. C. Structured compressed sensing: from theory to
applications.IEEE Trans. Signal Process.59, 4053–4085 (2011).
43. Judd, K. & Nakamura, T. Degeneracy of time series models: the best model is not always the correct model.Chaos16, 033105 (2006).
weakly coupled networks.PLoS ONE12, 1–12 (2017).
45. Opgen-Rhein, R. & Strimmer, K. From correlation to causation networks: a simple approximate learning algorithm and its application to high-dimensional plant gene expression data.Bmc. Syst. Biol.1, 37 (2007).
46. Schreiber, T. Measuring information transfer.Phys. Rev. Lett.85, 461–464 (2000).
47. Hirata, Y. & Aihara, K. Identifying hidden common causes from bivariate time series: a method using recurrence plots.Phys. Rev. E81, 016203 (2010). 48. Wolf, J. & Heinrich, R. Effect of cellular interaction on glycolytic oscillations in
yeast: a theoretical investigation.Biochem. J.345, 321–334 (2000).
49. Leloup, J.-C. & Goldbeter, A. Chaos and Birhythmicity in a model for circadian oscillations of the PER and TIM proteins in drosophila.J. Theor. Biol.198, 445–459 (1999).
50. Yeung, M. K., Tegner, J. & Collins, J. J. Reverse engineering gene networks using singular value decomposition and robust regression.Proc. Natl. Acad. Sci. USA99, 6163–6168 (2002).
51. Yu, D. & Parlitz, U. Estimating parameters by autosynchronization with dynamics restrictions.Phys. Rev. E77, 66221 (2008).
52. Hansel, D., Mato, G. & Meunier, C. Clustering and slow switching in globally coupled phase oscillators.Phys. Rev. E48, 3470–3477 (1993).
53. Hansel, D., Mato, G. & Meunier, C. Phase dynamics for weakly coupled hodgkin-huxley neurons.Europhys. Lett.23, 367–372 (2007).
54. Izhikevich, E. M.Dynamical Systems in Neuroscience: The Geometry of Excitability and Burtsing. (MIT Press, Cambridge, 2007).
55. Rössler, O. E. An equation for continuous chaos.Phys. Lett. A.57, 397–398 (1976).
56. Buhmann, M. D.Radial Basis Function: Theory and Implementations
(Cambridge University Press, Cambridge, 2003). Acknowledgements
We thank Fabio Schittler Neves, Benedict Lünsmann and Fenna Müller for useful dis-cussions. M.T. thanks Albert Laszlo Barabasi for hospitality and useful discussions during a visit in March 2016. We acknowledge support by the German Research Foundation and the Open Access Publication Funds of the TU Dresden. This work is supported through the German Science Foundation (DFG) by a grant toward the Center of Excellence “Center for Advancing Electronics Dresden”(cfaed). We also gratefully acknowledge support from the Federal Ministry of Education and Research (BMBF Grant Nos. 03SF0472E and 03SF0472F) and the Max Planck Society.
Author contributions
All authors conceived the research and contributed materials and analysis tools. J.C. and M.T. developed the theory and algorithms and designed the research. All authors pro-vided model systems and the quality measures. J.C., M.N., and S.H. carried out the numerical experiments. All authors analyzed the data, discussed and interpreted the results, and wrote the manuscript.
Additional information
Supplementary Informationaccompanies this paper at https://doi.org/10.1038/s41467-017-02288-4.
Competing interests:The authors declare no competingfinancial interests.
Reprints and permissioninformation is available online athttp://npg.nature.com/ reprintsandpermissions/
Publisher's note:Springer Nature remains neutral with regard to jurisdictional claims in published maps and institutional affiliations.
Open Access This article is licensed under a Creative Commons Attribution 4.0 International License, which permits use, sharing, adaptation, distribution and reproduction in any medium or format, as long as you give appropriate credit to the original author(s) and the source, provide a link to the Creative Commons license, and indicate if changes were made. The images or other third party material in this article are included in the article’s Creative Commons license, unless indicated otherwise in a credit line to the material. If material is not included in the article’s Creative Commons license and your intended use is not permitted by statutory regulation or exceeds the permitted use, you will need to obtain permission directly from the copyright holder. To view a copy of this license, visithttp://creativecommons.org/ licenses/by/4.0/.