Implementation of a Management and Information
Administration Remote Sensing
Rubén Darío Mateus Sanabria1, Maria Liseth Rodriguez Montenegro2 1GIS Researcher and project manager, [email protected] 1Institute of Hydrology, Meteorology and Environmental Studies of Colombia–
IDEAM
1Teaching SDI Module and geographic metadata 1National University of Colombia
2Coordinator technological component – REDD Project,
2Institute of Hydrology, Meteorology and Environmental Studies of Colombia–
IDEAM
Abstract
The Natural resources knowledge requires of the deep study of diversity abundance and ecological distribution of the biota. That knowledge is supported by the basic investigation that supports the knowledge of their real biological richness, that facts are the subject of several national and international treatments for preservation, protection and biodiversity handling in balance with the human welfare.
Through REDD (Reducing Emissions from Deforestation and Forest Degradation) project the Institute of Hydrology, Meteorology and Environmental Studies - IDEAM, acquired, stored and processed a large volume of satellite images, which have been classified and stored. Additionally, in its mission to do just as managed images from various remote sensing, and likewise should be organized and centralized to ensure access and availability.
Several entities that have as raw material of research satellite images have the same problem, the management of big volumes of spatial information in raster format. This information, is as complex and specific as the sensors that produce them, it is necessary to guarantee their quality and integration with information in vector format in order to obtain new products and sub products as much as cartographic (thematic and base maps), as of base information (data base, statistics, among others) for searches carried by the Institute.
This information is a key resource for mission processes and research conducted by the Institute in this regard and due to the increase of this information was necessary to build a raster data model, develop a tool that facilitates access to such information in the Web, implement processing options through the Web and
build a management information system that consolidates a raster "Satellite Image Bank" in order to optimize their management and administration.
In this context, the first advancement was the inventory of images, followed a raster data model, after the construction of a standard methodology and finally a procedures for storage and management of this information. Documentation of image data from remote sensing is essential as it allows to present and analyze this information based on space and time, resulting in added capacity and knowledge for making decisions about climate change, generating Project to Reduction Emissions from Deforestation and forest Degradation - REDD, conservation, use of biodiversity and human welfare.
This management system and raster data management and development of Satellite Images Bank constitutes a useful tool that enables you to collect geographic data to organize, document and standardize. Its use reduces costs, duplication of efforts and allows the exchange of information, facilitate access and use is through the application developed, thus the quality of this becomes a decisive factor for use. This initiative constitutes the first experience at national and foundation for the construction of new processes related to the organization and management of this type of raster data or of spatial information. In addition, we will dock with the Colombian Spatial Data Infrastructure - ICDE.
Keywords: Remote sensors, satellite imagery, standard, application, Biodiversity, processing, REDD, information raster, data model.
1 BACKGROUND
In Colombia, from the creation of a new National Constitution institutionally reorganized the administration by the State on environmental issues and institutions associated with it. This is how in 1993 he created the Institute of Hydrology, Meteorology and Environmental Studies, IDEAM, which has the main function "lifting and handling of scientific and technical information on ecosystems that are part of the environmental heritage of the country" in that same vein, "The IDEAM shall obtain, analyze, review, process and disseminate basic information on vegetation management and use of biophysical resources of the nation." Additionally, it is up to IDEAM, "Collaborating in the studies global change and in all those activities that set by the Ministry of the Environment in the development of international environmental policy."
On the other hand, is the institution responsible missional IDEAM the development, implementation, consolidation and sustainability of the Environmental Information System-SIA. Under the SIA, is currently engaged the National Forest-SNIF information, which should develop as a key component
module for the issue of deforestation and carbon content in natural forests in the country, with which compliance is given defined as the principles of the IPCC good practice, such as transparency, completeness, consistency, comparability and accuracy.
The work presented below, is part of the objectives achieved within the project to strengthen the technical capacity related to the design, implementation and monitoring of projects to reduce emissions from deforestation and degradation (REDD) at the national and sub-Colombia's nationwide which was developed under a cooperative agreement between the IDEAM, the Nature Foundation and the Foundation-Moore.
The agreement signed by the parties, established as a fundamental principle, that all information produced under the agreement is published, including the inputs used to develop the products, which are essentially a baseline of information on deforestation and carbon content natural forests in Colombia. To ensure this, we built a web system that allows the consultation of all project results (maps, reports, documents, protocols, methodologies) and information inputs used (satellite imagery, digital elevation models, plots forest inventory data) and their respective metadata.
The construction of this web system, must meet the following specifications: • Be integrated environmental information system missionary IDEAM • It would stay at the technological infrastructure that has the IDEAM
• It would be administered by staff IDEAM, both in its theme and in its technological aspects, to which should be a transfer of staff capabilities IDEAM
• Provide unrestricted access to information produced, while ensuring compliance with copyright.
To achieve the construction of this web system was necessary to intervene technology platform into three components:
a. Data models
b. Technology Infrastructure
c. Raster data management (organizing, documenting and publishing the data) to allow users of these information products explore the data, online access to
them and process the data to generate reports of rates of deforestation, carbon contents, natural forest area among others.
It is important to note that while the IDEAM, is one of the entities in Colombia with more experience in satellite image processing for the generation of environmental information in topics like:
• Identification of areas susceptible to flooding • Weather models
• Identification of risk areas to fires in vegetation cover • Hydrological Models
• Reporting to glaciers in high mountain • Climate change
Additionally, the IDEAM is an entity that has among its functions being the hydrometeorological service of the country, with some functions of a forest service and also has the responsibility to generate environmental information for guiding the generation and management of environmental policy in Colombia. As hydrometeorological service, IDEAM has a strong tradition and robust in handling alphanumeric data with a database with 40 years of data. However, the management of data in other formats such as vector and raster was just beginning and in the case of raster data were scattered in the state, some metadata, but very few.
GOAL
Manage raster data to ensure that users of products and services information Web System Monitoring Deforestation and Carbon natural forests in Colombia with the following completed:
• Finding the data and information set forth • Access to data online and download
• Run on-line process for automating the spatial analysis of the data.
The design of the storage structure and management of raster data was performed taking into account the inventory of satellite imagery available in the different thematic areas of IDEAM and the remote sensing images are downloaded daily via a satellite link to support the activities of environmental forecasts and warnings by the IDEAM and taking into account the projection of acquisition of remote sensing images to be processed to generate maps of deforestation and carbon content in natural forests of Colombia.
Figure No. 1 illustrates the dependencies of the Institute of Hydrology, Meteorology and Environmental Studies, IDEAM, which highlights the two areas that were directly involved in the project and subject areas integrated in the design of the storage structure.
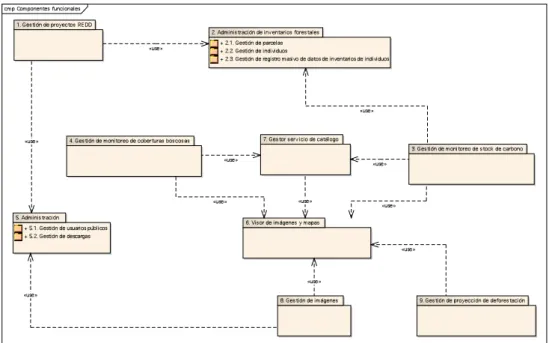
Additionally, we used the RUP methodology for requirements elicitation to be met by System Monitoring Deforestation and Carbon, in which a key component is the Image Management module and raster data, as shown in figure No. 2.
Arquitectura del Management and Information Administration System Remote Sensing
The technology architecture on which the system design is three levels and multi-server, in which applications are allowed some components on separate servers, independent of the data layer to improve system performance.
Databases, system raster data storage and servers that support it represent the first level, then at the second level are the data services that serve as mapping services and / or imaging services in the third level are the applications that handle the information management and / or consume the services (in the case of spatial information) and alphanumeric information are the gateway to the data published by the system and through which the users entering the system via the Web or consume services for data processing.
A three-tier architecture provides greater flexibility, faster response and facilitates changes in the database, applications or user interfaces, view figure No. 3
Figure 2: Component diagram of Deforestation and Carbon Monitoring
System
Figure 3: Arquitectura del Management and Information Administration
System Remote Sensing
The results can fall into two areas of impact
Technological impacts
Design and start up of a storage structure Raster Data
The raster data inventory and projection made for the acquisition of data in this format, allowed to make a design that is scheduled for 2012, 40,655 store raster data which range from remote sensing imagery, elevation data model and derived products to raster maps of different applications among which are weather maps, forecast landslide forecasts of vegetation fires, maps of areas of natural forest and deforestation maps Biomass and Carbon Content for Colombia direferentes levels of aggregation and 1:500,000 and 1:100,000 scale. The level of load current is 52.57%.
Documentation of raster data loaded with the national standard for metadata based on ISO 19115 and 19139.
Generation catalog services under specification C-SW for all raster data available in the storage structure.
Publication of data and mapping services to the specifications WMS, WCS for raster data available in the storage structure.
The provision of online data, to allow system users to download information of interest, for which the system must record and sign a licensing agreement on the noncommercial use of the data.
Publication of data processing services to generate raster reports: Deforestation rates for the periods 1990-2000, 2000-2005, 2005-2010
• Area Natural forest in Colombia have, for the years 1990, 2000, 2005, 2007 and 2010.
• Biomass and Carbon Content in Colombia in tons for 1990, 2000, 2005, 2007 and 2010.
• Change in forest cover by regeneration • Change in forest cover due to deforestation
Reports are generated at different levels of spatial aggregation as follows: • National Consolidated
• Consolidated by Department
• Consolidated regional environmental authorities.
Availability of information
Accessibility via web baseline of information generated from this project which will focus on available for viewing and download
• Deforestation maps 1:500,000 scale for the years 2000 and 2007 as part of exercise for the generation of early warnings to the identification of hotspots defeorestación areas, to support the regional environmental authorities of Colombia in its monitoring and control.
• Deforestation maps at 1:100,000 scale for the years 1990, 2000, 2005 and 2010 to generate the official figures of deforestation rates and coverage of natural forest, which are generated with the National Communication reports on the effects climate change in Colombia, providing the figures, data and analysis that contribute to future decisions at the institutional and citizen to deal with this phenomenon.
Support decision makers providing reliable and timely information to guide the formulation and management of environmental policies to reduce deforestation of natural forests in Colombia and contribute to the protection of environmental assets and biodiversity in our country.
4 LESSONS LEARNED
While the IDEAM, has a long tradition of alphanumeric geographic data management for hydro-meteorological records and experience in generating thematic maps from vector data, management of geographic data in an integrated manner will pose a review of processes generation of information that would guide the design of databases and storage schemes appropriate for the products and services generated by the IDEAM information to different users who demand the entity information to support decision making that guides policy environmental management, monitoring and control over environmental resources in Colombia.
Implementation of management systems should aim to ensure the user: • Discover data of interest
• Knowing the specifications which were built to available data, as the scope, access restrictions, format, owner and others. For this it is essential to document the data (metadata) and the generation of catalog services allow discover data under standards that support interoperability in the query.
• Accessing data or their location within the storage systems of the organization. The optimum is to have access to maps, either for viewing or downloading.
Data management is implicit, defining policies for access to information, which are embodied in computer applications. In the case of Colombia and particularly in the IDEAM, our legislation is very ambiguous when managing electronic documents and specifically in the IDEAM, licensing agreements are signed by the Director of the Bank and required a transfer of such licensing agreements with each one of the officials working in the state and this has implications beyond a software tool.
Through this project, the organization achieved a volume of data and online access unprecedented in Colombia. We acquired some very robust software components for publishing raster and for automatic generation of metadata from the header files of images or equivalent. But in the march, we realized the need to appropriate the way in which this metadata is generated and this requires technical capacity building in the country, supporting OGC standards geographical services, especially C-SW and related ISO standards.
5 EXPECTATIONS
• Consolidate our system as a node of information that provides data on the Dynamics of Deforestation in Colombia and the carbon content in natural forest reserves in our country.
• Build capacity in the IDEAM to properly exploit the management module remote sensing imagery and raster data.
•
Articulate our monitoring system to other information initiatives that focus on data collection in the field, to improve the resolution of the information published today.5 CONCLUSIONS
• Experience in administration and management of geographic data of alphanumeric or vector, is not comparable with the technological
challenges posed by the raster data management, which by their format and size required technological solutions very different from conventional geographic data (lines, points and polygons).
• Implementation of management systems should aim to ensure the user or Discover data of interest.
• It is important to know the specifications which were built to available data, as the scope, access restrictions, format, owner and others. For this it is essential to document the data (metadata) and the generation of catalog services allow discover data under standards that support interoperability in the query
• It is essential that the selected technology solution, to ensure continuous updating of map services, reflecting changes in the source data. For institutions such as the IDEAM, in which the time variable on topics such as weather forecasting and climate, this frequency is very high and the administrative burden can be very heavy if you select an architecture not suitable for this type of data.
• Most applications and software components on the market both proprietary software as open source, do not provide functions related to the licensing agreement signed data, which are essential to allow downloading of data.
• Currently, the development of commercially available software open source and proprietary, it provides designers and system architects versatile tools in the management of remote sensing data, which facilitates the processes of administration, however, requires work seamlessly with agencies generating remote sensing data to automatically generate metadata from the header files that have this type of data, which would increase access to it.
REFERENCES
Contreras, Gustavo. 1979. Elementos de cartografía. Editorial Don Bosco. Bogotá, D. C.
Icontec. Instituto Colombiano de Normas Técnicas y Certificación. 2003. NTC 5043 Información geográfica. Conceptos básicos de calidad. Bogotá, D. C.
Icontec. Instituto Colombiano de Normas Técnicas y Certificación. 2003. NTC 5205 Precisión de datos espaciales –PDE–. Bogotá, D. C.
Icontec. Instituto Colombiano de Normas Técnicas y Certificación. 2002. NTC 4611 Información geográfica. Metadato geográfico. Bogotá, D. C.
IGAC. Instituto Geográfico Agustín Codazzi. 1998. Principios básicos de cartografía temática. Bogotá, D. C.
IGAC. Instituto Geográfico Agustín Codazzi. 1991. Uso de los mapas y fotografías aéreas. Bogotá, D. C.
Jensen, John R. Introductory Digital Image Processing: A Remote Sensing Perspective, Prentice Hall PTR, Upper Saddle River, NJ, 1995
Mateus, R.D., Sua, S., y Franco. C.A, (2006). Sistema de Administración de Información Espacial, versión 1.0. Administración del sistema de información geográfica en el instituto Alexander von Humboldt. Instituto de investigación de recursos biológicos Alexander von Humboldt, Bogotá D.C., Colombia, 150p.
Moolenar, M. 1998. An Introduction to the Theory of Spatial Object Modelling for GIS. Taylor & Francis. Londres. 246 p.
Montoya, A.P. 1996. Percepción remota y procesamiento digital de imágenes. IGAC-CIAF. Bogotá, D. C.
Muehrcke, P.C. and Juliana O. Muehrcke. 1992. Map Use. Madison, WI: JP Publications.
Sua, S., Mateus, R. D. y Vargas, J. C. 2004. Georreferenciación de registros biológicos y gacetero digital de localidades. Instituto de Investigación de
Recursos Biológicos Alexander von Humboldt. Bogotá, D. C., Colombia. 69 p
Web-based articles:
Centro Internacional de Agricultura Tropical CIAT. Soluciones que cruzan fronteras. Servicios de Mapas por Internet. URL:
http://gisweb.ciat.cgiar.org/sig/esp/servicios-mapas-internet.htm [F. consulta: 20110701]
Centro internacional para el desarrollo de montaña integrado. 2001. SIG para principiantes. URL:
http://www.aag.org/sustainable/resources/student_guide/3%20Otros/3.SI G%20para%20principiantes.pdf [F. consulta: 20110805]
Escobar F., Hunter G., Bishop I., Zerger A. Introducción a los SIG. Department of Geomatics. The University of Melbourne. URL:
http://www.sli.unimelb.edu.au/gisweb/ [F. consulta: 20090905] García R., María José. 1998. Mapas temáticos, escalas y proyecciones
cartográficas. Universidad Politécnica de Madrid. Escuela Universitaria de Ingeniería Técnica Topográfica de Madrid. URL:
http://nivel.euitto.upm.es/~mab/tematica/portada.html [F. consulta: 20100628]
Hi-software. 2004. Metadatos para la accesibilidad. URL:
http://www.hisoftware.com/uaes/WebHelp/metadatos_para_la_accesibili-dad.htm [F. consulta: 20110302]
Infraestructura Colombiana de Datos Espaciales – ICDE. 2005. Infraestructura Colombiana de Datos Espaciales. URL:
http://www.icde.org.co/ICDE_20001_archivos/frame.htm [F. consulta: 20110207]
INEGI. Instituto Nacional de Estadística, Geografía e Informática. Mayo 7 de 1993. Metadatos geoespaciales. URL:
http://antares.inegi.gob.mx/metadatos/metageo1.htm [F. consulta: 20110204]
Pacific Forestry Centre PFC. Interoperabilidad y organización de la información para los sistemas nacionales y mundiales de información forestal. IUFRO. Recuperado el 20 de octubre de 2003 de
http://www.pfc.forestry.ca/interop/index_s.html [F. consulta: 20111020] Sellers, B. Francisco J. y Alvarez, L. Luis A. Definición De Un Modelo De Datos
Para La Implemetación De Un Sig Municipal. Departamento de
Información Geográfica. Servicio de Urbanismo. Excmo. Ayuntamiento de Cáceres. http://sig.caceres.es/trabajos/Ponencia_057.pdf [F. consulta: 20110410]
Torossi Gustavo M. 2002. Diseño de Sistemas, Universidad Tecnológica Nacional, Facultad Regional Resistencia. URL:
http://www.ecomchaco.com.ar/utn/disenodesistemas/apuntes/md/modelo _datos.htm [F. consulta: 20091110]
U.S. Geological Survey. El Internet Map Server. URL:
http://mapsonline.wr.usgs.gov/peru/sp_internet.html [F. consulta: 20110610]
Proceedings:
Mateus, R.D. (2009). “Administración y gestión de información geográfica como base para la consolidación de Infraestructuras de Datos Espaciales”, Proceedings VI congreso internacional de Geomántica 2009, Informática 2009, XIII convención y feria internacional, Nuevas tecnologías: desarrollo y soberanía, Feb 9 – 13 the 2009, La Habana, Cuba.
Mateus, R.D. (2010). “Buenas Prácticas en la Administración y Gestión de Información Geográfica, Insumo para las Infraestructuras de Datos Espaciales”, Proceedings conferencia colombiana de usuarios ESRI, Aug 19 – 20 the 2010, Bogotá, Colombia.
Mateus, R.D. (2006). “Diseño de un estándar para la organización, almacenamiento e implementación de un Banco de Imágenes Satelitales”, Proceedings 9ª Conferencia Internacional de la Infraestructura de Datos Geoespaciales (GSDI-9). Información geoespacial: herramienta para la erradicación de la pobreza., Nov 3 – 11 the 2006, Santiago de Chile, Chile
This work is licensed under the Creative Commons Attribution 3.0 License. To view a copy of this license, visit http://creativecommons.org/licenses/by/3.0/legalcode
Proceedings of Global Geospatial Conference 2012 Québec City, Canada, 14-17 May 2012