HIGH-THROUGHPUT CHARACTERIZATION OF
FOODBORNE PATHOGENS USING
NEXT-GENERATION SEQUENCING
A Dissertation
Presented to the Faculty of the Graduate School of Cornell University
in Partial Fulfillment of the Requirements for the Degree of Doctor of Philosophy
by
Laura M. Carroll August 2019
c
2019 Laura M. Carroll
HIGH-THROUGHPUT CHARACTERIZATION OF FOODBORNE PATHOGENS USING NEXT-GENERATION SEQUENCING
Laura M. Carroll, Ph.D. Cornell University 2019
Next-generation sequencing (NGS) is being increasingly employed to char-acterize food-associated microbes and communities, including those which pose a threat to human health. As the amount of publicly available genomic data from these organisms increases, (i) rapid, scalable methods for inferring biological function from large amounts of NGS data are needed, and (ii) mean-ingful biological conclusions derived using these methods can be leveraged to improve safety along the food supply chain. The studies reported here detail the application of whole-genome sequencing (WGS) to two groups of organ-isms which differ in terms of the challenges they pose to human health: (i)
non-typhoidal Salmonella enterica, a well-characterized, Gram-negative foodborne
pathogen which boasts a large repertoire of established computational methods
for analyzing WGS data derived from it, and (ii) the lesser-sequenced Bacillus
cereus group, which consists of closely related, Gram-positive, spore-forming species which vary in their ability to cause disease in humans.
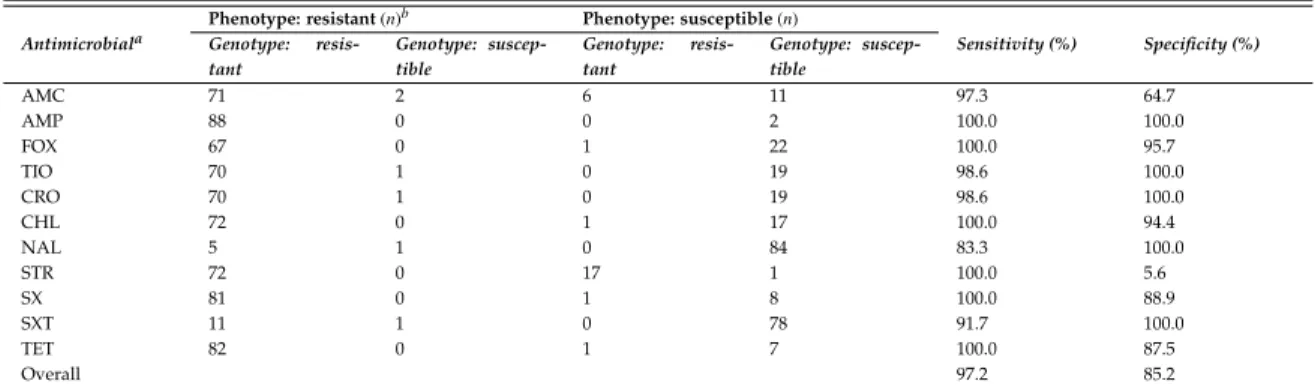
ForSalmonella enterica, antimicrobial resistance (AMR) was of particular con-cern; WGS was used to characterize 90 AMR strains isolated from either hu-man or bovine hosts from New York or Washington State. In addition to pre-dicting phenotypic resistance to a panel of twelve antimicrobials with high accuracy (mean sensitivity and specificity of 97.2% and 85.2%., respectively),
significant geographic and host associations, including quinolone resistance, which was only observed in human isolates from Washington State.
Addi-tionally, one multidrug-resistant, colistin-susceptible Salmonella Typhimurium
strain was found to harbormcr-9, a novel plasmid-mediated colistin resistance
gene.
ForBacillus cereus, classification of isolates based on virulence potential was
the primary focus. Anin silicotyping tool designed to rapidly identifyB. cereus
group virulence factors and taxonomic affiliation using WGS data is described.
This application, named BTyper, was used to query all Bacillus cereus group
genomes submitted to NCBI’s Genbank database (n = 662, accessed April 6,
2017). Additionally, BTyper was used to characterize the genomes of 33B. cereus
group strains isolated in conjunction with a 2016 outbreak. Thirty genomes
were classified as emeticBacillus cereusand predicted to be the cause of a
single-source outbreak using a combination of computational, microbiological, and epidemiological methods.
Overall, the results presented here showcase how NGS can be used to char-acterize food-associated microbes at greater resolution than preceding technolo-gies. Additionally, computational and statistical methods used to analyze Illu-mina data derived from foodborne pathogens are emphasized. The tools and methods detailed here can serve as a guide for deriving biologically informed conclusions from WGS data.
BIOGRAPHICAL SKETCH
Laura M. Carroll grew up in Houghton, Michigan. She attended Michigan State University from 2009 to 2014, where she received a Professorial Assistantship through the university’s Honors College to conduct research under the direc-tion of Professor Brad Marks. As a member of the Biosystems Engineering Food Safety Laboratory, Laura spent five years developing mathematical models to predict the thermal inactivation of foodborne pathogens in various food
ma-trices, with an emphasis on modeling the physiological response ofSalmonella
entericato prolonged periods of sublethal thermal stress.
After graduating with a B.S. in Genomics and Molecular Genetics and a B.A. in History, Laura began her graduate studies at Cornell University under the direction of Professor Martin Wiedmann. As a doctoral student, Laura’s re-search focused on (i) developing bioinformatic pipelines to rapidly
character-ize bacteriain silicousing next-generation sequencing data, and (ii) using those
pipelines to analyze large genomic data sets from bacterial isolates and micro-bial communities. During her time at Cornell, Laura received a National Sci-ence Foundation (NSF) Graduate Research Fellowship, and, later, a NSF Grad-uate Research Opportunities Worldwide (NSF GROW) award, which allowed her to spend time as a visiting researcher with Professor Tanja Stadler’s Com-putational Evolution Group at ETH Zurich in Switzerland. She additionally spent several months as a graduate intern with IBM’s Industrial and Applied Genomics Group, where she was first introduced to metagenomic and meta-transcriptomic data analysis methods. After completing her Ph.D., Laura will be focusing primarily on metagenomic and metatranscriptomic data analysis as a Postdoctoral Fellow in the group of Dr. Georg Zeller at the European Molecu-lar Biology Laboratory (EMBL) in Heidelberg, Germany.
ACKNOWLEDGEMENTS
It is impossible to allocate the space necessary to adequately thank all of those who have helped me reach this point in my career. I am indebted to my committee members, Drs. James Booth and Michael Stanhope, for their guid-ance and mentorship, as well as the National Science Foundation Graduate Re-search Fellowship Program (NSF GRFP) and associated NSF Graduate ReRe-search Opportunities Worldwide (NSF GROW) program for their generous funding.
I would not be here, in the most literal sense, without the support of my fam-ily: my mother, who, as a woman in STEM, has been a role model available to me for the entirety of my life; my father, for his unconditional love and support, even when I pushed the boundaries of ”unconditional”; my brother, for his will-ingness to drop everything to help me, even when I probably (read: definitely) don’t deserve it; and my sister, who has been, and will forever be, my confidant, favorite labmate, and best friend.
Professionally, I am beholden to my undergraduate research advisor, Dr. Brad Marks, for the essential mentorship he provided while I navigated my undergraduate years and transition to graduate school; Nicole Hall, who even-tually molded me into a semi-functioning member of a laboratory; Dr. Teresa Bergholz, whose guidance (and patience) nurtured my love of research (but not RNA); Dr. Henk den Bakker, who helped me hit the ground running in my first few weeks of graduate school (and continues to help me, even when I pester him from afar); Dr. Richard Pereira, who guided me through my first research project at Cornell; Drs. Simone Bianco and Kristen Beck, whose mentorship during my time at IBM fostered my love of shotgun metagenomic and meta-transcriptomic data analysis; Dr. Ahmed Gaballa, who is possibly the only per-son on the planet as enthusiastic about colistin resistance as I am; and Dr. Tanja
Stadler, who welcomed me into her group and made my time in Switzerland easily one of the most transformative experiences I have had as a graduate stu-dent and researcher.
I am especially grateful for the guidance I have received from Drs. Jasna
Ko-vac (my ”Bacillusadvisor”), Claudia Guldimann (my ”Salmonellaadvisor”), and
Rachel Cheng, who have been incredible mentors, role models, collaborators, and friends throughout my graduate career. I consider myself incredibly fortu-nate to be able to work alongside such brilliant researchers who display such an aspirational work ethic and level of scientific creativity.
Continuing on a personal level, I am indebted to all of those on whom I have leaned at various times during my graduate career and beyond: my soulmates, Rachel Allison, Geoff Pleiss, and Tobias Schnabel; my sisters, Corinna Noel and Jillian Jastrzembski; my ”sisters”, Ariel Buehler and Lory Henderson; moja sestra, Svetlana Lyalina; my Swiss-ters, Jana Huisman, Rachel Warnock, Joelle Barido-Sottani, and Julia Pecherska; Venelin Mitov and Daniel Scain Farenzena, who went out of their way to make Basel feel like my second home; and to all those who have been there for me in more ways than they can possibly know: Pedro Menchik; Bryan Peele; Madeleine Bee; Emily Griep; Jeff Tokman; Sophia Harrand; Beth Burzynski; Gorjan Dukovski; Richard Goater; Veronica Guariglia; Dave Kent; Vlad Niculae; Madelyn Shoup; Hilary Podgers; Brittany Massa; Morgan Frost; Kylie Gignac; Ian Hildebrandt; Dani Smith; and Sarah Buchholz.
I owe additional gratitude to all of my labmates, past and present, whom I was unable to list here, particularly my friends and colleagues in the Biosys-tems Engineering Food Safety Laboratory at Michigan State University, IBM’s Industrial and Applied Genomics Group, the Computational Evolution Group
at ETH Zurich, and the Food Safety Laboratory and Milk Quality Improvement Program at Cornell University.
Finally, I would like to thank my advisor of the past five years, Dr. Martin Wiedmann. Articulating how grateful I am to have him as a mentor is com-pletely futile; the level of independence and flexibility he has afforded me as a doctoral student to pursue nearly every research question that I could dream up is incomparable (and, as he would probably argue, excessive). I consider my-self infinitely fortunate to have been a member of his laboratory, and I will never take the knowledge, skills, and lessons he has taught me, both as a researcher and as a person, for granted.
TABLE OF CONTENTS
Biographical Sketch . . . iii
Dedication . . . iv
Acknowledgements . . . v
Table of Contents . . . viii
List of Tables . . . xiii
List of Figures . . . xv
1 Introduction1 1 1.1 Next-Generation Sequencing: an Overview . . . 2
1.2 NGS Data Analysis . . . 5
1.3 NGS Applications: Whole-Genome Sequencing of Microbial Contaminants . . . 6
1.4 NGS Applications: RNA Sequencing (RNA-Seq) of Food-Relevant Organisms . . . 8
1.5 NGS Applications: High-Throughput Amplicon Sequencing . . . 10
1.6 NGS Applications: Shotgun Metagenomic and Metatranscrip-tomic Sequencing . . . 13
1.7 Conclusion . . . 16
1.8 References . . . 16
2 Whole-genome sequencing of drug-resistant Salmonella enterica iso-lates from dairy cattle and humans in New York and Washington states reveals source and geographic associations2 26 2.1 Abstract . . . 27
2.2 Introduction . . . 28
2.3 Materials and Methods . . . 30
2.3.1 Isolate selection . . . 30
2.3.2 Phenotypic AMR testing . . . 32
2.3.3 Whole-genome sequencing . . . 33
2.3.4 Initial data processing and genome assembly . . . 33
2.3.5 In silicoserotyping and MLST . . . 34
2.3.6 In silicoAMR gene detection . . . 34
2.3.7 Initial phylogenetic tree construction and reference genome selection . . . 35
2.3.8 Reference-based variant calling . . . 36
1From Wiedmann, Martin and Laura M. Carroll (2019). ”Next-Generation Sequencing”. In:
Encyclopedia of Food Chemistry, pp. 376-383. DOI: 10.1016/b978-0-08-100596-5.21792-7.
2From Carroll, Laura M., Martin Wiedmann, Henk den Bakker, Julie Siler, Steven Warchocki,
David Kent, Svetlana Lyalina, Margaret Davis, William Sischo, Thomas Besser, Lorin D.
War-nick, and Richard V. Pereira (2017). ”Whole-Genome Sequencing of Drug-ResistantSalmonella
entericaIsolates from Dairy Cattle and Humans in New York and Washington States Reveals Source and Geographic Associations”. In:Applied and Environmental Microbiology83, pp.
e00140-2.3.9 Plasmid replicon detection . . . 37
2.3.10 Statistical analyses . . . 38
2.3.11 Accession number(s) and supplemental material . . . 40
2.4 Results . . . 40
2.4.1 Overall distribution of SNPs, AMR genes, AMR pheno-types, and plasmid replicons . . . 40
2.4.2 In silicoAMR gene detection is correlated with phenotypic AMR patterns. . . 42
2.4.3 S. Typhimurium phylogeny, AMR genes, AMR pheno-types, and plasmid replicons . . . 44
2.4.4 S. Newport phylogeny, AMR genes, AMR phenotypes, and plasmid replicons . . . 50
2.4.5 S. Dublin phylogeny, AMR genes, AMR phenotypes, and plasmid replicons . . . 53
2.5 Discussion . . . 56
2.5.1 WGS can be used to predict phenotypic resistance in bovine and human-associated Salmonella Typhimurium, Newport, and Dublin with high sensitivity and specificity 57 2.5.2 Both phenotypic and genomic data show geographic dif-ferences in resistance-related characteristics forSalmonella, suggesting a need for location-specific AMR control strategies. . . 60
2.5.3 S. enterica isolates from humans contain a more diverse range of AMR genes and plasmid replicons than those iso-lated from bovine populations . . . 62
2.6 Acknowledgments . . . 63
2.7 References . . . 63
3 Identification of novel mobilized colistin resistance gene mcr-9 in a multidrug-resistant, colistin-susceptibleSalmonella enterica serotype Typhimurium isolate3 74 3.1 Abstract . . . 75
3.2 Observation . . . 76
3.2.1 In silicoidentification ofmcr-9in an MDRS.Typhimurium genome . . . 77
3.2.2 mcr-9 confers resistance to colistin when cloned into colistin-susceptibleE. coliNEB5α . . . 79
3.2.3 Mcr-3, Mcr-4, Mcr-7, and Mcr-9 are highly similar at the structural level . . . 80
3From Carroll, Laura M., Ahmed Gaballa, Claudia Guldimann, Genevieve Sullivan, Lory
O. Henderson, and Martin Wiedmann (2019). ”Identification of Novel Mobilized Colistin Re-sistance Genemcr-9in a Multidrug-Resistant, Colistin-SusceptibleSalmonella entericaSerotype
3.2.4 Numerous genera of Enterobacteriaceae harbor mcr-9 on
IncHI2 plasmids. . . 84
3.2.5 Accession number(s) and supplemental material . . . 87
3.3 Acknowledgments . . . 87
3.4 References . . . 87
4 Rapid, High-Throughput Identification of Anthrax-Causing and EmeticBacillus cereusGroup Genome Assemblies via BTyper, a Com-putational Tool for Virulence-Based Classification of Bacillus cereus Group Isolates by Using Nucleotide Sequencing Data4 91 4.1 Abstract . . . 92
4.2 Introduction . . . 93
4.3 Materials and Methods . . . 97
4.3.1 Database construction . . . 97
4.3.2 Construction of BTyper tool . . . 98
4.3.3 PCR detection of virulence genes . . . 99
4.3.4 MLST . . . 101
4.3.5 rpoBallelic typing . . . 101
4.3.6 Validation of BTyper using additional B. cereus group whole-genome sequences . . . 102
4.3.7 Construction of BMiner companion application . . . 102
4.3.8 Application of BTyper and BMiner to whole-genome se-quencing data . . . 103
4.3.9 Post hocstatistical analyses . . . 104
4.4 Results . . . 105
4.4.1 Construction and validation of BTyper usingin vitro meth-ods . . . 105
4.4.2 Characteristics associated with B. cereus group phyloge-netic clade III are most prevalent among genome assem-blies currently available at NCBI . . . 106
4.4.3 Application of BTyper to identify B. anthracis-associated genes in non-anthracis Bacillus isolates reveals virulence gene heterogeneity within genome assemblies from an-thrax toxin-encoding isolates . . . 108
4.4.4 Application of BTyper to identify assemblies associated with emeticB. cereusgroup isolates . . . 118
4.5 Discussion . . . 120
4From Carroll, Laura M., Jasna Kovac, Rachel A. Miller, and Martin Wiedmann (2017).
”Rapid, High-Throughput Identification of Anthrax-Causing and EmeticBacillus cereusGroup
Genome Assemblies via BTyper, a Computational Tool for Virulence-Based Classification of Bacillus cereusGroup Isolates by Using Nucleotide Sequencing Data”. In: Applied and
Envi-4.5.1 Accessible whole-genome sequence analysis tools can fa-cilitate improved taxonomic classification and
characteri-zation ofB. cereusgroup isolate virulence potential . . . . 120
4.5.2 Analysis of publicly available B. cereusgroup assemblies using BTyper and BMiner identifies virulence gene-based clusters that capture phylogenetic heterogeneity in iso-lates with similar phenotypes . . . 122
4.6 Acknowledgments . . . 124
4.7 References . . . 124
5 Characterization of Emetic and DiarrhealBacillus cereusStrains From a 2016 Foodborne Outbreak Using Whole-Genome Sequencing: Ad-dressing the Microbiological, Epidemiological, and Bioinformatic Challenges5 138 5.1 Abstract . . . 139
5.2 Introduction . . . 140
5.3 Materials and Methods . . . 142
5.3.1 Collection of Epidemiological Data . . . 142
5.3.2 Isolation and Initial Characterization ofB. cereusStrains . 142 5.3.3 rpoBAllelic Typing . . . 143
5.3.4 Bacterial Growth Conditions and Collection of Bacterial Supernatants . . . 144
5.3.5 Hemolysin BL and Non-hemolytic Enterotoxin Detection . 144 5.3.6 WST-1 Metabolic Activity Assay . . . 145
5.3.7 Statistical Analysis of Cytotoxicity Data . . . 146
5.3.8 Whole-Genome Sequencing . . . 146
5.3.9 Initial Data Processing and Genome Assembly . . . 147
5.3.10 In silicoTyping and Virulence Gene Detection . . . 147
5.3.11 Construction ofk-mer Based Phylogeny Using Outbreak Strains and Genomes of 18B. cereusGroup Species . . . . 148
5.3.12 Variant Calling and Phylogeny Construction Using Out-break Isolates . . . 149
5.3.13 Variant Calling and Statistical Comparison of Emetic Out-break Isolates to Publicly Available Genomes . . . 152
5.3.14 Statistical Comparison of Phylogenetic Trees . . . 153
5.3.15 Calculation of Average Nucleotide Identity Values . . . 154
5.3.16 Supplementary Material and Availability of Data . . . 154
5.4 Results . . . 155
5From Carroll, Laura M., Martin Wiedmann, Manjari Mukherjee, David C. Nicholas, Lisa A.
Mingle, Nellie B. Dumas, Jocelyn A. Cole, and Jasna Kovac (2019). ”Characterization of Emetic
and DiarrhealBacillus cereusStrains From a 2016 Foodborne Outbreak Using Whole-Genome
Sequencing: Addressing the Microbiological, Epidemiological, and Bioinformatic Challenges”. In:Frontiers in Microbiology10, pp. 144. DOI: 10.3389/fmicb.2019.00144.
5.4.1 Both Emetic and Diarrheal Symptoms Were Reported
Among Cases Associated With the B. cereus Foodborne
Outbreak . . . 155
5.4.2 WGS Confirms Presence of Multiple B. cereus Group
Species Represented Among Outbreak Strains . . . 157
5.4.3 Emetic and Diarrheal B. cereus Isolates Associated With
the Foodborne Outbreak do Not Differ in Cytotoxicity . . 159
5.4.4 Core SNPs Identified Among B. cereus Group Outbreak
Isolates From Two Phylogenetic Groups Are Dependent on Variant Calling Pipeline and Reference Genome Selection161
5.4.5 Choice of Variant Calling Pipeline Has Greater Influence
on Core SNP Identification Than Choice of Closely Re-lated Closed or Draft Reference Genome for Emetic Group IIIB. cereusGroup Isolates . . . 162
5.4.6 Phylogenies Constructed Using Core SNPs Identified in
55 Emetic ST 26B. cereusGenomes by kSNP3 and Parsnp
Yield Similar Topologies . . . 169
5.5 Discussion . . . 171
5.5.1 Addressing the Microbiological and Epidemiological
Challenges Associated With Determining the Causative Agent of an Emetic Foodborne Outbreak . . . 172
5.5.2 Considerations for Addressing the Unique Challenges
As-sociated With Characterization of Foodborne Outbreaks
Linked to theB. cereusGroup Using WGS . . . 174
5.5.3 Recommendations for Analyzing Illumina WGS Data
From B. cereus Group Isolates Potentially Linked to a Foodborne Outbreak . . . 179
5.5.4 As WGS Becomes Routinely Integrated Into Food Safety,
Clinical, and Epidemiological Realms, It Is Likely That the
Number of Illnesses Attributed toB. cereusWill Increase . 183
5.6 Acknowledgments . . . 184
5.7 References . . . 185
6 Conclusion 197
6.1 NGS can be used to replicate many microbiological assaysin silico
with high accuracy, speed, and throughput . . . 197
6.2 NGS can be used to identify novel genomic elements associated
with clinically relevant phenotypes . . . 199
6.3 NGS can be used to query pathogens associated with foodborne
outbreaks at higher resolution than its predecessors . . . 200
LIST OF TABLES
1.1 Overview of next-generation sequencing technologies discussed
in this chapter.a . . . 3
1.2 Overview of food science-relevant next-generation sequencing
applications discussed in this chapter. . . 5
2.1 Ranking of the five most common antimicrobial resistance
(AMR) gene groups, phenotypic AMR profiles, and plasmid
replicons for all serotypes, S.Typhimurium,S. Newport, andS.
Dublina . . . 42
2.2 ANOSIM and PERMANOVA statistics and their respective
meanPvaluesa . . . . 43
2.3 Sensitivity and specificity of genotype predictions of AMR
phe-notype for all 90Salmonellaisolates in the study. . . 44
2.4 Comparison of mean zone diameters between (i)Salmonella
iso-lates with at least one AMR gene (ARG) that has been known to confer resistance to a particular antimicrobial and (ii) isolates
with no genes known to confer resistance to that antimicrobial.a . 46
2.5 Odds ratios for association of AMR gene groups, AMR
pheno-type, and plasmid replicons with source or location (only
associ-ations withPvalues of<0.05are shown).a . . . . 48
2.6 S.Typhimurium isolates withqnrand/oroqxgenes and/or point
mutations ingyrAand/orgyrBand/orparC.a . . . . 50
4.1 Percentage of isolates in which BTyper correctly identified the
presence/absence of eight virulence genes, MLST, rpoBAT, and
panCclade . . . 106
4.2 Virulence genes significantly associated with 5 B. cereus group
phylogenetic clades after a Bonferroni correctiona . . . 110
4.3 Non-anthracis Bacillus assemblies in which anthrax toxin genes
cya,lef, and/orpagAwere detected using BTyper . . . 115
4.4 Non-anthracis Bacillusassemblies in whichB. anthracis-associated
genes were detected, excluding anthrax toxin genes cya, lef, and
pagAand regulatoratxA . . . 117
4.5 B. cereusgroup assemblies in which emetic toxin genescesABCD
were detected. . . 119
5.1 Description of variant calling pipelines and associated input
data formats tested in this study. . . 149
5.2 Reference genomes used for reference-based variant calling in
this study. . . 150
5.3 List of outbreak isolates and corresponding metadata,
5.4 Maximum likelihood phylogenies of 30 emetic group III out-break isolates considered to be more topologically similar than
LIST OF FIGURES
2.1 Nonmetric multidimensional scaling (NMDS) plots for all
iso-lates based on antimicrobial resistance (AMR) gene sequences (A), phenotypic antimicrobial resistance/susceptibility profiles (B), and presence/absence of plasmid replicons (C). Points rep-resent isolates, while shaded regions and convex hulls corre-spond to isolate serotypes. For an interactive plot of these data, as well as interactive NMDS plots for individual serotypes, visit
https://github.com/lmc297/2017 AEM Figure S2. . . 44
2.2 Frequency of different phenotypic and genotypic resistance
determinants for each serotype-source group (e.g., Salmonella
Dublin isolates obtained from humans [S. Dublin Human]).
Genotypic resistance was determined using nucleotide BLAST (blastn) and the ARG-ANNOT database; isolates were classified as having a resistant genotype if the AMR gene was detected by BLAST with a minimum coverage of 50% and a minimum se-quence identity of 75%. Phenotypic resistance was tested using Kirby-Bauer disk diffusion. Percentages were calculated using the ratio of resistant isolates to total isolates in each
serotype-source group (n = 17for S. Typhimurium Bovine,n = 20 forS.
Typhimurium Human,n = 14forS. Newport Bovine,n = 18for
S. Newport Human,n = 10forS.Dublin Bovine, and n= 11for
S.Dublin Human). Nalidixic acid (NAL)- and
sulfamethoxazole-trimethoprim (SXT)-resistant isolates (6 and 12 of the 90 isolates, respectively) each had one isolate for which genotypic resistance
did not correlate with phenotypic resistance. . . 45
2.3 Phylogenetic tree of S.Typhimurium isolates constructed using
BEAST. Gene groups for AMR genes detected in each genome sequence at more than 50% coverage and 75% identity using BLAST (blastn) and ARG-ANNOT are indicated in green. An-timicrobials to which each isolate is resistant are indicated in red, and intermediate resistance to an antimicrobial is indicated in or-ange. Plasmid replicons detected in each genome sequence us-ing PlasmidFinder are indicated in purple. Branch lengths are reported in substitutions per site, while posterior probabilities
2.4 Phylogenetic tree of S. Newport isolates constructed using BEAST. Gene groups for AMR genes detected in each genome sequence at more than 50% coverage and 75% identity using BLAST (blastn) and ARG-ANNOT are indicated in green. An-timicrobials to which each isolate is resistant are indicated in red, and intermediate resistance to an antimicrobial is indicated in or-ange. Plasmid replicons detected in each genome sequence us-ing PlasmidFinder are indicated in purple. Branch lengths are reported in substitutions per site, while posterior probabilities
are reported at tree nodes. . . 51
2.5 Phylogenetic tree ofS.Dublin isolates constructed using BEAST.
Gene groups for AMR genes detected in each genome sequence at more than 50% coverage and 75% identity using BLAST (blastn) and ARG-ANNOT are indicated in green. Antimicro-bials to which each isolate is resistant are indicated in red, and intermediate resistance to an antimicrobial is indicated in or-ange. Plasmid replicons detected in each genome sequence us-ing PlasmidFinder are indicated in purple. Branch lengths are reported in substitutions per site, while posterior probabilities
are reported at tree nodes. . . 54
3.1 Comparison of mcr-9 to all previously described mcr
homo-logues, based on amino acid sequence. The maximum likeli-hood phylogeny was constructed using RAxML version 8.2.12 with the amino acid sequences of novel mobilized colistin
resis-tance genemcr-9(in blue) and all previously describedmcrgenes
(mcr-1to-8[in black]). The phylogeny is rooted at the midpoint, with branch lengths reported in substitutions per site. Branch labels correspond to bootstrap support percentages out of 1,000
replicates. . . 79
3.2 Colistin killing assay ofE. coliNEB5αharboring a pLIV2 empty
vector (negative control), mcr-3 (positive control), or mcr-9,
ex-pressed under the control of the IPTG-controlled SPAC/lacOid
promoter. Cells were grown in MH-II (Mueller-Hinton II)
medium with IPTG to the mid-exponential phase. Colistin was added at concentrations of 0, 1, 2, 2.5, or 5 mg/liter, and the
bac-teria were incubated at37◦C for 1h. The samples were diluted in
phosphate-buffered saline (PBS) and plated on LB agar plates for the determination of CFU. Log CFU reduction was calculated by comparing CFU after each treatment to CFU levels obtained at 0 mg/liter colistin, using three independent biological replicates. Asterisks denote significant differences compared to empty
vec-tor treatment (P< 0.05by Student’s t test relative to the
3.3 Structural models of all published Mcr proteins (Mcr-1 to -8) and Mcr-9, based on lipooligosaccharide phosphoethanolamine transferase EptA. Models were constructed using the Phyre2 server, and structures were viewed and edited using UCSF Chimera. Structural models show conservation of two EptA domains: transmembrane-anchored and soluble periplasmic
do-mains. . . 82
3.4 Similarity matrix (composed of Dali Z-scores) of all previously
described Mcr groups (Mcr-1 to -8) and Mcr-9, based on protein structure. The Dali server was used to perform all-against-all
comparisons of 3D structural models based on all mcr
homo-logues (Figure 3.3); for this analysis, amino acid sequences of
mcr-5.3andmcr-8.2, which were not available in ResFinder, were additionally included from the National Database of Antibiotic
Resistant Organisms (NDARO). . . 83
3.5 Location of Mcr-9 secondary structure elements within the
align-ment of Mcr amino acid sequences, constructed using the ES-Pript 3 server. The top track denotes Mcr-9 secondary struc-ture elements (alpha helixes and beta sheets). Green digits be-low the alignment denote cysteine residues forming a disulfide bridge (e.g., 1 forms a bridge with 1, 2 with 2, etc.). Within the amino acid sequence alignment itself, a strict identity (i.e., iden-tical amino acid residue at a site) is denoted by a red box and a white character. A yellow box around an amino acid residue de-notes similarity across groups, where groups were defined using
the default ”all” specification in ESPript 3 (ESPript 3 total score
[TSc]>in-group threshold [ThIn]), while a residue in boldface
de-notes similarity within a group (ESPript 3 in-group score [ISc] >
ThIn). . . 85
3.6 Organization of the mcr-9 locus in S. Typhimurium. An
un-known function cupin fold metalloprotein is encoded by the
gene downstream of mcr-9 (unlabeled black arrow). The
mcr-9 locus is flanked by two different terminal repeat sequences
(IRR) from the IS5 (orange box) and IS6 (red box) families. The
mcr-9 upstream region contains highly conserved putative -35
and -10 σ70-dependent promoter elements (blue boxes and blue
text). Moreover, themcr-9promoter region contains an inverted
repeat motif (green box, green text, and sequence logo) that is
conserved in more than 95% of 321mcr-9genes, as shown by the
4.1 BTyper command line workflow for various types of data and default typing methods. Input datum type is listed in the left margin, while typing methods are listed at the top of the chart. Command line parameters associated with a particular typing method are shown in parentheses. FSL, Food Safety Lab. . . 100
4.2 Percentage (%) ofB. cereusgroup assemblies in which a
particu-lar virulence gene was detected. Minimum identity and cover-age thresholds of 50 and 70%, respectively, were used for viru-lence gene detection. . . 107
4.3 Closest-matching phylogenetic clade using the panC loci from
662B. cereus group genome assemblies. ApanClocus could not be assigned in 4 genome assemblies, which is denoted by NA. . . 109
4.4 Principal-component analysis (PCA) of 662 B. cereus group
genome assemblies based on presence/absence of virulence genes. Virulence gene typing was carried out using BTyper, while PCA was performed using BMiner. Principal components 1 (PC1) and 2 (PC2) are plotted on the x and y axes, respectively, while principal component 3 (PC3) corresponds to point size. Plots are colored by isolate species, as found in NCBI (A), and
assigned cluster using k-medoids (B). To view interactive
ver-sions of these plots containing isolate names and metadata, all BTyper final results files and metadata can be downloaded from https://github.com/lmc297/BTyper/tree/master/sample data and viewed in BMiner. . . 111
4.5 k-medoids clusters based on presence/absence of virulence
genes detected using BTyper. Size corresponds to the number of
assemblies assigned to a given cluster, whilepanCcorresponds to
panC clades found in the cluster, with an asterisk denoting one
or more assemblies that could not be placed into a panC clade.
Numbers within cells correspond to the proportion of assemblies in a given cluster in which the corresponding virulence gene was detected. Green shading corresponds to a virulence gene de-tected in more than 90% of all assemblies in a cluster, while red shading corresponds to a virulence gene detected in fewer than 10% of all assemblies in a cluster. Yellow shading corresponds to B. anthracis-associated genes detected in fewer than 90% but greater than 0% of assemblies in a cluster. . . 112
4.6 Nonmetric multidimensional scaling (NMDS) plot of Bacillus cereusgroup clusters that (i) possessed at least one assembly that
was classified asBacillus anthracisin NCBI, and/or (ii) possessed
at least one assembly in which at least oneB. anthracis-associated
virulence gene (cya,lef,pagA,atxA,hasA, and/orcapABCDE) was
detected using BTyper. NMDS was performed in BMiner using virulence gene presence/absence data and a Jaccard dissimilar-ity metric. Isolates are represented by points, and convex hulls
and shading correspond to the assignedk-medoids cluster.
Vir-ulence genes are plotted in dark gray. . . 114
5.1 Maximum likelihood phylogeny of core SNPs identified in 33
isolates sequenced in conjunction with a B. cereus outbreak,
as well as genomes of the 18 currently recognized B. cereus
group species (shown in gray). Core SNPs were identified
in all genomes using kSNP3. Heatmap corresponds to
pres-ence/absence ofB. cereusgroup virulence genes detected in each
sequence using BTyper. Tip labels in maroon and teal correspond to the seven human clinical isolates and 26 isolates from food sequenced in conjunction with this outbreak, respectively. Phy-logeny is rooted at the midpoint, and branch labels correspond to bootstrap support percentages out of 500 replicates. Due to
the short lengths and low bootstrap support (all values< 10) of
branches within the outbreak clade, bootstrap support percent-ages are not shown on branches within the outbreak clade. . . 159
5.2 Percentage viability of HeLa cells when treated with
super-natants of each isolate as determined by the WST-1 assay. Via-bility was calculated as ratio of corrected absorbance of solution when HeLa cells were treated with supernatants to the ratio of corrected absorbance of solution when HeLa cells were treated with BHI (i.e., negative control), converted to percentages. The columns represent the mean viabilities, while the error bars rep-resent standard deviations for 12 technical replicates. Any two bars that do not share a common alphabetic character had
signif-icantly different percentage viability values (P< 0.05). . . 161
5.3 Number of core SNPs identified in 33 B. cereus group isolates
from two phylogenetic groups (30 and 3 isolates from groups III and IV, respectively), sequenced in conjunction with a foodborne outbreak. Combinations of five reference-based variant calling pipelines and three reference genomes, as well as one reference-free SNP calling method (kSNP3), were tested. . . 163
5.4 Comparison of core SNP positions reported by five
reference-based variant-calling pipelines for 33B. cereusgroup strains
iso-lated in association with a foodborne outbreak, with the
chromo-somes of (A)B. cereus AH187 (group III), (B)B. cereus s.s. ATCC
14579 (group IV), and (C)B. cytotoxicusNVH 391-98 (group VII)
used as reference genomes. Ellipses represent each pipeline. . . . 164
5.5 (A) Number of core SNPs and (B) total number of SNPs
identi-fied in 30 emeticB. cereusgroup III strains isolated in association
with a foodborne outbreak. Combinations of (A) five and (B) four reference-based variant calling pipelines and two reference genomes (either dustmasked or unmasked) were tested, along with one reference-free SNP calling method (kSNP3). Because the Parsnp pipeline reports core SNPs by definition, it was ex-cluded from Figure 5.5B (total SNPs). For quantification of the total number of SNPs (Figure 5.5B), all sites with more than one unique character were counted. . . 166
5.6 Ranges of pairwise (A) core SNP differences and (B) total SNP
differences between 30 emetic group III B. cereus group strains
isolated in conjunction with a foodborne outbreak.
Combi-nations of (A) five and (B) four reference-based variant call-ing pipelines and two reference genomes (either dustmasked or unmasked), as well as one reference-free SNP calling method (kSNP3) were tested. Lower and upper box hinges correspond to the first and third quartiles, respectively. Lower and upper whiskers extend from the hinge to the smallest and largest values no more distant than 1.5 times the interquartile range from the hinge, respectively. Points represent pairwise distances that fall beyond the ends of the whiskers. Because the Parsnp pipeline re-ports core SNPs by definition, it was excluded from Figure 5.6B (pairwise differences in total SNPs). For quantification of pair-wise differences in the total number of SNPs (Figure 5.6B), all sites with more than one unique character were included. . . 167
5.7 Comparison of core SNP positions reported by five
variant-calling pipelines for 30 emetic group IIIB. cereusgroup outbreak
isolates. Ellipses represent each pipeline, all of which used the
chromosome of emetic group III B. cereus AH187 as a reference
5.8 Maximum likelihood phylogenies of 30 emetic group III isolates
(ST 26) sequenced in conjunction with a B. cereus outbreak, as
well as all other emetic group III ST 26 genomes available in
NCBI (n = 25; shown in black). Trees were constructed using
core SNPs identified using (A) kSNP3 or (B) Parsnp. Tip labels in maroon and teal correspond to the six human clinical iso-lates and 24 isoiso-lates from food sequenced in conjunction with this outbreak, respectively. Branch labels correspond to boot-strap support percentages out of 1,000 replicates. Due to the short lengths and low bootstrap support of branches within the outbreak clade, bootstrap support percentages are not shown on branches within the outbreak clade. . . 170
CHAPTER 1
INTRODUCTION1
1FROM WIEDMANN, MARTIN AND LAURA M. CARROLL (2019).
1.1
Next-Generation Sequencing: an Overview
Next-generation sequencing (NGS) encompasses sequencing technologies that are capable of sequencing many DNA strands in parallel, resulting in higher throughput than can be achieved using Sanger sequencing. As NGS has become cheaper and more accessible, it has been used to address an expanding range of biological problems, including many relevant to food safety and quality.
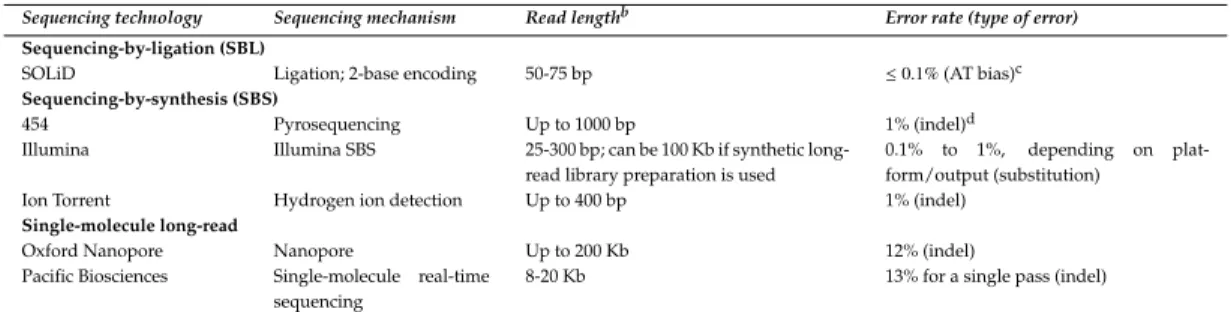
Contemporary NGS sequencing platforms employ either a (i) short-read, or (ii) long-read sequencing approach (Table 1.1). Short-read sequencing ap-proaches typically yield read lengths of up to 700 base pairs (bp), which tend to be shorter than those produced by Sanger sequencing (Goodwin, McPher-son, and McCombie 2016; Liu et al. 2012). Currently, sequencing-by-synthesis approaches (SBS) to NGS are the dominant paradigm in short-read sequencing. These approaches (e.g. Illumina sequencing, Roche 454 pyrosequencing, Ion Torrent semiconductor-based sequencing) rely on the use of DNA polymerase in their respective methods (Goodwin, McPherson, and McCombie 2016). SBS approaches to short-read sequencing can be contrasted with the sequencing-by-ligation (SBL) approach employed by the SOLiD (Small Oligonucleotide Liga-tion and DetecLiga-tion) platform, which employs DNA ligase to join fluorescently-labelled probe and anchor sequences to a DNA strand (Goodwin, McPherson, and McCombie 2016). Among the SBS approaches and short-read sequencing methods as a whole, Illumina sequencing has emerged as the dominant tech-nology (Goodwin, McPherson, and McCombie 2016), in which fluorescently-tagged nucleotides are added in complement to amplified strands of DNA. Upon the addition of a single nucleotide, the fluorescent dye is imaged, and the identity of the corresponding base is recorded (Goodwin, McPherson, and
McCombie 2016).
Table 1.1: Overview of next-generation sequencing technologies discussed in
this chapter.a
Sequencing technology Sequencing mechanism Read lengthb Error rate (type of error)
Sequencing-by-ligation (SBL)
SOLiD Ligation; 2-base encoding 50-75 bp ≤0.1%(AT bias)c
Sequencing-by-synthesis (SBS)
454 Pyrosequencing Up to 1000 bp 1% (indel)d
Illumina Illumina SBS 25-300 bp; can be 100 Kb if synthetic
long-read library preparation is used
0.1% to 1%, depending on
plat-form/output (substitution)
Ion Torrent Hydrogen ion detection Up to 400 bp 1% (indel)
Single-molecule long-read
Oxford Nanopore Nanopore Up to 200 Kb 12% (indel)
Pacific Biosciences Single-molecule real-time
sequencing
8-20 Kb 13% for a single pass (indel)
aSummarized from reviews of NGS technologies by Goodwin et al., Liu, et al., and Glenn
(Goodwin, McPherson, and McCombie 2016; Liu et al. 2012; Glenn 2011)
bbp, base pairs; Kb, kilobase pairs.
cAT, adenine and thymine.
dindel, insertion/deletion.
While short-read sequencing technologies have been the workhorse of NGS, they are not without limitations; many genomic features, such as long, repetitive regions or copy number variations, cannot be readily resolved using short reads (Goodwin, McPherson, and McCombie 2016). Long-read sequencing technolo-gies have been able to bridge the literal gaps that their short-read counterparts have been unable to resolve, relying on either (i) synthetic long-read approaches or (ii) single-molecule long-read sequencing approaches (Pacific Biosciences and Oxford Nanopore) (Goodwin, McPherson, and McCombie 2016). Synthetic long-read sequencing approaches employ existing short-read sequencing plat-forms, but use barcoding during library preparation to link fragments (Good-win, McPherson, and McCombie 2016). Single-molecule long-read sequencing approaches, however, yield ”true” long reads that can span kilobases, with the approach most commonly employed as of late 2017 being the Pacific Biosciences (PacBio) single-molecule real-time (SMRT) approach (Goodwin, McPherson, and McCombie 2016). SMRT sequencing uses a DNA polymerase fixed to the bottom of a well in a specialized flow cell through which a DNA strand is
tion of a single, fluorescently-labelled nucleotide by the polymerase, light is emitted and recorded by a camera to determine the identity of the nucleotide (Goodwin, McPherson, and McCombie 2016). This can be contrasted with the aforementioned short-read SBS approaches, which rely on DNA polymerase traversing the DNA template to which it is bound (Goodwin, McPherson, and McCombie 2016). In addition to the PacBio platform, the small and highly portable MinION platform from Oxford Nanopore Technologies also employs a single-molecule long-read sequencing approach, during which a strand of DNA is passed through a protein pore along with an electric current (Goodwin, McPherson, and McCombie 2016). As different combinations of nucleotides are passed through the pore, shifts in the electric current are recorded (Goodwin, McPherson, and McCombie 2016).
Long-read sequencing is becoming increasingly popular for many appli-cations, including gap closure in reference genomes, characterization of long genomic structures, and the generation of closed chromosomes or transcrip-tomes (Goodwin, McPherson, and McCombie 2016). A notable considera-tion when comparing short-read and long-read sequencing methods is the rel-atively high error rates of long-read sequencing platforms (Goodwin,
McPher-son, and McCombie 2016). For example, the PacBio RS II, which yields
average read lengths of 10-15 Kb, has an error rate as high as 15% for a single pass through a molecule of DNA (Goodwin, McPherson, and Mc-Combie 2016). However, this error rate can be reduced to one that rivals that of Sanger sequencing by increasing sequencing coverage through
mul-tiple passes; after 30 passes (i.e. at 30X coverage), the accuracy of the
consensus is greater than 99.999% (http://www.pacb.com/smrt-science/smrt-sequencing/accuracy/ and
https://www.pacb.com/uncategorized/a-closer-look-at-accuracy-in-pacbio/) (Goodwin, McPherson, and McCombie 2016).
1.2
NGS Data Analysis
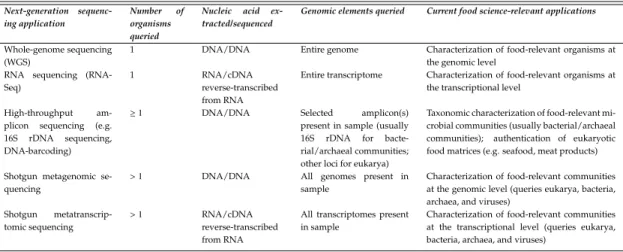
Processing and analysis of NGS data is dependent on the sequencing technol-ogy used, as well as the experimental goals. Regardless of sequencing method or experimental design, the first steps in the analysis of NGS data usually in-volve an assessment of read quality, using metrics such as the total number of reads, the distribution of read lengths, sequence quality scores, etc. This can be followed by trimming of adapters and/or quality bases, filtering out low-quality reads, and filtering of contaminant DNA, steps for which a number of programs are available (Breitwieser, Lu, and Salzberg 2017). After these pre processing steps, data analysis can be carried out according to the goals of the experiment, with possible food science-relevant applications discussed below (Table 1.2).
Table 1.2:Overview of food science-relevant next-generation sequencing
appli-cations discussed in this chapter.
Next-generation
sequenc-ing application
Number of
organisms queried
Nucleic acid
ex-tracted/sequenced
Genomic elements queried Current food science-relevant applications
Whole-genome sequencing (WGS)
1 DNA/DNA Entire genome Characterization of food-relevant organisms at
the genomic level RNA sequencing
(RNA-Seq)
1 RNA/cDNA
reverse-transcribed from RNA
Entire transcriptome Characterization of food-relevant organisms at
the transcriptional level
High-throughput
am-plicon sequencing (e.g.
16S rDNA sequencing,
DNA-barcoding)
≥1 DNA/DNA Selected amplicon(s)
present in sample (usually
16S rDNA for
bacte-rial/archaeal communities; other loci for eukarya)
Taxonomic characterization of food-relevant mi-crobial communities (usually bacterial/archaeal
communities); authentication of eukaryotic
food matrices (e.g. seafood, meat products)
Shotgun metagenomic se-quencing
>1 DNA/DNA All genomes present in
sample
Characterization of food-relevant communities at the genomic level (queries eukarya, bacteria, archaea, and viruses)
Shotgun
metatranscrip-tomic sequencing
>1 RNA/cDNA
reverse-transcribed from RNA
All transcriptomes present in sample
Characterization of food-relevant communities at the transcriptional level (queries eukarya, bacteria, archaea, and viruses)
1.3
NGS Applications: Whole-Genome Sequencing of
Micro-bial Contaminants
Traditionally, microbial contaminants isolated from food undergo various organism-specific phenotypic or biochemical tests (e.g. testing for motility, toxin production, growth at various temperatures) to elucidate or confirm their iden-tity (FDA 1998). These tests may be supplemented with additional typing methods, such as serotyping, pulsed-field gel electrophoresis (PFGE), Sanger sequencing of a single taxonomic marker gene or genomic region (i.e. single-locus sequence typing; SLST), or Sanger sequencing of multiple loci used in a multi-locus sequence typing (MLST) scheme (Kovac et al. 2017; Sabat et al. 2013). However, the per-isolate cost of whole-genome sequencing (WGS) has decreased to the point at which it is comparable, and even below, the price of many of these traditional subtyping methods (Kovac et al. 2017), making it an increasingly popular method for characterizing microbial contaminants isolated from food matrices, food-associated environments (e.g farm environments, pro-cessing environments), and, in the case of pathogenic microbes, from hosts (e.g. in human- or animal-clinical settings) (Kovac et al. 2017). Furthermore, many of
these typing methods (e.g. serotyping, SLST, MLST) can be performedin silico
using WGS data, with the advantage that one can query the majority of a
micro-bial genome from a single data set, rather than just a small fraction of it (< 0.01%
for a traditional 7-gene MLST scheme) (Kovac et al. 2017). In addition toin
sil-ico subtyping, WGS data from microbial contaminants can be used to predict
functional characteristics of isolates, query genes or genomic elements of inter-est within a genome (e.g. plasmids, bacteriophage, and genes contributing to antimicrobial resistance or virulence), and, in the case of pathogenic
microor-ganisms, detect and track outbreaks (Kovac et al. 2017).
After sequencing the genomic DNA and pre-processing the resulting reads from a microbial isolate (see ”NGS Data Analysis” section above), possible
anal-ysis steps that may be taken include (i) de novogenome assembly of the reads
into contiguous stretches of sequence (contigs) (Giordano et al. 2017; Liao, S.-H. Lin, and H.-H. Lin 2015; Ekblom and Wolf 2014), (ii) mapping reads back to a reference genome, (iii) identifying single-nucleotide polymorphisms (SNPs), in-sertions, and deletions (indels) in NGS data through variant calling (Olson et al. 2015), (iv) constructing phylogenetic trees to assess the evolutionary relation-ship of multiple isolates, (v) assigning allelic types at a genomic scale using core genome or whole genome multi-locus sequence typing (cgMLST and wgMLST, respectively), and (vi) locating genes and features in NGS data via genome an-notation (Richardson and Watson 2012; Mudge and Harrow 2016; Yandell and Ence 2012). These data can be used to characterize isolates at high resolution, making it possible to compare isolates geospatially and temporally at the whole-genome scale.
WGS is becoming an increasingly valuable tool for characterizing microbial contaminants, particularly pathogens, isolated from food and food processing environments. A notable example of the utility of WGS can be seen in the
multi-agency collaboration in the US to sequence all Listeria monocytogenes isolates
from human patients, food, and the environment (Jackson et al. 2016). Since its implementation in 2013, the WGS-based surveillance program detected more listeriosis clusters and solved more outbreaks each year, relative to the previous
year (Jackson et al. 2016). Similar findings have been seen for Salmonella
En-teritidis from clinical and environmental sources allowed isolates from known outbreaks to be differentiated from sporadic isolates at greater resolution than PFGE (Taylor et al. 2015). These examples showcase how WGS can be used to not only characterize foodborne pathogens at high resolution, but also the outbreaks associated with them.
1.4
NGS Applications: RNA Sequencing (RNA-Seq) of
Food-Relevant Organisms
While WGS can be used to characterize the genome of an organism at unprece-dented resolution, it offers no information on whether a genomic element of in-terest is being actively transcribed or not. This is particularly important within a food safety context; for example, the mere isolation of a pathogen from a food matrix does not necessarily mean that particular isolate is viable, or that it is transcribing the genes necessary to cause infection or intoxication in a human host. Traditionally, quantitative reverse-transcription PCR (RT-qPCR) has been employed to quantify or detect shifts in transcript levels of loci of interest. For this method, reverse-transcription PCR (RT-PCR) is used to obtain complemen-tary DNA (cDNA) from a RNA template, and the resulting cDNA can be quan-tified using quantitative PCR (qPCR). In a food science context, RT-qPCR has been proposed as a method for detecting viable microorganisms, quantifying virulence, toxin, or stress response gene transcription, and quantifying micro-bial growth in food matrices (Postollec et al. 2011; Carroll et al. 2016). Studying transcription at a genome-wide scale, however, was made possible with cDNA microarrays, which have been used to study the stress responses of various
foodborne pathogens, as well as their transcription of toxin and virulence genes (Postollec et al. 2011; Roy and Sen 2006; Rasooly and Herold 2008). As NGS has become more feasible, however, it is now possible to query the transcrip-tome of an organism in its entirety at low cost: RNA sequencing (RNA-Seq) employs NGS technologies to sequence cDNA reverse-transcribed from RNA that has been extracted from an organism of interest (Z. Wang, Gerstein, and Snyder 2009). RNA-Seq allows one to quantitatively survey transcribed regions of an entire genome, improving upon microarrays in both cost and flexibility (i.e. the ability to characterize any organism that can be sequenced, rather than relying on the availability of an array for a particular organism), which is par-ticularly valuable for studying organisms or genomic regions that may not be well-characterized.
After employing NGS to sequence cDNA from an organism of interest, and determining that the quality of sequencing reads is adequate, reads are usually aligned to a reference genome or an assembled transcriptome (McClure et al. 2013; Conesa et al. 2016). After assessing mapping quality and determining that it is appropriate, reads mapping to various genes or genomic regions can be quantified and normalized, taking into account biases such as gene length (Mc-Clure et al. 2013; Conesa et al. 2016). After quantification and normalization, analyses can be carried out according to the experimental goals (e.g. differen-tial transcription under various conditions). Within the realm of food safety, RNA-Seq has been applied to pathogenic and toxin-producing microorganisms to identify differentially-transcribed genes during growth in various food ma-trices (Tang et al. 2015; Deng, Z. Li, and W. Zhang 2012; Galia et al. 2017), after exposure to various stressors (e.g. acid, starvation, or antimicrobial stressors) (F. Zhang et al. 2014; Casey et al. 2014; Butcher and Stintzi 2013; K. Jia et al.
2017), and during the infection of a host (Avraham et al. 2016).
1.5
NGS Applications: High-Throughput Amplicon
Sequenc-ing
WGS and RNA-Seq have allowed food-associated microorganisms to be charac-terized at unprecedented resolution. However, these methods typically require the microorganism in question to be in pure culture or isolated via culture-based methods, a process which involves the use of organism-specific enrichment me-dia, selective meme-dia, and isolation protocols (Kovac et al. 2017). Metagenomics, which involves sequencing DNA directly from an environmental sample, at-tempts to bypass the isolation step, making it possible to survey an entire com-munity simultaneously (Kovac et al. 2017).
Until recently, NGS-based metagenomic methods have primarily involved high-throughput amplicon sequencing. Also referred to as ”metataxonomics”, ”meta-genetics”, or ”marker gene metagenomics”, high-throughput amplicon sequencing employs NGS technologies to sequence targeted PCR products (am-plicons) to characterize particular communities. When surveying bacterial and archaeal communities, the 16S ribosomal DNA gene (16S rDNA) is usually the amplicon of choice, as it is present in all bacterial and archaeal species. 16S rDNA sequencing has been used to survey the microbiota of various foods (De Filippis, Parente, and Ercolini 2016; Kergourlay et al. 2015; Ercolini 2013), in-cluding fermented foods (De Filippis, Parente, and Ercolini 2016) and food matrices subjected to pathogen-specific enrichments (Jarvis et al. 2015; Lusk et al. 2012), as well as to monitor bacterial community shifts in food processing
environments (Stellato et al. 2016; Hultman et al. 2015).
One of the strengths of 16S rDNA amplicon sequencing is that there are many freely available bioinformatic tools and pipelines available for data anal-ysis and visualization of results (e.g. QIIME, Mothur). A typical workflow for analyzing NGS data from high-throughput 16S rDNA experiments may include pre-processing of the raw reads, clustering of sequences into operational taxo-nomic units (OTUs) based on sequence similarity, and taxotaxo-nomic assignment of sequences using a database of 16S rDNA genes (e.g. RDP, Greengenes, SILVA) (Oulas et al. 2015; Siegwald et al. 2017).
In addition to querying bacterial and archaeal communities, the same prin-cipals of amplicon sequencing can be applied to characterize eukarya. DNA-barcoding, a practice in which a specific region of a genome is sequenced, is a commonly-used method for food matrix authentication along the food sup-ply chain (Ellis et al. 2016; Galimberti et al. 2013). For this approach, a genetic marker (i.e. a ”barcode”) present in a range of taxa, but variable enough to be ca-pable of discriminating between taxa of interest, is sequenced (Galimberti et al. 2013), similar to the way the 16S rDNA gene is used to survey bacterial/archaeal communities. When querying animal DNA in a matrix (e.g. for seafood or
meat authentication), the cytochrome b (cytB) and cytochrome c oxidase
sub-unit 1 (COI) genes are common amplicons of choice. For fungi, the internal
transcribed spacer (ITS) region of the genome is the locus of choice (Schoch et al. 2012), while a number of loci have been proposed for querying plant DNA present in a matrix (Hollingsworth, Graham, and Little 2011; Hollingsworth, D.-Z. Li, et al. 2016). The sequences of these genes are then compared to the barcodes of known taxa, such as those found in the Barcode of Life Database
(BOLD) (Ratnasingham and Hebert 2007) or the National Center for Biotechnol-ogy Information’s (NCBI) GenBank database (Benson et al. 2013). Applications of DNA-barcoding within the realm of matrix authentication and contaminant detection along the food supply chain have included authentication of and con-taminant detection in seafood (Carvalho, Palhares, Drummond, and Frigo 2015; Armani et al. 2015; Pardo, Jimenez, and Perez-Villarreal 2016; Kim et al. 2015; Chang et al. 2016; Carvalho, Palhares, Drummond, and Gadanho 2017), meat (Kane and Hellberg 2016; Hellberg, B. C. Hernandez, and E. L. Hernandez 2017; Naaum et al. 2018), poultry (Hellberg, B. C. Hernandez, and E. L. Hernandez 2017), dairy products (Galimberti et al. 2013), olive oil (Kumar, Kahlon, and Chaudhary 2011), and spices (Swetha et al. 2017; De Mattia et al. 2011; Galim-berti et al. 2013).
Until recently, DNA-barcoding was limited by the low-throughput that Sanger sequencing provides; however, NGS has emerged as a low-cost, high-throughput alternative (Ellis et al. 2016; Shokralla et al. 2014) that has been used for characterizing both raw ingredients and processed foods (Galimberti et al. 2013). In this high-throughput approach, sequencing reads are mapped to sequences in an appropriate database (often BOLD or GenBank) after de-termining that read quality is appropriate. The proportion of reads mapping to a particular species in the database corresponds to the proportion of that particular species in the matrix. A notable example of the application of high-throughput sequencing for food matrix authentication is provided by Carvalho et al. (Carvalho, Palhares, Drummond, and Gadanho 2017), in which misla-beled cod products in Brazilian stores and restaurants were identified by
tar-geted sequencing of thecytBandCOIgenes present in processed cod products
to identifying mislabeled products, the composition of blended products com-posed of multiple fish species could be determined by sequencing the selected loci (Carvalho, Palhares, Drummond, and Gadanho 2017).
1.6
NGS Applications: Shotgun Metagenomic and
Metatran-scriptomic Sequencing
Although high-throughput amplicon sequencing has offered a higher-resolution glimpse into food and food-associated microbiomes, it has numer-ous limitations that are particularly relevant within the realms of food safety and food quality, perhaps most notably the inability to query organisms that do not possess the amplicon of choice (e.g. eukarya in a community can-not be queried if 16S rDNA amplicon sequencing is performed; see ”NGS Applications: High-Throughput Amplicon Sequencing” section above). For 16S rDNA amplicon sequencing of bacterial/archaeal communities, additional drawbacks include (i) difficulty achieving species-level resolution (Janda and Abbott 2007; Rossi-Tamisier et al. 2015) and reliably distinguishing pathogenic
bacteria from non-pathogenic species (e.g. L. monocytogenes from Listeria
in-nocua, human pathogensBacillus anthracis fromBacillus cereus and biopesticide
Bacillus thuringiensis), (ii) PCR amplification and primer bias (Brooks et al. 2015), and (iii) inability to query functionally-relevant genomic elements directly, such as virulence or antimicrobial resistance determinants (Kovac et al. 2017).
An increasingly popular alternative to amplicon sequencing is shotgun metagenomic sequencing, an approach in which all DNA present in a sample is sequenced, rather than solely an amplicon. By sequencing all DNA present in
a sample, the amplification bias and low taxonomic and functional resolution issues which plague amplicon sequencing can typically be bypassed (Kovac et al. 2017). In addition to sequencing all of the bacterial and archaeal DNA present in a sample, all viral and eukaryotic DNA is sequenced; this is partic-ularly relevant when the community of interest is derived from a eukaryotic matrix (e.g. from a host or from food), as the majority (as much as 99%) of DNA will come from the eukaryotic matrix itself (Kovac et al. 2017; Noyes et al. 2016). While large quantities of host DNA may not be a problem if the experimental goal is to assess the composition of the food matrix itself, it may hinder the se-quencing and detection of many microbial species. As a result, when extracting DNA from a matrix containing high amounts of host DNA, additional steps may be taken to deplete any background DNA originating from the matrix it-self to increase the proportion of microbial DNA that is sequenced (Kovac et al. 2017). After sequencing the extracted DNA, analysis of the resulting sequenc-ing reads is carried out accordsequenc-ing to the experimental goals, which may include taxonomic assignment (Sharpton 2014), metagenomic assembly, functional an-notation (Sharpton 2014), and/or conducting a metagenome-wide association study by associating community data with a particular phenotype (J. Wang and H. Jia 2016; Lynch and Pedersen 2016).
As with all genomic approaches, shotgun metagenomic methods can offer insight into the genomic composition of a community, but cannot offer infor-mation as to which genes are being transcribed and possibly translated and ex-pressed as protein products (Kovac et al. 2017). Similar to the way RNA-Seq can be used to complement WGS of a bacterial isolate, metagenomic approaches can be supplemented with shotgun metatranscriptomic sequencing, which in-volves sequencing cDNA reverse-transcribed from RNA (typically messenger
RNA) extracted from an entire community (Kovac et al. 2017).
Analysis of shotgun metagenomic and metatranscriptomic data usually be-gins with pre-processing steps such as assessing read quality and trimming adapters (Breitwieser, Lu, and Salzberg 2017). This can be followed by (i) as-sembly of the reads into contigs, or (ii) taxonomic or functional classification di-rectly from sequencing reads (Breitwieser, Lu, and Salzberg 2017). For a review of methods for metagenomic data analysis, see Breitwieser et al. (Breitwieser, Lu, and Salzberg 2017).
The use of shotgun metagenomic and metatranscriptomic approaches to sur-vey communities in foods has been undertaken only recently (De Filippis, Par-ente, and Ercolini 2016). Goals of these studies have included characterization of the microbiomes of various foods in the presence of foodborne pathogens and/or spoilage organisms (Jarvis et al. 2015; Ottesen et al. 2013), tracking foodborne pathogens and antimicrobial resistance genes along the food sup-ply chain (Noyes et al. 2016; Yang et al. 2016), characterizing eukaryotic food matrices composed of multiple species (Ripp et al. 2014), and characterizing the microbiomes of various food matrices during processes such as fermenta-tion (De Filippis, Parente, and Ercolini 2016; Kergourlay et al. 2015; Alkema et al. 2016; Valdes et al. 2013; Lessard et al. 2014; De Filippis, Genovese, et al. 2016; Monnet et al. 2016). A notable example of the application of shotgun meta-omics approaches to identify the cause of a food quality anomaly is provided by Quigley et al. (Quigley et al. 2016); using high-throughput 16S rDNA
sequenc-ing followed by shotgun metagenomic sequencsequenc-ing, Thermus thermophilus was
proposed (and later confirmed) to be the cause of a pink discoloration defect in Continental-type cheeses (Quigley et al. 2016).
1.7
Conclusion
NGS technologies are being employed increasingly in food science relevant realms, with applications ranging from surveying microbial communities in-volved in food processing, to rapidly characterizing bacterial isolates from food-borne outbreaks. As sequencing costs continue to decrease, it is likely that whole-genome and meta-omics approaches will be applied routinely at various points along the food supply chain.
The following chapters detail how NGS can be used to query bacterial food-borne pathogens, with an emphasis on rapid, high-throughput computational methods which can be used to analyze short-read data produced by Illumina
platforms. Two model organisms are discussed: (i) non-typhoidalSalmonella
en-terica, a widely studied Gram-negative pathogen which can be transmitted be-tween livestock and humans, as well as though food, and (ii) the lesser-queried
Gram-positive members of the Bacillus cereus group, which are spore-forming
organisms commonly isolated from soil. While both groups of organisms are capable of causing foodborne illness in humans, they differ at a biological level and, thus, necessitate different approaches to analyze NGS data derived from them.
1.8
References
Alkema, Wynand, Jos Boekhorst, Michiel Wels, and Sacha A. F. T. van Hijum
(2016). “Microbial bioinformatics for food safety and production”. In: Brief
Bioinform17.2, pp. 283–292.DOI:10.1093/bib/bbv034.
Armani, A. et al. (2015). “DNA barcoding reveals commercial and health issues
Avraham, Roi et al. (2016). “A highly multiplexed and sensitive RNA-seq pro-tocol for simultaneous analysis of host and pathogen transcriptomes”. In:
Nature Protocols11, pp. 1477–1491.
Benson, Dennis A. et al. (2013). “GenBank”. In: Nucleic Acids Res 41.Database
issue, pp. D36–D42.DOI:10.1093/nar/gks1195.
Breitwieser, Florian P., Jennifer Lu, and Steven L. Salzberg (2017). “A review of methods and databases for metagenomic classification and assembly”. In:
Briefings in Bioinformatics. DOI: 10 . 1093 / bib / bbx120. eprint:http : / / oup.prod.sis.lan/bib/advance- article- pdf/doi/10.1093/
bib/bbx120/20139928/bbx120.pdf.
Brooks, J. Paul et al. (2015). “The truth about metagenomics: quantifying and
counteracting bias in 16S rRNA studies”. In: BMC Microbiol 15, pp. 66–66.
DOI:10.1186/s12866-015-0351-6.
Butcher, James and Alain Stintzi (2013). “The transcriptional landscape of
Campylobacter jejuniunder iron replete and iron limited growth conditions”. In: PLoS One 8.11, e79475–e79475. DOI: 10 . 1371 / journal . pone .
0079475.
Carroll, Laura M., Teresa M. Bergholz, Ian M. Hildebrandt, and Bradley P. Marks (2016). “Application of a Nonlinear Model to Transcript Levels of
Upregu-lated Stress Response GeneibpAin Stationary-PhaseSalmonella enterica
Sub-jected to Sublethal Heat Stress”. In:Journal of Food Protection79.7, pp. 1089–
1096. DOI:10.4315/0362- 028X.JFP- 15- 377. eprint: https://doi.
org/10.4315/0362-028X.JFP-15-377.
Carvalho, Daniel Cardoso, Rafael Melo Palhares, Marcela Goncalves Drum-mond, and Tiago Bolan Frigo (2015). “DNA Barcoding identification of com-mercialized seafood in South Brazil: A governmental regulatory forensic
program”. In:Food Control50, pp. 784–788.
Carvalho, Daniel Cardoso, Rafael Melo Palhares, Marcela Goncalves Drum-mond, and Mario Gadanho (2017). “Food metagenomics: Next generation sequencing identifies species mixtures and mislabeling within highly
Casey, Aidan et al. (2014). “Transcriptome analysis ofListeria monocytogenes ex-posed to biocide stress reveals a multi-system response involving cell wall
synthesis, sugar uptake, and motility”. In: Front Microbiol5, pp. 68–68.DOI:
10.3389/fmicb.2014.00068.
Chang, Chia-Hao, Han-Yang Lin, Qiu Ren, Yeong-Shin Lin, and Kwang-Tsao Shao (2016). “DNA barcode identification of fish products in
Tai-wan: Government-commissioned authentication cases”. In: Food Control66,
pp. 38–43.
Conesa, Ana et al. (2016). “A survey of best practices for RNA-seq data
analy-sis”. In:Genome Biology17.1, p. 13.DOI:10.1186/s13059-016-0881-8.
De Filippis, Francesca, Alessandro Genovese, Pasquale Ferranti, Jack A. Gilbert, and Danilo Ercolini (2016). “Metatranscriptomics reveals temperature-driven functional changes in microbiome impacting cheese maturation rate”. In:Sci Rep6, pp. 21871–21871.DOI:10.1038/srep21871.
De Filippis, Francesca, Eugenio Parente, and Danilo Ercolini (2016).
“Metage-nomics insights into food fermentations”. In: Microb Biotechnol10.1, pp. 91–
102.DOI:10.1111/1751-7915.12421.
De Mattia, Fabrizio et al. (2011). “A comparative study of different DNA bar-coding markers for the identification of some members of Lamiacaea”. In:
Food Research International44.3, pp. 693–702.
Deng, Xiangyu, Zengxin Li, and Wei Zhang (2012). “Transcriptome
sequenc-ing ofSalmonella entericaserovar Enteritidis under desiccation and starvation
stress in peanut oil”. In:Food Microbiology30.1, pp. 311–315.
Ekblom, Robert and Jochen B. W. Wolf (2014). “A field guide to
whole-genome sequencing, assembly and annotation”. In: Evolutionary
Applica-tions 7.9, pp. 1026–1042. DOI: 10 . 1111 / eva . 12178. eprint: https : / /
onlinelibrary.wiley.com/doi/pdf/10.1111/eva.12178.
Ellis, David I., Howbeer Muhamadali, David P. Allen, Christopher T. Elliott, and Royston Goodacre (2016). “A flavour of omics approaches for the detection
Ercolini, Danilo (2013). “High-throughput sequencing and metagenomics: mov-ing forward in the culture-independent analysis of food microbial ecology”. In:Appl Environ Microbiol79.10, pp. 3148–3155.DOI:
10.1128/AEM.00256-13.
FDA (1998). Bacteriological analytical manual, 8th edition, 1998 and Foodborne
pathogenic microorganisms and natural toxins handbook, 1998. Gaithersburg, MD: AOAC International.
Galia, Wessam et al. (2017). “Strand-specific transcriptomes of
Enterohemor-rhagic Escherichia coli in response to interactions with ground beef
micro-biota: interactions between microorganisms in raw meat”. In:BMC Genomics
18.1, pp. 574–574.DOI:10.1186/s12864-017-3957-2.
Galimberti, Andrea et al. (2013). “DNA barcoding as a new tool for food
trace-ability”. In:Food Research International50.1, pp. 55–63.
Giordano, Francesca et al. (2017). “De novoyeast genome assemblies from
Min-ION, PacBio and MiSeq platforms”. In: Scientific Reports 7.1, p. 3935. DOI:
10.1038/s41598-017-03996-z.
Glenn, Travis C. (2011). “Field guide to next-generation DNA sequencers”. In:
Molecular Ecology Resources 11.5, pp. 759–769. DOI: 10 . 1111 / j . 1755
-0998.2011.03024.x. eprint:https://onlinelibrary.wiley.com/
doi/pdf/10.1111/j.1755-0998.2011.03024.x.
Goodwin, Sara, John D. McPherson, and W. Richard McCombie (2016).
“Com-ing of age: ten years of next-generation sequenc“Com-ing technologies”. In:Nature
Reviews Genetics17, pp. 333–351.
Hellberg, Rosalee S., Brenda C. Hernandez, and Eduardo L. Hernandez (2017). “Identification of meat and poultry species in food products using DNA
bar-coding”. In:Food Control80, pp. 23–28.
Hollingsworth, Peter M., Sean W. Graham, and Damon P. Little (2011).
“Choos-ing and Us“Choos-ing a Plant DNA Barcode”. In:PLOS ONE 6.5, e19254. DOI: 10.
Hollingsworth, Peter M., De-Zhu Li, Michelle van der Ban