Date of publication xxxx 00, 0000, date of current version xxxx 00, 0000. Digital Object Identifier 10.1109/ACCESS.2017.DOI
A Multi-scale colour and Keypoint
Density-based Approach for Visual
Saliency Detection
ALESSANDRO BRUNO1, FRANCESCO GUGLIUZZA2, ROBERTO PIRRONE3,(Member, IEEE), AND EDOARDO ARDIZZONE3.
1
NCCA (National Centre for Computer Animation) at Bournemouth University, UK (e-mail: [email protected])
2
Dipartimento di Fisica e Chimica (DIFC) - Emilio Segrè, Università degli Studi di Palermo, IT (e-mail: [email protected])
3
Dipartimento di Ingegneria, Università degli Studi di Palermo, IT (email: {roberto.pirrone, edoardo.ardizzone}@unipa.it) Corresponding author: Alessandro Bruno (e-mail: [email protected]).
ABSTRACT In the first seconds of observation of an image, several visual attention processes are involved in the identification of the visual targets that pop-out from the scene to our eyes. Saliency is the quality that makes certain regions of an image stand out from the visual field and grab our attention. Saliency detection models, inspired by visual cortex mechanisms, employ both colour and luminance features. Furthermore, both locations of pixels and presence of objects influence the Visual Attention processes. In this paper, we propose a new saliency method based on the combination of the distribution of interest points in the image with multiscale analysis, a centre bias module and a machine learning approach. We use perceptually uniform colour spaces to study how colour impacts on the extraction of saliency. To investigate eye-movements and assess the performances of saliency methods over object-based images, we conduct experimental sessions on our dataset ETTO (Eye Tracking Through Objects). Experiments show our approach to be accurate in the detection of saliency concerning state-of-the-art methods and accessible eye-movement datasets. The performances over object-based images are excellent and consistent on generic pictures. Besides, our work reveals interesting findings on some relationships between saliency and perceptually uniform colour spaces.
INDEX TERMS Eye-movements, Interest points, Saliency Map, Visual Attention
I. INTRODUCTION
T
HE human visual process starts outside the brain with the projection of the light onto the retina. The retina is a thin layer of neural tissue including the rods and cones, which are responsible for dim light and daylight vision. Thanks to the overall architecture of our visual system, we can transmit and receive up to 10 billion bits of information per second [1]. Therefore, the lack of storage capacity of our brain concerning the huge amount of information going from our eyes towards the cerebral cortex to be processed at much higher levels. However, due to the limits of our brain, we cannot simultaneously perform complex analysis on all the input visual information [1]. For a given scene, the detection of the most critical visual subset occurs as one of the most important tasks of the Human Visual System (HVS). When a person performs any visual task (watching TV, driving a car) the eyes flick rapidly from place to place to inspect the visualscene. While observing a scene, saccadic eye movements allow for the central part of the vision (fovea) to fall upon the region of interest of a picture. Vision is not uniform across our field of view, and acuity decreases with eccentricity as shown in [2]. Scientific researches also show physiological evidence proving that human brain employs visual attention to select regions from images to serialize the perception of objects [3]. Theeuwes [4] discussed evidence regarding the endogenous (goal-oriented) and exogenous (stimulus-driven) control of attention in visual tasks for observers searching for a particular visual feature such as colour, shape, or brightness.
Attention can be described as the allocation of cognitive resources to information, and it can be divided into five types constituting a hierarchical model:
• Focused attention
• Selective attention
• Alternating attention • Divided attention.
We focused exclusively on selective attention as defined in the scientific literature [5] [1] as ”the ability to selectively maintain the behavioural or cognitive resource on specific stimuli while ignoring the distracting or competing stimuli”.
As shown in [6], there is an intimate connection between visual attention and eye movements. That is the reason why investigations on the salient areas of images have become a critical topic in scientific research.
Snowden et al. [2] state that visual attention is mainly guided by two factors: bottom-up and top-down factors. Bottom-up factors are stimulus-driven, derived from the re-gions of interest that pop out from the visual scene to our eyes. Top-Down factors are more relevant to specific rules, assigned visual tasks and behavioural based goals. Regions of interest that catch human attention are highly discriminating to the centre-surround principle. Visual Saliency aims to im-itate the behaviour of HVS by predicting the fixation points of the most critical regions of an image from a perceptual point of view. Visual Saliency is a multidisciplinary branch of research; it lies on the progress achieved by different sciences such as Psychology, Neurobiology, Computer Sci-ence, Artificial IntelligSci-ence, Medicine [7]. In our work, we reveal the most salient subset of an image by setting up the corresponding saliency map. A saliency map is a grayscale map with each pixel falling in the dynamic range [0, 255]. The higher the intensity value, the more salient the location in the visual scene.
As well as visual attention approaches, visual saliency methods can be grouped into three main approaches by considering the visual feature and the visual attention process involved within the extraction of the saliency map: bottom-up, top-down, hybrid.
Visual Saliency bottom-up methods are stimulus-driven, characterized by the so-called ”visual pop-out” saliency. In these approaches, the exogenous attention is involved with the visual saliency. The centre-surround operation [8] and graph-based activation maps [9] are examples of im-plemented exogenous attention processes. These methods exploit low-level features of the images such as contrast, texture, colour, intensity to give rise to saliency maps.
Visual saliency top-down methods are based on high-level visual tasks such as text, object, face detection. In the top-down approach [10], a predefined task is given by the object category to be detected.
Hybrid methods are conceived to work on two levels: bottom-up and top-down. The former allows extracting a noisy saliency map, the latter filters out noisy regions in saliency maps created by the bottom-up layer.
We have recently concentrated our efforts on studying the performance of several visual saliency approaches about the task of the object attention. We gathered a collection of eye-fixation point maps for different object images under the name of ETTO (Eye Tracking Through Objects) [11], which
is described in greater detail in the eye-tracking datasets section. Visual selective attention includes, among others, location-based and object-based attention [12]). Still, we are interested in studying the different performances of saliency methods for both object-based and generic image datasets. We aim to analyze visual saliency performance regarding how visual attention processes select features that are part of an object. Several experiments conducted over the years showed observers prefer to make an eye movement towards the other end of the same fixated object rather than to an equidistant end of a different object. In fewer words, that is a preference to make eye shifts within the same object rather than between objects [13]. In [14] some researchers dealt with the analysis of those processes which determine whether or not an object in our environment captures our attention.
As revealed by findings and researches over the last decade [15], [16], [17], the relations between low-level features of the image and visual attention processes need to be further inspected. For this purpose, our investigations addressed the roles played by colour and scale features in detecting the visual saliency of a given image. In this regard, it is well known from the scientific literature that colour plays an essential role in the extraction of saliency maps and more generally on the overall visual attention processes [18]. Sev-eral investigations have also been conducted over the last decades on the bottom-up visual attention processes concern-ing the impact of colour, contrast, texture and multiscale local keypoints on the generation of an early saliency map on the visual cortex V1 [19]. Many past studies have emphasized the importance of borders in colour and luminance surface representations in the early visual cortex V1 [20]. Models inspired by the above aspects aim to mimic V1’s simple cell mechanisms by computing centre-surround differences with distinct colour and luminance opponency. Both CIE L*a*b* and CIE L*u*v* colour spaces employ the opponent colour encoding. Euclidean distances are used to provide the spaces with a colour-difference formula for evaluating colour differences in perceptual relevant units [21]. As revealed by Sharma et al. in [22], while CIE L*a*b* colour space lacks some sensitivity over monochromatic dark regions close to black, CIE L*u*v* colour space is shown to be more sen-sitive. We want to extract saliency maps from images fol-lowing those attentional principles representing the neuronal activities in V1 towards those areas in the brain responsible for the eye movements. In this regard, we set up a saliency extraction method which is based on the multiscale analysis of keypoint density maps over CIE L*u*v* colour space. Then we combine the saliency maps out of each channel into the final saliency map with polynomial regression trained over 100 images randomly picked up from five different eye-tracking datasets.
It is observed that most of the recent saliency detec-tion methods are based on deep learning approaches. They achieve high accuracy levels in detecting saliency maps but need high-performance systems for training and testing steps as well as a considerable number of images and the
corre-sponding eye-fixation data. We want to point out that, other than deep learning methods, we just need only a subset of eye-fixation point data to train our architecture. We do not need any optimization step because the so-called bottom-up attention processes inspire our technique. Our contribu-tions in this work are as follows: a new saliency method based on the multiscale analysis of keypoint density maps over CIE L*u*v* colour space; an extended analysis of the colour impact on the saliency extraction; a comparison study between our method and popular methods in the state-of-the-art on different eye-tracking datasets; a study case showing relationships between saliency and colour on object-based and generic image datasets.
II. RELATED WORKS
In this section, we want to report a list of state-of-the-art methods which are focused on visual saliency and taking into account both perceptual and computational sides. Further-more, we provide the paper with a subsection focused on eye-tracking datasets we employed to conduct our experimental sessions.
A. RELATED TECHNIQUES
In the first section of this paper we report saliency methods to be divided into three main groups because of the inspirational visual attention principles: bottom-up, top-down, hybrid [23]. Nowadays, a further classification of saliency techniques can be observed in the scientific literature concerning different image processing, computer vision and artificial intelligence approaches. In this regard, most of the approaches in the topic of visual saliency can be divide into traditional approaches-based and deep learning approaches-based saliency detection methods.
1) Traditional Approaches-based Saliency Detection
The traditional approaches-based Saliency Detection meth-ods are meant to be all methmeth-ods whose computation mech-anisms fall within the following models, Bayesian models [24], Cognitive models [25], Decision theoretic models [26], Spectral analysis models [27], Graphical models [28], In-formation theory models [29], Learning-based models (su-pervised learning and unsu(su-pervised learning) [30], [31]. The grouping of methods as above was first proposed in [32] and categorises saliency extraction techniques into seven groups. Itti et al. [8] proposed a bottom-up approach based on multi-scale analysis of the image. First, multi-multi-scale image features are used to create a topographical saliency map. Then, a dy-namical neural network selects the attended salient locations. The principle of centre-surround difference is adopted by Koch and Ullman [33] for the parallel extraction of different feature maps. Harel et al. [9] proposed a saliency method (well known as GBVS) based on a biologically plausible graph-based model. The leading models of visual saliency may be organized into three stages: extraction, activation, normalization. Wang et al. [34] surveyed the corresponding literature on the low-level methods for visual saliency. It is needed to mention the studies conducted by Bruce et al. [35]
on the saliency, visual attention and visual search processes. A practical method for visual saliency detection based on multi-scale and multi-channel mean has been proposed in [36]. The method applies a two-step approach based on the image decomposition and reconstruction with the wavelet transform. Then a bicubic interpolation algorithm is applied to narrow the filtered image in multi-scale. The saliency values are the distances between the narrowed images and the means of their channels. We employed interest points such as SIFT keypoints to extract saliency maps and texture scale [37]–[40]. [41] proposed a low-resolution saliency estimate based on random colour sampling. The technique presented in [42] integrate two saliency maps computed with object proposals and motion-dominated methods, to obtain a spatio-temporal saliency map. A saliency detection method based on a Kalman filter is proposed in [43], inspired by biological phenomena such as the visual surprise and the saccadic eye movement [44]. By adopting the same approach proposed in [8], each features channel is individually represented with a generated saliency map by using the Kalman filter. All of them are then combined in a final map. Kalinin et al. [45] approached the problem of localization of the most informative regions in images checking the similarity of those regions with the response of foveal filters. In cognitive top-down approaches like those proposed in [10] and [46], the visual attention process is considered task-dependent. The observer’s will and expectations play a critical role in determining why a point is fixed rather than others. Yang et al. [47] performed saliency detection with a top-down model that jointly learns a Conditional Random Field (CRF) and a visual dictionary. Kanan et al. [48] adopted the SUN framework to detect the salient regions of an image by using global features and top-down components.
Generally, hybrid systems for saliency use the combina-tion of bottom-up and top-down stimuli. In many hybrid approaches [49], a top-down layer is used to refine noisy maps extracted by bottom-up layers. A well known state-of-the-art hybrid approach was proposed by Judd et al. [30] in addition to a database [50] of eye-tracking data from 15 viewers. Low, middle and high-level features of the eye-tracking data have been used to train a model of saliency. Eye-tracking methodology is widely used for tasks such as Human-Computer Interaction [51], advertising evaluation [52] and different applications [53]–[55]. Generally speak-ing, saliency approaches are based on several properties, fea-tures and notions belonging to psychology, computer vision, neuroscience, biology and medicine. Yu et al. [56] used a paradigm based on the Gestalt grouping cues for object-based saliency detection. Chang et al. [57] proposed a method based on a graphical model of the relationships between saliency and objectness. Some methods such as in [58] and [59] approach the object detection using image descriptors and the relative orientation of the camera. Pflüger et al. [60] managed to build a method based on the optimisation of rectangle features with Adaboost to simulate eye-movements when one looks at visual artworks. Krejtz et al. [61] focused
their efforts on quantifying the eye movement transitions between different areas of interest using Shannon’s entropy and Markov chains. Toet [62] reported a comparative study that evaluates the performances of 13 state-of-the-art saliency models; and a new metric is also proposed and compared with previous models.
2) Deep Neural Network based Saliency Techniques
Over the last few years, because of their success in recog-nition and classification tasks, many researchers approached visual saliency by adopting deep learning techniques [63] and [64]. Deep learning methods allow extracting simple and complex structures in large datasets using the back-propagation algorithm to tune the representation parameters of deep neural networks. For the reasons mentioned above, visual saliency models can be learned using DCNNs (Deep Convolutional Neural Networks). For instance, Li and Yu [65] introduced a neural network architecture, containing a CNN with fully connected layers responsible for the feature extraction at different scales. Das et al. [66] tried to answer the question: do humans and deep networks look at the same regions? For this purpose, they conducted a qualitative and quantitative comparison of the maps generated with the state-of-the-art attention-based models and a task-independent saliency baseline. A fully convolutional neural network was adopted to extract the most salient regions in the method proposed by Kruthiventi et al. [67]. Zhao et al. [68] offered a survey on deep learning methods for object detection using visual saliency approaches. Obeso et al. [69] used a saliency-driven approach to predict visual attention in images and use it to train a Deep Convolutional Neural Network. Huang et al. [70] proposed a method based on the adaptation of deep neural networks. Apart from the fully convolutional neural networks, generative adversarial networks are used by Pan et al. [71] to predict visual saliency. Other than in [67] and [71], Liu et al. [72] adopted a different deep learning paradigm called long-term recurrent convolutional network for the saliency detection. Cornia et al. [73] proposed a saliency map method based on deep learning technique achieving excellent results for the accuracy metrics. The saliency prediction incorporates a network focusing on appropriate locations of the image to refine saliency features. Klein and Frintop [74] employed the centre-surround difference as a means to detect saliency maps from pictures. Kümmerer et al. [75] proposed the so-called DeepGaze model to predict where people look in images. Other than other saliency models that use deep learning techniques, the authors did not employ additional fine-tuning, the saliency extraction relies on a transfer learn-ing over the last layers of the network stack. They also [76] gave a detailed description of the high and low-level contributions to fixation points during the visual attention processes, which are necessary to build up a model for the visual saliency. Niu et al. [77] explored the connections of visual salience and emotional salience on eye movement be-haviour to evaluate their influence on gaze allocation in scene viewing. Liu et al. [78] proposed a pixel-wise contextual
attention network (PiCANet) which learns to attend to infor-mative context locations for each pixel selectively. PiCANet has also been incorporated with the U-Net architecture to detect salient objects. A saliency detection framework using multi-cue and high-level differences is proposed in [79]. In greater detail, visual information is grouped into multi-cues vectors to discard the non-salient regions and highlight the salient area. Zeng et al. [80] proposed a unified framework to train saliency detection models with diverse weak super-vision sources to overcome issues characterizing saliency maps achieved with a single weak supervision source. Other very popular methods in [81], [82] and [83] are based on unsupervised approaches. Eye Movement predictions in 360 Degree Images has emerged lately as a new hot topic in the field of visual saliency, Zhu et al. [84] employ spherical harmonics to extract features at different frequency bands and orientations to detect the rare components in the frequency and colour domain. Some 2D visual saliency approaches and methods can be integrated to explore and predict head and eye movement for 360 degree images [85].
B. EYE-TRACKING DATASETS
Eye-tracking technology offers a direct measure of visual attention by recording two kinds of eye movement, fixations and saccades [86]. Eye-tracking is widely used in many different tasks such as the analysis of user behaviour in mar-keting, advertising effectiveness evaluation, neuroscience, human-computer interaction, gaming, medicine, visualiza-tion research and other related disciplines [87] [88]. Fixa-tions indicate where the observer looks, while saccades are movements between two fixations. Saccades and fixations together form the scan path whose data are used to show which regions of an image catch the observer attention. Scan paths can also be considered as key to estimations of cognitive processes during the so-called "free viewing" and task-oriented observations [89].
Eye-tracking technology has improved through the years with the introduction of more accurate instruments and more reliable equipment. Eye-tracking methods can be grouped into four generations [86]:
• First generation - Eye-in-head measurement of the eye consisting of techniques such as scleral contact lens/search coil, electro-oculography
• Second generation - Photo and video-oculography • Third generation - Analog video-based combined
pupil/corneal reflection
• Fourth generation - Digital video-based combined
pupil/corneal reflection, augmented by computer vision techniques and digital signal processors (DSPs). The eye-trackers of the fourth generation that have recently appeared on the market make use of digital optics.
Eye-tracking technology improved its performance in us-ability, accuracy, and speed by equipping trackers with on-chip Digital Signal Processors (DSPs).
al-lowed scientific researchers to collect large quantities of eye-gaze data for different purposes.
Bappy et al. [90] collected a dataset named EyeCrowd by recording the eye movements of 16 subjects watching images with various levels of crowd. Judd et al. [30] created the MIT dataset, composed of 1003 landscape and portrait images and the corresponding fixation point maps, collected during a free viewing session.
Some recent datasets, such as those collected in [91] and [92], are respectively focused on domains like visual saliency in low-resolution images and web pages.
Ramanathan et al. [93] focused on the eye-tracking of face, portrait, nude, action, affect-variant groups giving rise to a dataset composed of 99 fixation point maps. The datasets above are collected during free viewing sessions, that is, the subjects were not assigned any specific visual task when watching. On the other hand, task-driven eye-tracking data are found in [94].
A very popular fixation point dataset containing 2000 images from 20 different categories has been proposed by [95]. Some research groups focused their efforts on gathering eye-movement data from cohort of people affected by some cognitive disorders such as ASD (Authism Spectrum Disor-der) [96], [97], [98].
Along with new topics as the prediction of head and eye-movements in 360-degree images and the recent emerging augmented reality (AR) saliency technique, new data have been gathered to assess the effectiveness of saliency ap-proaches [85]. [99].
In our previous work [40] we used an eye-tracker to record the gaze path of 24 observers while viewing each image from a subset of OPED (Object Pose Estimation Database) [100], [101]. It gave rise to a new dataset provided with fixation point maps we made publicly available under the name of ETTO (Eye Tracking Through Objects) [11]. The primary purpose of ETTO is to investigate the relationships between saliency and object visual attention processes. Each image was shown at full resolution for three seconds, separated by one second of viewing a grey screen (we adopted the same experimental approach as in [30]). The database collected in [100], [101] consists of several images with single objects in the foreground and a homogeneous coloured background region. Still, any dataset with a single main object (target) and a limited number of distractors in each image would have been appropriate as well. During the experimental session, viewers sat at a distance of 70 cm from a 22-inch computer screen with a resolution of 1920 x 1080 pixels. ETTO has been used here to assess the effectiveness of saliency methods based on different computational and perceptual approaches concerning the object attention process. Here ETTO is also used to assess the perceptually uniform space colours as CIE L*a*b* and CIE L*u*v* .
III. METHODS
I
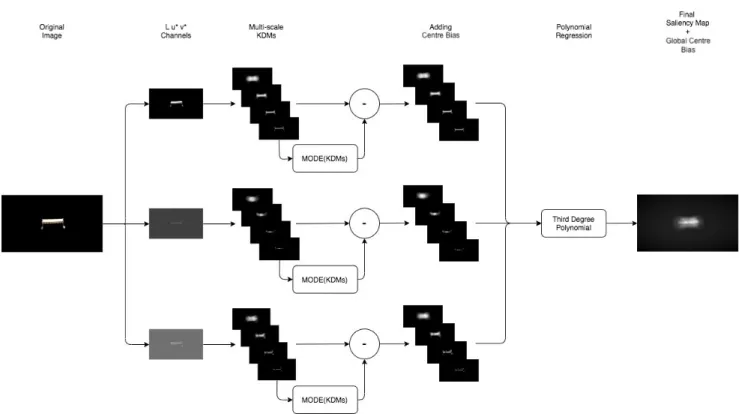
N this section, we report our findings and studies with some methodological novelties based on colour features and new multiscale inspection. Here we would like to high-light that we develop methods for the extraction of saliency with pattern recognition and image processing techniques taking into account biologically inspired principles. The in-terest points we mentioned in the introduction section are extracted near spikes, borders, edges, contours of objects in the image and go under the name of keypoints. We take inspiration by the bottom-up visual attention processes about the impact of colour, contrast, texture and multiscale local keypoints on the generation of an early saliency map on the visual cortex V1. In the next two subsections we give a more detailed description of the most important steps of our proposed method, that is, the extraction of KDMs (Keypoint Density Maps), the Training of Polynomial Regression and extraction of Saliency Maps.A. EXTRACTION OF KEYPOINT DENSITY MAPS
The overall architecture of our new proposed saliency ex-traction is based on the extension of our Keypoint Density Maps (KDMs) [37], [39], [40]. Our method projects KDMs onto a more biologically inspired multiscale architecture. Furthermore, we combine it with a centre bias module and a polynomial regression (see Fig. 1). The saliency map is then extracted using CIE L*a*b* and CIE L*u*v* space colour to assess the impact of colour on visual saliency.
We start this section by describing the full scheme behind KDMs as we already proposed [39]. The Keypoint Density MapKDMc,k is built by counting the number of keypoints inside a sliding window of varying size k = 1,2, . . . , kmax in each colour channel c. Given that mc,k is the “mode” that is the most frequent value in KDMc,k, we define the mode vectorM Vc = [mc,1, . . . , mc,kmax]for all the KDMs
computed for channelc.
In the past, to improve the effectiveness of our algo-rithm, we added colour information [40] from two colour spaces such as HSV, and CIE L*a*b*. Experimental evidence showed several drawbacks of HSV. We did not notice the im-provements we expected by adding HSV colour information. Scientists noticed that HSV is not biologically inspired and does not take into account the colour opponent process [102]. The higher performance achieved through the use of CIE L*a*b* space prompted us to undertake a more in-depth investigation on perceptually uniform colour spaces (CIE L*a*b*, CIE L*u*v*) to assess the effectiveness of their employments in the eye-movement predictions and spot any differences among them in their contribution to the visual saliency detection.
In this work, we compare the performances of SIFT and SURF keypoint detectors when extracting saliency maps with KDMs method. Furthermore, we adopted two perceptually uniform colour spaces (CIE L*a*b* and CIE L*u*v*). We also improved the KDM generation and smoothing by adding a circular mask to the sliding window, and a Gaussian filter in place of the arithmetic mean filter. A multi-scale approach
FIGURE 1. Processing steps of our algorithm for an image in the ETTO data set.
was implemented and will be explained below. As a conse-quence, in the following equations c can be considered as taking values in either{L, u∗, v∗}or{L, a∗, b∗}.
Local keypoints are extracted on each channel of the colour space, then KDMs are computed as a measurement of the spatial distribution of keypoints over the entire image. KDM algorithm needs a scale factor to work: this parame-ter is a function of the size of the image [40].
The spatial distribution of keypoints gives a measure of the behaviour of texture inside the image. Texture allows to read the response of the image concerning several features such as contrast, scale, orientation, edges, object boundaries. According to our method, we extract salient regions by emphasizing rare events in textured areas. One of the basic concepts is that the spatial distribution of keypoints inside an image allows for describing texture variations all over the image. In our previous works, we applied this principle by using SIFT keypoints only on grayscale images (the stan-dard SIFT algorithm [103] is suitable for grayscale images only). Encouraging results prompted us to approach a method including colour information because of its importance in cognitive terms. As mentioned above, in our previous release [40] we tried to use HSV space colour, which did not allow us to achieve the expected result improvements in both ef-fectiveness and accuracy. We focused on the extraction of saliency maps by using KDMs in all the three channels of two perceptually uniform colour spaces: CIE L*a*b* and CIE L*u*v*.
We extended the KDMs, used to detect the texture scale
in regular and near regular textures, to the extraction of the saliency maps of an image by applying them to all of the three colour channels. We remark that the spatial distribu-tion of keypoints inside images can be used in the texture variation description. Levels of the image roughness in both fine and coarse-textured regions can be very different. In a fine-textured area, it is expected to find a more significant number of keypoints than in coarse regions. Here we use keypoint density maps to identify the most salient areas. Once the keypoints are extracted in each colour channel c, four KDMs at different scalesk are calculated for each channel by selecting a "main" scale factor, as in (1); the other threek are selected by simply subtracting 1, 2, 3 to the mainkvalue. Ifk = 1is reached before computing all the four maps, no more maps are calculated for that channel.
k= 2 log2(min (M, N) 4 ) (1) Here,M andN are the image dimensions.
B. POLYNOMIAL REGRESSION AND SALIENCY MAP
For each KDM, a Saliency Map SMc,k is computed at each scale kfor each colour channelc by taking the point-wise difference between the KDM c, kand its mode value M Vc[k]≡mc,k.
SMc,k(x, y) =|KDMc,k(x, y)−M Vc[k]| (2) Each SM obtained using (2) is multiplied with a centre bias map (Fig. 1); we call SMc,kcb the SM at scale k for each channelcafter the application of the centre bias.
Inspired by the fact that human gaze patterns follow a normal distribution in the natural viewing condition [104] we combined the saliency maps out of the keypoint density maps by using polynomial regression in the 2D subspace. In order, the twelve saliency maps (3 channels×4scales) are passed to a third-degree polynomial without mixed terms to perform pixel-by-pixel multi-channel and multi-scale fusion, as shown in (3). SM(x, y) =a0+ X c 4 X k=1 3 X l=1 ac,k,l SMc,kcb(x, y)l (3) We also added a global centre bias to tackle the human-gaze centre bias, that is, a simple Gaussian blob centred in the middle, as described by [30].
IV. EXPERIMENTAL RESULTS
I
N this section, we compare our saliency methods to both traditional and more modern techniques based on deep learning, using our dataset and generic image data sets. We show the performance of our approach with various image types enclosed in generic data sets, as emotional photos, landscapes, hand-drawn sketches, etc. The visual attention data sets we used for this study, all accompanied by eye-tracked fixation locations, are the following:• ETTO (Eye-Tracking Through Objects - our data set) [40]
• MIT1003 [30]
• MIT CAT2000 (limited to the fixation maps of only 18
users) [95]
• FIGRIM Fixation Dataset [105]
• EyeCrowd [106].
The saliency algorithms used for comparison are the fol-lowing:
• Our new multi-scale CIE L*u*v* SURF-based method
• Our legacy CIE L*a*b* SIFT-based method [40] • Itti-Koch-Niebur [8]
• GBVS [9]
• ConvLSTM-based Saliency Attentive Model with a
VGG-16 network (SAM-VGG) [73]
• ConvLSTM-based Saliency Attentive Model with a ResNet-50 network (SAM-ResNet) [73]
• Ensembles of Deep Networks (eDN) [31].
We also report the performance of a fixed centred Gaus-sian distribution as a baseline and choose Normalized scan path Saliency (NSS) as our comparison metric. NSS is well balanced and binarization-independent [1]; we report other metrics [107] to show the improvements and the effectiveness of our method better.
The Itti-Koch-Niebur algorithm we chose for comparison is an enhanced version released with the GBVS Toolbox [108], which also contains the official GBVS code. The reference implementations of ConvLSTM-based and eDN models have been downloaded respectively from [109] and [110]. All the algorithms reported above have been used with their default parameters. As explained in the previous section,
the main scale factorkin our method is computed according to equation (1), while the coefficients of the polynomial in equation (3) are learned through the regression.
The whole algorithm has been implemented in MathWorks MATLAB, the polyfitn toolbox [111] has been used to per-form the regression and evaluate the polynomial. All the saliency maps have been calculated on an Intel Core i7-4770 computer with four cores (8 threads) and 16 GB of RAM without the use of GPU computing. On average, the execution time required to calculate the saliency map of a 1920x1080 RGB image is 15.4071 s. The algorithm runs as a single thread without any GPU assistance, and it could be speeded up taking advantage of faster mathematical libraries, multiprocessing and GPU computation).
Our main research goal was not to create a robust saliency detector. Rather, we were aimed at investigating the impact of perceptually uniform colour spaces such as CIE L*a*b* and CIE L*u*v* on the extraction of saliency maps. So we deliberately stressed our method using both a small train-ing set and reduced computational power. We used all the five ground truth data sets composed of real fixation maps already presented in this section. Our training set is made by 100 images that is 20 randomly selected samples from each data set, while tests have been carried out on the entire data sets. A 10-fold cross-validation was used for training, and the best model has been selected. During training, the multi-scale maps have been pre-weighted with a centre bias map and scaled to the same spatial resolution (512 x 512) before passing them as an input to the polynomial. The only hyper-parameter in our regression model is the degree of the polynomial. We adopted a greedy approach in this respect, trying degrees from 3 to 5. As it was expected, both degree 4 and 5 produced overfitting, and we resorted to a third degree polynomial.
As reported in Tables 1, 2, 3, 4, 5, our method always got excellent NSS results when compared to traditional un-supervised methods on MIT1003, CAT2000 and EyeCrowd datasets, and exceeded Ensembles of Deep Networks’ NSS on the same datasets; comparable results as the other saliency methods have been achieved on ETTO dataset.
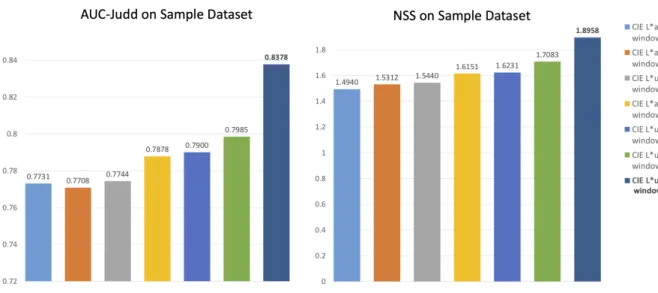
We measured the performance of our legacy algorithm on the sample dataset in both CIE L*a*b* and CIE L*u*v* spaces, with and without circular masking and Gaussian filtering. Our method on CIE L*u*v* colour space + circular masking + Gaussian filtering (see Fig. 2) reached the best results; therefore subsequent improvements were only tested on this method. More in detail, the CIE L*u*v* + SURF + centre bias algorithm performed equally or better than other variations on the sample dataset because it manages to detect salient features with a fewer number of keypoints (Fig. 2).
The performances of ”mixed” methods (CIE L*a*b* + SURF and CIE L*u*v* + SIFT) have not been reported in the tables because they were always lower than those of the method mentioned above.
In the light of the results obtained in our experiments, we recall some concepts from the scientific literature concerning
FIGURE 2. Performance graphs of different versions of our saliency model on the sample dataset.
CIE L*a*b* and CIE L*u*v* colour. It is well-known [22] that CIE L*a*b* mainly focuses on differences and common perceptual descriptors of colours.
CIE L*a*b* is considered to deal with perceptual colour differences from a numerical perspective. Some follow-ups in colourimetry occurred on CIE L*a*b* shortcomings that mainly affects the colour description in the dark regions of colour space.
In this regard, Sharma et al. [22] had already focused their attention on what they called the dark side of CIE L*a*b*, which means to highlight some of the CIE L*a*b* limitations over the perception of colour. Sharma et al. [22] conducted some experiments showing that for low lightness values (L*), corresponding to dark colour regions, perceptual differences are well represented by the CIE L*a*b* colour space. Chroma values turned out not to be computed as different even when wider bandwidths are subtracted from the Lightness values exhibiting inconsistent behaviour from a perceptual perspective. It would suggest the colour space might not to be reliable for the representation of the HVS perception of colourful regions in some cases. On the other hand, the CIE L*u*v* colour space seems not to suffer from the problems noticed in [22]. Colour differences in the perceptual domain between CIE L*a*b* and CIE L*u*v* are shown in [22] analyzing the take-off angle. It is defined as the angle comprised between the Lightness axis and the direction of a small monochromatic stimulus. CIE L*a*b* dark side is shown by take-off angles approaching 90-degrees for wave-lengths in the region from 400 to 450 nm. Conversely, CIE L*u*v* performs better when close to black, with none of the take-off angles approaching 90-degrees. The reader who may be interested in the mathematical treatment is remanded to the original cited article in [22]. The mentioned shortcoming of CIE L*a*b* might be a reasonable explanation for the bet-ter performances of the CIE L*u*v* colour space along the
edges and boundaries of single objects on a dark background like those in ETTO.
We ran many trials and experiments within our research using different kinds of images. Some of the pictures include centred objects surrounded by dark regions (ETTO dataset). We highlight that our technique is a bottom-up visual saliency approach. It runs better on object images because it tends to reproduce the bottom-up attentional mechanisms. The mentioned mechanism postulated in [3], is designed to respond to areas of high contrast and will frequently select image regions that correspond to objects. Good evidence of this can be found in the experimental results shown in Fig. 3 and Fig. 4. The sample images for the best and worst saliency maps per each dataset are shown. The best results of our method are achieved over images with a single object in the foreground or when a single visual instance sticks out from the background. On the other side, all images with multiple visual instances (see Fig. 4) or more than one object in the foreground do better suit supervised methods. However, it can be observed from tables 1, 2, 3, 4, 5 and in Fig. 2 that our method’s overall performances are consistent all over several datasets and different principle-based approaches.
V. DISCUSSION
I
N this paper, we reported our findings and research on visual saliency, introducing some methodological nov-elties concerning our previous works. We also studied the impact of perceptually uniform colour spaces such as CIE L*a*b* and CIE L*u*v* in the extraction of saliency maps. We tackled visual saliency using some biologically inspired principles like the difference centre-surround, the multiscale analysis and the human-gaze centre bias. Inspired by human gaze patterns following a normal distribution in the natural viewing condition, we also used polynomial regression in the 2D subspace to combine the saliency maps obtained atTABLE 1. Results in various metrics on ETTO dataset.
Saliency method AUC-Borji AUC-Judd CC KL1 NSS SIM
Traditional
Our new method 0.9363 0.9518 0.6844 0.8904 4.4399 0.4993
Our previous method 0.8253 0.9208 0.6982 2.0256 4.1197 0.5987
Itti-Koch-Niebur 0.9296 0.9257 0.4670 2.0465 3.1424 0.2050 GBVS 0.9344 0.9511 0.7158 0.8468 4.7342 0.5062 Gaussian centre 0.8807 0.9356 0.2080 3.2756 1.3563 0.0726 Deep Learning eDN 0.9494 0.9556 0.4171 2.3551 2.8225 0.1480 SAM-VGG 0.9089 0.9520 0.7061 0.7705 4.8767 0.5685 SAM-ResNet 0.9164 0.9534 0.7814 0.6412 4.9985 0.6134 1Lower is better.
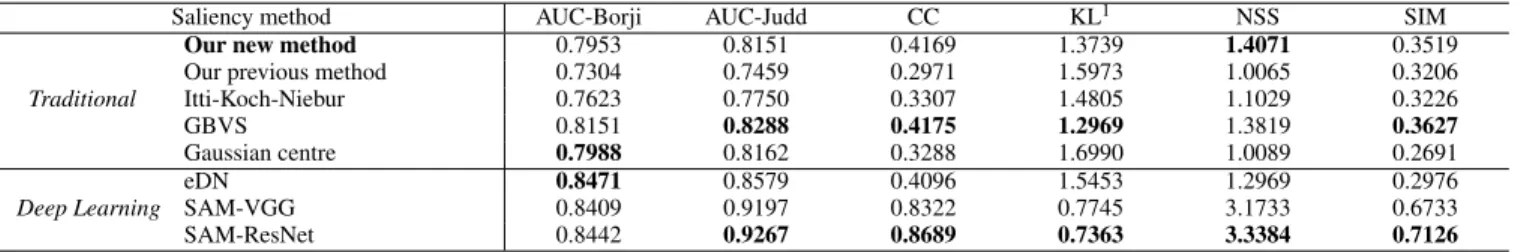
TABLE 2. Results in various metrics on MIT1003 dataset.
Saliency method AUC-Borji AUC-Judd CC KL1 NSS SIM
Traditional
Our new method 0.7953 0.8151 0.4169 1.3739 1.4071 0.3519
Our previous method 0.7304 0.7459 0.2971 1.5973 1.0065 0.3206
Itti-Koch-Niebur 0.7623 0.7750 0.3307 1.4805 1.1029 0.3226 GBVS 0.8151 0.8288 0.4175 1.2969 1.3819 0.3627 Gaussian centre 0.7988 0.8162 0.3288 1.6990 1.0089 0.2691 Deep Learning eDN 0.8471 0.8579 0.4096 1.5453 1.2969 0.2976 SAM-VGG 0.8409 0.9197 0.8322 0.7745 3.1733 0.6733 SAM-ResNet 0.8442 0.9267 0.8689 0.7363 3.3384 0.7126 1Lower is better.
TABLE 3. Results in various metrics on CAT2000 dataset.
Saliency method AUC-Borji AUC-Judd CC KL1 NSS SIM
Traditional
Our new method 0.7800 0.8005 0.4946 1.0046 1.2644 0.5073
Our previous method 0.7536 0.7660 0.4157 1.1018 1.0658 0.4850
Itti-Koch-Niebur 0.7578 0.7667 0.4131 0.9715 1.0625 0.4647 GBVS 0.7900 0.8012 0.4864 0.8615 1.2458 0.4982 Gaussian centre 0.8134 0.8363 0.4504 1.1785 1.0805 0.4021 Deep Learning eDN 0.8426 0.8510 0.4933 0.9990 1.2145 0.4477 SAM-VGG 0.7516 0.8394 0.6280 1.1121 1.7642 0.5764 SAM-ResNet 0.7619 0.8438 0.6550 1.1586 1.8256 0.5910 1Lower is better.
TABLE 4. Results in various metrics on EyeCrowd dataset.
Saliency method AUC-Borji AUC-Judd CC KL1 NSS SIM
Traditional
Our new method 0.7737 0.7842 0.4959 0.7852 1.1020 0.5144
Our previous method 0.7251 0.7333 0.3745 0.9294 0.8324 0.4742
Itti-Koch-Niebur 0.6544 0.6993 0.2786 1.0463 0.5843 0.4442 GBVS 0.7562 0.7641 0.4444 0.8420 0.9671 0.4940 Gaussian centre 0.7285 0.7373 0.3770 1.0631 0.7788 0.4242 Deep Learning eDN 0.7832 0.7902 0.4709 0.9517 1.0068 0.4552 SAM-VGG 0.7409 0.8429 0.7064 1.5619 1.8898 0.6397 SAM-ResNet 0.7495 0.8466 0.7242 1.4527 1.9682 0.6533 1Lower is better.
different scales. As it is observed in tables 1, 2, 3, 4 and 5 we compared the performance of our proposed method against several state-of-the-art methods, which are based on different approaches and principles. Since it is also our interest to study the different performances of saliency methods over several eye-tracking datasets, we collected several
experi-ments from the most popular datasets such as MIT1003, CAT2000, EyeCrowd, FIGRIM, as well as our dataset, ETTO. It is worth to mention that ETTO is a collection of fixation points on images where single objects are in the foreground. The above-mentioned step brought us to evaluate differences among many state-of-the-art methods comparing
TABLE 5. Results in various metrics on FIGRIM dataset.
Saliency method AUC-Borji AUC-Judd CC KL1 NSS SIM
Traditional
Our new method 0.7794 0.8022 0.4315 1.1692 1.2567 0.4065
Our previous method 0.7094 0.7270 0.2932 1.5519 0.8601 0.3718
Itti-Koch-Niebur 0.6700 0.7470 0.2820 1.3278 0.8220 0.3717 GBVS 0.8076 0.8197 0.4470 1.0519 1.2599 0.4300 Gaussian centre 0.8297 0.8577 0.4291 1.3717 1.1409 0.3435 Deep Learning eDN 0.8621 0.8721 0.5031 1.2348 1.3795 0.3735 SAM-VGG 0.7739 0.8699 0.6166 1.1518 2.0299 0.5373 SAM-ResNet 0.7835 0.8696 0.6242 1.1524 2.0538 0.5397 1Lower is better.
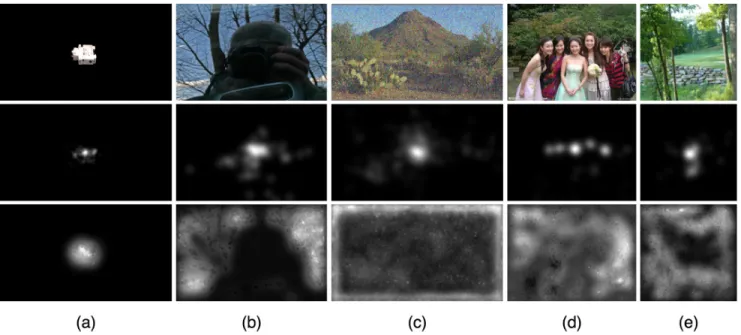
FIGURE 3. Best results per data set. First row: original images; second row: fixation maps; third row: our saliency maps. (a) ETTO:
MouseTrapBlack__Curve_030_Rot_010_fhd.png, (b) MIT1003: i2281902585.jpeg, (c) CAT2000: Object\017.jpg, (d) EyeCrowd: 498.jpg, (e) FIGRIM: sun_bcunorujjxrvnqkx.jpg.
saliency maps and fixation points. Besides, the experiments with several saliency methods on ETTO images allowed us to highlight the differences among different approaches concerning the object attention process. To show how ac-curate is the detection of the most important regions from a perceptual viewpoint, we used a method based on pattern recognition and image processing techniques. We compared the results of our approach applied to the datasets mentioned above and against the most popular methods belonging to different classes (deep learning, bottom-up, supervised, un-supervised). Some other considerations can be drawn by looking at the experimental results. Our method overcomes our previous work on all datasets we used; it reaches the best performances over ETTO, which contains object images with a dark background. We guess the reason behind the best performances over ETTO is highly related to the impact of CIE L*u*v* space colour on the saliency extraction. It seems to be more robust, especially in cases of dark coloured regions (like ETTO images). Our experiments confirm some shortcomings of the CIE L*a*b* colour space in those image
regions with low lightness values (L*), which correspond to dark background regions. Those regions are observed not to be well represented in the saliency maps in terms of percep-tual differences. A further investigation of the temporal range of the eye-movements and their correlations to the different saliency approaches would allow for a better understanding of some necessary details. It mostly concerns the impact of some visual features from the images in the first 100 millisec-onds of observation. The refinement of our experiments and comparisons along the temporal range might be useful to map the visual features of the images to the processes of visual attention both the exogenous and endogenous ones. Moving on to the artificial intelligence perspective of our work, we want to mention that only two deep learning methods (SAM-VGG and SAM-ResNet) outperform our method over the more generic image datasets (see tables 2, 3, 4, 5). All other methods’ performances such as Itti-Koch-Niebur, eDN, GBVS and our previous method’s release are lower than or equal to our current proposed method. Other than deep learning methods, we do not need thousands of eye-fixation
FIGURE 4. Worst results per data set. First row: original images; second row: fixation maps; third row: our saliency maps. (a) ETTO:
AutoFuseBlack__Curve_030_Rot_000_fhd.png, (b) MIT1003: i2278136983.jpeg, (c) CAT2000: Noisy\127.jpg, (d) EyeCrowd: 236.jpg, (e) FIGRIM: sun_aokgqlnxzonxwzlk.jpg.
point data to train our architecture and any optimization step. As a matter of facts, our technique is mainly inspired by the so-called bottom-up attention processes aiming to reproduce the attentional principles representing the neuronal activities in V1 towards those areas in the brain responsible for the eye movements. Our method is comparable to the Deep Learning ones on images with single objects in the foreground. We guess this aspect might deserve some more in-depth investigations to establish further connections be-tween our approach and the object visual attention-related processes. Last, we believe it is still worth to investigate cues for visual saliency detection improvements in spite of the excellent accuracy achieved by many state-of-the-art methods. We want to focus on techniques which provide a well-balanced trade-off between overall good detection ac-curacy and acceptable hardware requirements. We have been working on the re-implementation of our novel method in Python, taking advantage of GPU computation frameworks like CUDA (supported by OpenCV). We expect the code rewrite to speed-up the algorithm’s execution. That would make it feasible for on-the-fly intra-frame video saliency extraction when used in conjunction with state-of-the-art inter-frame saliency extraction techniques.
ACKNOWLEDGMENT
The authors thank Basilio Fabio Ceraolo for the assistance given on data acquisition, gathering and processing of the ETTO dataset during eye-tracking sessions. A special thanks to Caterina Ciaramitaro for her support during the final step of manuscript editing.
REFERENCES
[1] J. Li and W. Gao, Visual saliency computation: A machine learning perspective. Springer, 2014, vol. 8408.
[2] R. Snowden, R. J. Snowden, P. Thompson, and T. Troscianko, Basic vision: an introduction to visual perception. Oxford University Press, 2012. [Online]. Available: https://global.oup.com/ukhe/product/basic-vision-9780199572021
[3] D. Walther, U. Rutishauser, C. Koch, and P. Perona, “Selective visual attention enables learning and recognition of multiple objects in cluttered scenes,” Computer Vision and Image Understanding, vol. 100, no. 1-2, pp. 41–63, 2005.
[4] J. Theeuwes, “Endogenous and exogenous control of visual selection,” Perception, vol. 23, no. 4, pp. 429–440, 1994.
[5] M. M. Sohlberg and C. A. Mateer, Introduction to cognitive rehabilita-tion: Theory and practice. Guilford Press, 1989.
[6] N. V. K. Medathati, H. Neumann, G. S. Masson, and P. Kornprobst, “Bio-inspired computer vision: Towards a synergistic approach of artificial and biological vision,” Computer Vision and Image Understanding, vol. 150, no. Supplement C, pp. 1 – 30, 2016. [Online]. Available: http://www.sciencedirect.com/science/article/pii/S1077314216300339 [7] S. Frintrop, E. Rome, and H. I. Christensen, “Computational visual
attention systems and their cognitive foundations: A survey,” ACM Transactions on Applied Perception (TAP), vol. 7, no. 1, p. 6, 2010. [8] L. Itti, C. Koch, and E. Niebur, “A model of saliency-based visual
attention for rapid scene analysis,” IEEE Transactions on Pattern Analysis and Machine Intelligence, vol. 20, no. 11, pp. 1254–1259, 1998. [9] J. Harel, C. Koch, P. Perona et al., “Graph-based visual saliency,” in
NIPS, vol. 19, 2006, p. 5.
[10] J. Luo, “Subject content-based intelligent cropping of digital photos,” in Multimedia and Expo, 2007 IEEE International Conference on. IEEE, 2007, pp. 2218–2221.
[11] E. Ardizzone, A. Bruno, and F. Gugliuzza, “Eye-Tracking Through Objects (ETTO) Dataset,” 2017. [Online]. Available: https://github.com/fgugliuzza/saliency/tree/master/etto
[12] M. Matsukura and S. P. Vecera, “Interference between object-based attention and object-based memory,” Psychonomic Bulletin & Review, vol. 16, no. 3, pp. 529–536, 2009.
[13] J. Theeuwes, S. Mathôt, and A. Kingstone, “Object-based eye move-ments: The eyes prefer to stay within the same object,” Attention, Perception, & Psychophysics, vol. 72, no. 3, pp. 597–601, Apr 2010. [14] C. Stothart, D. J. Simons, W. R. Boot, and T. J. Wright, “What to
where: The right attention set for the wrong location,” Perception, p. 0301006619854302, 2019.
[15] G. Kim and S. M. Lui, “The effect of color combination on visual atten-tion and usability of multiple line graphs,” Journal of Communicaatten-tions and Information Sciences, vol. 1, pp. 11–21, 2011.
[16] M.-M. Cheng, N. J. Mitra, X. Huang, P. H. Torr, and S.-M. Hu, “Global contrast based salient region detection,” IEEE Transactions on Pattern Analysis and Machine Intelligence, vol. 37, no. 3, pp. 569–582, 2015. [17] L.-C. Chen, Y. Yang, J. Wang, W. Xu, and A. L. Yuille, “Attention to
scale: Scale-aware semantic image segmentation,” in Proceedings of the IEEE conference on computer vision and pattern recognition, 2016, pp. 3640–3649.
[18] H.-P. Frey, C. Honey, and P. König, “What’s color got to do with it? the influence of color on visual attention in different categories,” Journal of Vision, vol. 8, no. 14, pp. 6–6, 2008.
[19] D. Berga and X. Otazu, “A neurodynamical model of saliency prediction in v1,” arXiv preprint arXiv:1811.06308, 2018. [Online]. Available: https://arxiv.org/abs/1811.06308
[20] H. S. Friedman, H. Zhou, and R. von der Heydt, “The coding of uniform colour figures in monkey visual cortex,” The Journal of physiology, vol. 548, no. 2, pp. 593–613, 2003.
[21] X. R. Vidal, R. Rodriguez-Sanchez, J. A. García, and J. Fdez-Valdivia, “Integral opponent-colors features for computing visual target distinctness,” Pattern Recognition, vol. 33, no. 7, pp. 1179–1198, 2000. [22] G. Sharma and C. E. Rodríguez-Pardo, “The dark side of cielab,” in Color
Imaging XVII: Displaying, Processing, Hardcopy, and Applications, vol. 8292. International Society for Optics and Photonics, 2012, p. 82920D. [23] K. Duncan and S. Sarkar, “Saliency in images and video: a brief survey,”
IET Computer Vision, vol. 6, no. 6, pp. 514–523, 2012.
[24] L. Zhang, M. H. Tong, T. K. Marks, H. Shan, and G. W. Cottrell, “SUN: A Bayesian framework for saliency using natural statistics,” Journal of vision, vol. 8, no. 7, pp. 32–32, 2008.
[25] D. Walther and C. Koch, “Modeling attention to salient proto-objects,” Neural networks, vol. 19, no. 9, pp. 1395–1407, 2006.
[26] D. Gao and N. Vasconcelos, “Discriminant saliency for visual recognition from cluttered scenes,” in Proceedings of the 17th International Conference on Neural Information Processing Systems, ser. NIPS’04. Cambridge, MA, USA: MIT Press, 2004, pp. 481–488. [Online]. Available: http://dl.acm.org/citation.cfm?id=2976040.2976101 [27] J. Li, M. D. Levine, X. An, X. Xu, and H. He, “Visual saliency based on scale-space analysis in the frequency domain,” IEEE Transactions on Pattern Analysis and Machine Intelligence, vol. 35, no. 4, pp. 996–1010, 2013.
[28] A. A. Salah, E. Alpaydin, and L. Akarun, “A selective attention-based method for visual pattern recognition with application to handwritten digit recognition and face recognition,” IEEE Transactions on Pattern Analysis and Machine Intelligence, vol. 24, no. 3, pp. 420–425, 2002. [29] W. Wang, C. Chen, Y. Wang, T. Jiang, F. Fang, and Y. Yao, “Simulating
human saccadic scanpaths on natural images,” in Computer Vision and Pattern Recognition (CVPR), 2011 IEEE Conference on. IEEE, 2011, pp. 441–448.
[30] T. Judd, K. Ehinger, F. Durand, and A. Torralba, “Learning to predict where humans look,” in Computer Vision, 2009 IEEE 12th International Conference on. IEEE, 2009, pp. 2106–2113.
[31] E. Vig, M. Dorr, and D. Cox, “Large-scale optimization of hierarchical features for saliency prediction in natural images,” in Proceedings of the IEEE Conference on Computer Vision and Pattern Recognition, 2014, pp. 2798–2805.
[32] A. Mahdi, M. Su, M. Schlesinger, and J. Qin, “A Comparison Study of Saliency Models for Fixation Prediction on Infants and Adults,” IEEE Transactions on Cognitive and Developmental Systems, 2017. [33] C. Koch and S. Ullman, “Shifts in selective visual attention: towards the
underlying neural circuitry,” in Matters of intelligence. Springer, 1987, pp. 115–141.
[34] L. Wang, S.-L. Dong, H.-S. Li, and X.-B. Zhu, “A Brief Survey of Low-Level Saliency Detection,” in Information System and Artificial Intelligence (ISAI), 2016 International Conference on. IEEE, 2016, pp. 590–593.
[35] N. D. Bruce and J. K. Tsotsos, “Saliency, attention, and visual search: An information theoretic approach,” Journal of vision, vol. 9, no. 3, pp. 5–5, 2009.
[36] L. Sun, Y. Tang, and H. Zhang, “Visual saliency detection based on multi-scale and multi-channel mean,” Multimedia Tools and Applications, vol. 75, no. 1, pp. 667–684, 2016.
[37] E. Ardizzone, A. Bruno, and G. Mazzola, “Visual saliency by keypoints distribution analysis,” in International Conference on Image Analysis and Processing. Springer, 2011, pp. 691–699.
[38] ——, “Saliency based image cropping,” in International Conference on Image Analysis and Processing. Springer, 2013, pp. 773–782. [39] ——, “Scale detection via keypoint density maps in regular or
near-regular textures,” Pattern Recognition Letters, vol. 34, no. 16, pp. 2071– 2078, 2013.
[40] E. Ardizzone, A. Bruno, and F. Gugliuzza, “Exploiting Visual Saliency Algorithms for Object-Based Attention: A New Color and Scale-Based Approach,” in International Conference on Image Analysis and Process-ing. Springer, 2017, pp. 191–201.
[41] M. M. Lie, G. B. Borba, H. V. Neto, and H. R. Gamba, “Joint upsampling of random color distance maps for fast salient region detection,” Pattern Recognition Letters, 2017.
[42] Z. Tu, Z. Guo, W. Xie, M. Yan, R. C. Veltkamp, B. Li, and J. Yuan, “Fusing disparate object signatures for salient object detection in video,” Pattern Recognition, vol. 72, pp. 285–299, 2017.
[43] S. Roy and P. Mitra, “Visual saliency detection: a Kalman filter based approach,” arXiv preprint arXiv:1604.04825, 2016. [Online]. Available: https://arxiv.org/abs/1604.04825
[44] N. Bigdely-Shamlo, A. Vankov, R. R. Ramirez, and S. Makeig, “Brain activity-based image classification from rapid serial visual presentation,” IEEE Transactions on Neural Systems and Rehabilitation Engineering, vol. 16, no. 5, pp. 432–441, 2008.
[45] K. B. Kalinin, M. V. Petrushan, and A. I. Samarin, “Relation of descriptor completeness and distinctiveness to localization of the most informative regions in images,” Perception, vol. 44, no. 8-9, pp. 1029–1039, 2015. [46] V. Sundstedt, A. Chalmers, K. Cater, and K. Debattista, “Top-Down
Visual Attention for Efficient Rendering of Task Related Scenes.” in VMV, 2004, pp. 209–216.
[47] J. Yang and M.-H. Yang, “Top-down visual saliency via joint CRF and dictionary learning,” IEEE Transactions on Pattern Analysis and Machine Intelligence, vol. 39, no. 3, pp. 576–588, 2017.
[48] C. Kanan, M. H. Tong, L. Zhang, and G. W. Cottrell, “SUN: Top-down saliency using natural statistics,” Visual cognition, vol. 17, no. 6-7, pp. 979–1003, 2009.
[49] L.-Q. Chen, X. Xie, X. Fan, W.-Y. Ma, H.-J. Zhang, and H.-Q. Zhou, “A visual attention model for adapting images on small displays,” Multime-dia systems, vol. 9, no. 4, pp. 353–364, 2003.
[50] T. Judd, K. Ehinger, F. Durand, and A. Torralba, “Learning to Predict Where Humans Look,” 2009. [Online]. Available: http://people.csail.mit.edu/tjudd/WherePeopleLook/index.html [51] V. Gentile, S. Sorce, A. Malizia, D. Pirrello, and A. Gentile, “Touchless
Interfaces For Public Displays: Can We Deliver Interface Designers From Introducing Artificial Push Button Gestures?” in Proceedings of the International Working Conference on Advanced Visual Interfaces, ser. AVI ’16. New York, NY, USA: ACM, 2016, pp. 40–43. [Online]. Available: http://doi.acm.org/10.1145/2909132.2909282
[52] G. Hervet, K. Guérard, S. Tremblay, and M. S. Chtourou, “Is banner blindness genuine? Eye tracking internet text advertising,” Applied cog-nitive psychology, vol. 25, no. 5, pp. 708–716, 2011.
[53] A. T. Duchowski, “A breadth-first survey of eye-tracking applications,” Behavior Research Methods, Instruments, & Computers, vol. 34, no. 4, pp. 455–470, 2002.
[54] S. A. Oliveira, S. S. Alves, J. P. Gomes, and A. R. R. Neto, “A bi-directional evaluation-based ap-proach for image retargeting quality assessment,” Computer Vision and Image Understanding, 2017. [Online]. Available: http://www.sciencedirect.com/science/article/pii/S1077314217302035 [55] Z. Li, K. Gavrilyuk, E. Gavves, M. Jain, and C. G.
Snoek, “VideoLSTM convolves, attends and flows for action recognition,” Computer Vision and Image Understanding, vol. 166, no. Supplement C, pp. 41 – 50, 2018. [Online]. Available: http://www.sciencedirect.com/science/article/pii/S1077314217301741 [56] J.-G. Yu, G.-S. Xia, C. Gao, and A. Samal, “A computational model
for object-based visual saliency: Spreading attention along Gestalt cues,” IEEE Transactions on Multimedia, vol. 18, no. 2, pp. 273–286, 2016. [57] K.-Y. Chang, T.-L. Liu, H.-T. Chen, and S.-H. Lai, “Fusing generic
objectness and visual saliency for salient object detection,” in Computer Vision (ICCV), 2011 IEEE International Conference on. IEEE, 2011, pp. 914–921.
[58] L. Czúni and M. Rashad, “The use of imus for video object retrieval in lightweight devices,” Journal of Visual Communication and Image Representation, vol. 48, pp. 30–42, 2017.
[59] ——, “Lightweight active object retrieval with weak classifiers,” Sensors, vol. 18, no. 3, p. 801, 2018.
[60] H. Pflüger, B. Höferlin, M. Raschke, and T. Ertl, “Simulating fixations when looking at visual arts,” ACM Transactions on Applied Perception (TAP), vol. 12, no. 3, p. 9, 2015.
[61] K. Krejtz, A. Duchowski, T. Szmidt, I. Krejtz, F. González Perilli, A. Pires, A. Vilaro, and N. Villalobos, “Gaze transition entropy,” ACM Transactions on Applied Perception (TAP), vol. 13, no. 1, p. 4, 2015. [62] A. Toet, “Computational versus psychophysical bottom-up image
saliency: A comparative evaluation study,” IEEE Transactions on Pattern Analysis and Machine Intelligence, vol. 33, no. 11, pp. 2131–2146, 2011. [63] Y. LeCun, Y. Bengio, and G. Hinton, “Deep learning,” Nature, vol. 521,
no. 7553, pp. 436–444, 2015.
[64] B. Sullivan, “Charniak, e. an introduction to deep learning,” 2019. [65] G. Li and Y. Yu, “Visual Saliency Detection Based on Multiscale Deep
CNN Features,” IEEE Transactions on Image Processing, vol. 25, no. 11, pp. 5012–5024, 2016.
[66] A. Das, H. Agrawal, L. Zitnick, D. Parikh, and D. Batra, “Human Attention in Visual Question Answering: Do Humans and Deep Networks Look at the Same Regions?” Computer Vision and Image Understanding, vol. 163, no. Supplement C, pp. 90 – 100, 2017, language in Vision. [Online]. Available: http://www.sciencedirect.com/science/article/pii/S1077314217301649 [67] S. S. Kruthiventi, K. Ayush, and R. V. Babu, “Deepfix: A fully
con-volutional neural network for predicting human eye fixations,” IEEE Transactions on Image Processing, vol. 26, no. 9, pp. 4446–4456, 2017. [68] Z.-Q. Zhao, P. Zheng, S.-t. Xu, and X. Wu, “Object detection with deep
learning: A review,” IEEE transactions on neural networks and learning systems, 2019.
[69] A. M. Obeso, J. Benois-Pineau, M. G. Vázquez, and A. R. Acosta, “Saliency-based selection of visual content for deep convolutional neural networks,” Multimedia Tools and Applications, vol. 78, no. 8, pp. 9553– 9576, 2019.
[70] X. Huang, C. Shen, X. Boix, and Q. Zhao, “Salicon: Reducing the semantic gap in saliency prediction by adapting deep neural networks,” in Proceedings of the IEEE International Conference on Computer Vision, 2015, pp. 262–270.
[71] J. Pan, C. C. Ferrer, K. McGuinness, N. E. O’Connor, J. Torres, E. Sayrol, and X. Giro-i Nieto, “Salgan: Visual saliency prediction with generative adversarial networks,” arXiv preprint arXiv:1701.01081, 2017. [Online]. Available: https://arxiv.org/abs/1701.01081
[72] N. Liu and J. Han, “A deep spatial contextual long-term recurrent con-volutional network for saliency detection,” IEEE Transactions on Image Processing, vol. 27, no. 7, pp. 3264–3274, 2018.
[73] M. Cornia, L. Baraldi, G. Serra, and R. Cucchiara, “Predicting Human Eye Fixations via an LSTM-Based Saliency Attentive Model,” IEEE Transactions on Image Processing, vol. 27, no. 10, pp. 5142–5154, Oct 2018.
[74] D. A. Klein and S. Frintrop, “Center-surround divergence of feature statistics for salient object detection,” in 2011 International Conference on Computer Vision. IEEE, 2011, pp. 2214–2219.
[75] M. Kümmerer, T. S. Wallis, and M. Bethge, “Deepgaze ii: Reading fixations from deep features trained on object recognition,” arXiv preprint arXiv:1610.01563, 2016. [Online]. Available: https://arxiv.org/abs/1610.01563v1
[76] M. Kummerer, T. S. Wallis, L. A. Gatys, and M. Bethge, “Understanding low-and high-level contributions to fixation prediction,” in Proceedings of the IEEE International Conference on Computer Vision, 2017, pp. 4789– 4798.
[77] Y. Niu, R. M. Todd, M. J. Kyan, and A. K. Anderson, “Visual and emotional salience influence eye movements,” TAP, vol. 9, no. 3, pp. 13– 1, 2012.
[78] N. Liu, J. Han, and M.-H. Yang, “Picanet: Learning pixel-wise contextual attention for saliency detection,” in The IEEE Conference on Computer Vision and Pattern Recognition (CVPR), June 2018, pp. 3089–3098. [79] J. Wu, H. Yu, J. Sun, W. Qu, and Z. Cui, “Efficient visual saliency
detection via multi-cues,” IEEE Access, vol. 7, pp. 14 728–14 735, 2019. [80] Y. Zeng, Y. Zhuge, H. Lu, L. Zhang, M. Qian, and Y. Yu, “Multi-source weak supervision for saliency detection,” in Proceedings of the IEEE Conference on Computer Vision and Pattern Recognition, 2019, pp. 6074–6083. [Online]. Available: https://arxiv.org/abs/1904.00566
[81] S. Frintrop, T. Werner, and G. Martin Garcia, “Traditional saliency reloaded: A good old model in new shape,” in Proceedings of the IEEE Conference on Computer Vision and Pattern Recognition, 2015, pp. 82– 90.
[82] R. Achanta, S. Hemami, F. Estrada, and S. Süsstrunk, “Frequency-tuned salient region detection,” in IEEE International Conference on Computer Vision and Pattern Recognition (CVPR 2009), no. CONF, 2009, pp. 1597–1604.
[83] J. Zhang and S. Sclaroff, “Saliency detection: A boolean map approach,” in Proceedings of the IEEE international conference on computer vision, 2013, pp. 153–160.
[84] Y. Zhu, G. Zhai, X. Min, and J. Zhou, “The prediction of saliency map for head and eye movements in 360 degree images,” IEEE Transactions on Multimedia, 2019.
[85] Y. Zhu, G. Zhai, and X. Min, “The prediction of head and eye movement for 360 degree images,” Signal Process. Image Commun., vol. 69, pp. 15–25, 2018. [Online]. Available: https://doi.org/10.1016/j.image.2018.05.010
[86] A. T. Duchowski, “Eye tracking techniques,” in Eye Tracking Methodol-ogy. Springer, 2017, pp. 49–57.
[87] T. Blascheck, K. Kurzhals, M. Raschke, M. Burch, D. Weiskopf, and T. Ertl, “State-of-the-art of visualization for eye tracking data,” in Pro-ceedings of EuroVis, vol. 2014. The Eurographics Association, 2014. [88] J. Hasic, A. Chalmers, and E. Sikudova, “Perceptually guided
high-fidelity rendering exploiting movement bias in visual attention.” TAP, vol. 8, no. 1, pp. 6–1, 2010.
[89] A. Samarin, T. Koltunova, V. Osinov, D. Shaposhnikov, and L. Podlad-chikova, “Scanpaths of complex image viewing: insights from experi-mental and modeling studies,” Perception, vol. 44, no. 8-9, pp. 1064– 1076, 2015.
[90] J. H. Bappy, S. Paul, and A. K. Roy-Chowdhury, “Online adaptation for joint scene and object classification,” in European Conference on Computer Vision. Springer, 2016, pp. 227–243.
[91] T.-Y. Lin, M. Maire, S. Belongie, J. Hays, P. Perona, D. Ramanan, P. Dol-lár, and C. L. Zitnick, “Microsoft coco: Common objects in context,” in European conference on computer vision. Springer, 2014, pp. 740–755. [92] C. Shen and Q. Zhao, “Webpage saliency,” in European Conference on
Computer Vision. Springer, 2014, pp. 33–46.
[93] S. Ramanathan, H. Katti, N. Sebe, M. Kankanhalli, and T.-S. Chua, “An eye fixation database for saliency detection in images,” Computer Vision– ECCV 2010, pp. 30–43, 2010.
[94] K. A. Ehinger, B. Hidalgo-Sotelo, A. Torralba, and A. Oliva, “Modelling search for people in 900 scenes: A combined source model of eye guidance,” Visual cognition, vol. 17, no. 6-7, pp. 945–978, 2009. [95] A. Borji and L. Itti, “CAT2000: A Large Scale Fixation Dataset for
Boosting Saliency Research,” CVPR 2015 workshop on "Future of Datasets", 2015, arXiv preprint arXiv:1505.03581. [Online]. Available: https://arxiv.org/abs/1505.03581
[96] H. Duan, G. Zhai, X. Min, Y. Fang, Z. Che, X. Yang, C. Zhi, H. Yang, and N. Liu, “Learning to predict where the children with asd look,” in 2018 IEEE International Conference on Image Processing, ICIP 2018, Athens, Greece, October 7-10, 2018. IEEE, 2018, pp. 704–708. [Online]. Available: https://doi.org/10.1109/ICIP.2018.8451338 [97] H. Duan, G. Zhai, X. Min, Z. Che, Y. Fang, X. Yang, J. Gutiérrez,
and P. L. Callet, “A dataset of eye movements for the children with autism spectrum disorder,” in Proceedings of the 10th ACM Multimedia Systems Conference, MMSys 2019, Amherst, MA, USA, June 18-21, 2019, M. Zink, L. Toni, and A. C. Begen, Eds. ACM, 2019, pp. 255–260. [Online]. Available: https://doi.org/10.1145/3304109.3325818 [98] H. Duan, X. Min, Y. Fang, L. Fan, X. Yang, and G. Zhai, “Visual attention analysis and prediction on human faces for children with autism spectrum disorder,” ACM Transactions on Multimedia Computing, Communica-tions, and Applications (TOMM), vol. 15, no. 3s, pp. 1–23, 2019. [99] Y. Zhu, D. Zhu, Y. Yang, H. Duan, Q. Zhou, X. Min, J. Zhou,
G. Zhai, and X. Yang, “A saliency dataset of head and eye movements for augmented reality,” CoRR, vol. abs/1912.05971, 2019. [Online]. Available: http://arxiv.org/abs/1912.05971
[100] F. Viksten, P.-E. Forssén, B. Johansson, and A. Moe, “Object Pose Estimation Database,” 2009. [Online]. Available: http://www.cvl.isy.liu.se/research/objrec/posedb/
[101] ——, “Comparison of local image descriptors for full 6 degree-of-freedom pose estimation,” in Robotics and Automation, 2009. ICRA’09. IEEE International Conference on. IEEE, 2009, pp. 2779–2786.