ISSN: 2278 – 7798 All Rights Reserved © 2014 IJSETR
2992
SWT based Saliency Detection using Low
Level Multi Scale Image Features
Tanuja Sabbe, B.Leela Kumari
Abstract-Stationary wavelet transform (SWT) achieves
translation-invariance by avoiding down sampling, resulting in giving lossless information. In this paper, SWT technique is implemented for creating local and global saliency maps. The performance of the saliency detection method using low level features based on Discrete wavelet Transform (DWT) and SWT are analyzed for biomedical applications. The results are also extended for a hybridized saliency map. Finally the simulation results are analyzed and compared using different parameters for local, global and hybrid saliency detection models.
Keywords - SWT, local map, global map, hybrid map. I.INTRODUCTION
The Visual attention is one of the main features of the Human Visual System (HVS) to derive important and compact information from the natural scenes according to Treisman et al [1], and. Koch et al [2].where the surrounding environment includes an excessive amount of information, visual attention mechanism enables a reduction of the redundant data which benefits perception during the selective attention process [1-4]. Many studies have tried to build computational models to simulate this mechanism [5-6]. Recently, the Wavelet transform (WT) has begun to attract researchers‟ effort in visual attention modeling [11-12]. The advantage of the WT is its ability to provide multi-scale spatial and frequency analysis at the same time [18]. Tian et al., [11] proposed a WT-based salient detector for image retrieval which depends on local and global variations of wavelet coefficients at multi-scale levels. The idea is to account for both global and local features in the WT space: the points with higher global variation based on the absolute wavelet coefficients at courser scales are selected, and these selected points are tracked along the finer scales to detect the salient points [11]. The salient points will be the sum of the wavelet coefficients at tracked
points along the multi-scale WT [11].but, this algorithm is only able to give salient points rather than salient regions compared to the models [7], [14] and [16]. Then, even though salient points tracked at the finest resolution of the WT can represent the image for image retrieval [11], it is hard to compare this algorithm for attention region or object detection as a computational model of saliency detection. Murray et al., [12] derived weight maps from the high-pass wavelet coefficients of each level based on the WT decomposition. Two important aspects for the derivation of weight maps are the consideration of the human sensitivity to local contrast, and the energy ratio of central and surrounding regions to mimic the center-surround effect [12]. In [12], the saliency map is obtained by the inverse WT (IWT) of weight maps for each color sub-band [12]. While WT representation is better than FT for images by providing more local analysis, there is lack of accounting for global contrast because the computation is based on the local differences in [12]. Thus, the local contrast is more dominant than the global contrast in the saliency model of [12].
II. WAVELET TRANSFORMATIONS Wavelet Transformation based applications are growing rapidly in engineering fields such as signal denoising, compression, enhancement, video coding and pattern classification etc. The multi-scale wavelet analysis the signal at different band and bandwidths [18-19],[22-23] which helps in performing local frequency analysis. Wavelet analysis applies multi-resolution filter-banks to the input signal according to Merry at el [18] and John et al [23], where the approximation and detailed signals are derived from two frequency bands; high pass and low pass respectively from the orthogonal wavelet filter-band property[18],[19],[23].
Frequency components can be simply expressed as 1-D data (for the three-level wavelet decomposition). The authors used wavelet decomposition technique which extracts oriented details(horizontal, vertical, and diagonal)in the multi-scale perspective and low special resolution with lower frequency components and high spatial resolution with high frequency components without losing the information in details during the process[18],[23].
RGB image
RGB to lab conversion
lab image
Feature map generation
Feature maps
ISSN: 2278 – 7798 All Rights Reserved © 2014 IJSETR
2993
Many techniques are implemented using wavelettransforms, two such techniques are discrete wavelet transforms and stationary wavelet transforms.
A. Discrete wavelet transform(DWT)
DWT is an implementation of the wavelet transform which uses a discrete set of the wavelet scales and some defined rules, this technique is used in various fields including image processing, when it is applied to an image, the input image is decomposed into different sub-bands namely low-low
(LL),low-high(LH),high-low(HL),high-high(HH).DWT has the ability to preserve high frequency components of the image.
B. Stationary Wavelet Transform (SWT)
SWT is similar to DWT except for the down sampling that are present in the process of DWT are suppressed to overcome the loss of information in the respective bands providing time invariance and high frequency band components of the image.
In this paper we study the SWT technique application on the algorithm and analysis the SWT technique by comparing the measuring parameters to DWT technique. In order to analysis a saliency maps, feature maps are first generated. They are generated as follows.
III. Feature Map
An image is converted to the CIE lab color space(CIE illumination D65 model is selected for conversion as the white-point parameter in Matlab® rgb to CIE Lab converter) which makes the image uniform and similar to the human perception, with a luminance and two-chromatic channels (RG and BY) [9]. An m × m 2D Gaussian low-pass filter to the input color image gc is applied to remove noise.
gIC = gc∗ I
m×m (1)
gIC is the new noise removed version of the input image, where I is m × m 2-D filter with size 3 i.e m=3 to filter high frequency noise. Daubechies wavelets (Daub.5) are used since its filter size is approximate for computation time and neighborhoods.
Fig1.The framework of the saliency detection
[AcN ,Hsc, Vsc, Dsc] = SWTN gIc (2) RGB image RGB to lab conversion lab image
Feature map generation
Feature maps Local saliency computation Global saliency computation Local
saliency saliency Global
Fusion for final saliency
s saliency
ISSN: 2278 – 7798 All Rights Reserved © 2014 IJSETR
2994
By using SWT the image is decomposed into Nnumber of scaling in the process, s ∈ 1, … . , N is the resolution index and c ∈ L, a, b represents the channels of gIC . A
N , c H
sc, Vsc, Dsc are the wavelet coefficients of approximation, horizontal, vertical and diagonal details for the given s and c respectively. The details of the image are represented by the wavelet coefficients. By increasing frequency bands several feature maps are created at various scales. Inverse stationary wavelet transform (ISWT) is used to generate the feature maps. Since the Gaussian filter is applied, feature maps are generated from the details of SWT process by ignoring approximation details during the ISWT process.
fsc x, y =
ISWT, ( Hsc , Vsc, Dsc 2
η (3) Where fsc(x, y) represents generated feature maps for the sth level decomposition for each image sub-band c,η represents scaling factor .
IV. Saliency Detection
Saliency detection is a process by which a selective region stands out relative to its surrounding neighbors. Where a saliency map is a two dimensional map which exhibits the striking regions to be more prominent in the visual field, which helps in enquiring the important data right away allowing reduction of data in the process and the prioritized selection improves the performance in generating or transmitting visual data.
A. Computation of local features
According to Itti et al [11] feature maps at each level are fused linearly without any normalization operation to generate local saliency ,as the formula is given in (4) below. Hence, this saliency map will be created based on the local features computed in equation (3) in which the maximum value between channels of the image is taken into account at each level. Which is given by
sL x, y = argmax fsL x, y , fsa x, y , fsb(x, y)) N
s=1
∗ Ik×k (4) where , fsL x, y , fsa x, y , fsb x, y represent the feature maps at Scale s for L ,a and b channels respectively; sL(x, y) is the local saliency map
.
B . Generation of global saliency map
Global saliency helps in detecting the important information which was not clear enough in the local saliency. To obtain the global saliency map, the global distribution of the local features is calculated. A location (x,y) from fsc(x, y) in (3) can be represented as a feature vector f(x,y) with a length of 3 × N (3 channels L , a and b , and -level wavelet-based features for each channel) from all feature maps, features likelihood at a given location can be defined by the probability density function (PDF) with a normal distribution [12],[24]. Therefore, the Gaussian PDF in multi-dimensional space can be written as [24], [12]: p f x, y = 1 2π n2 Σ 12× e −12 f x,y −μ T Σ−1 f x,y −μ (5) With Σ= E f x, y − μ (f x, y − μ)T (6) Where, μ represents the mean vector containing the mean of each feature map i.e. μ= E f .In (5) Σ represents n × n covariance matrix; T is the transpose operation; 𝑛 = 3 × 𝑁 the number of the feature vector referring to the dimension of the feature space including 3 color channels and feature maps for each color channel, Σ and is the determinant of the covariance matrix [24].
The global saliency map can be generated by using PDF in (5).Using k × k(considering filter size as 5)2-D Gaussian low-pass filter to obtain a smooth map.
sG x, y = (log(p(f x, y )−1 1 2
∗ Ik×k (7) Where sG contains details of local and global, since it is computed from local features in (3) but the global distribution is much dominant due to the structure of the scene and the content.
C . Generation of hybrid Saliency Map
The final hybridized saliency map is computed by fusing the global and local saliency maps which are generated by (6) and (7).
Which are given by s′ x, y = M S L
′(x, y) × CsG′(x,y)
∗ Ik×k (8) Where s′(x, y) represents the final saliency map, linearly scaled to the range [0,1] local and global saliency maps are represented by sL′ x, y and sG′ x, y .
ISSN: 2278 – 7798 All Rights Reserved © 2014 IJSETR
2995
V .Results and conclusionA .Performance Evaluation
The performance of the three models(Local, Global & Hybrid) is evaluated based on overall precision „P‟, recall „R‟, and „F‟-measure .
𝑃 = Σ x Σ y(t(x, y) × s x, y ) Σ xΣys(x, y) (9) 𝑅 = Σ x Σ y(t(x, y) × s x, y ) Σ x Σ yt(x, y) (10) 𝐹𝛼= (1+𝛼)×𝑃×𝑅 𝛼×𝑃+𝑅 (11) Where s(x,y) is a saliency map from the computational model, t(x,y) is the ground-truth map, and 𝛼 in (11) is a positive parameter to decide the relative importance of the precision. Precision (P) represents the saliency detection performance of the computational model; R is the ratio of salient regions from correct detection .F-measure is a harmonic mean of P and R.
Now DWT and SWT techniques are applied to a biomedical image, the performance can be estimated based on the following output images and the measuring parameters.
B. Results of DWT technique
Fig 2.Input Image
Fig 3.Local saliency Map
Fig 4.Global Saliency Map
Fig 5.Final Hybridized saliency Map
Input Image
Local Saliency Map
Global Saliency Map
ISSN: 2278 – 7798 All Rights Reserved © 2014 IJSETR
2996
C .Results of SWT TechniqueFig 6.Input Image
Fig 7.Local Saliency Map
Fig 8.Global Saliency Map
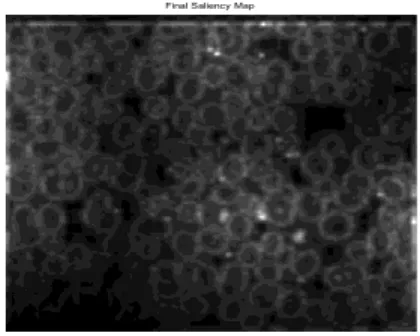
Fig 9.Final Hybridized Saliency Map
Table 1: Performance evaluation of saliency detection methods for DWT and SWT
In this paper the authors tried to analyze the performance of a hybridized saliency map by using the stationary wavelet transform (SWT) technique. The generated results show that SWT is better when compared to DWT for local, global, final hybridized saliency maps.SWT technique provides a better performance when compared to the previous models. Authors propose hybridized saliency map for medical applications .
VI. REFERENCE
[1] A. Treisman and G. Gelade, “A
feature-integration theory of attention,”Cognit. Psychol., vol. 12, no. 1, pp. 97–136, 1980.
[2] C. Koch and S. Ullman, “Shifts in selective visual attention: Towards the underlying neural circuitry,”
Human Neurobiol., vol. 4, pp. 219–227, 1985.
[3] J. Wolfe, K. R. Cave, and S. L. Franzel, “Guided search: An alternativeto the feature integration model for visual search,” J. Exp. Psychol.:Human Percept.
Perform., vol. 15, no. 3, pp. 419–433, 1989.
Input Image
Local Saliency Map
Global Saliency Map
Final Saliency Map
Performance Measures
Saliency Detection Models Local Saliency Global
Saliency Hybrid Saliency DWT SWT DWT SWT DWT SWT Precision 1.6135 1.7082 1.3521 1.5974 1.7042 1.7185 Recall 1.5882 0.3967 0.0980 0.0130 0.1667 0.1799 F-Measure 1.6008 0.6438 0.1828 0.0258 0.3036 0.3257
ISSN: 2278 – 7798 All Rights Reserved © 2014 IJSETR
2997
[4] J.Wolfe, “Guided search 2.0: A revised model ofguided search,” PsychonomicBull. Rev., vol. 1, no. 2, pp. 202–238, 1994.
[5] J. K. Tsotsos, S. M. Culhane, W. Y. K. Wai, Y. H. Lai, N. Davis, and F.Nuflo, “Modelling visual attention via selective tuning,” Artif. Intell., vol. 78, no. 1–2, pp. 507–545, Oct. 1995. [6] E. Niebur and C. Koch, “Computational Architectures for Attention,”in The Attentive Brain, R. Parasuraman, Ed. Cambridge, MA: MIT Press, 1998, pp. 163–186.
[7] J.M. Wolfe, S. J. Butcher, andM.Hyle, “Changing your mind:On the contributions of top-down and bottom-up guidance in visual search for feature singletons,” J. Exp. Psychol. Human Percept
Perform., vol. 29,pp. 483–502, 2003.
[8] O. L.Meur, P. L. Callet,D. Barba, andD. Thoreau, “Acoherent computationalapproach tomodel the bottom-up visual attention,” IEEE Trans.Pattern
Anal.Mach. Intell., vol. 28, no. 5, pp. 802–817, May
2006.
[9] S. Frintrop, “VOCUS: A visual attention system for object detection and goal directed search,” Ph.D. dissertation, Rheinische Friedrich- Wilhelms-Universi¨tat Bonn, Bonn, Germany, 2005. [10] L. Itti, “Models of bottom-up and top-down visual attention,” Ph.D. dissertation, Dept. Computat. Neur. Syst., California Inst. Technol, Pasadena, 2000. [11] L. Itti, C. Koch, and E. Niebur, “Model of saliency-based visual attention for rapid scene analysis,” IEEE Trans. Pattern Anal. Mach. Intell., vol. 20, no. 11, pp. 1254–1259, Nov. 1998.
[12] A. Oliva, A. Torralba, M. S. Castelhano, and J. M. Henderson, “Topdown control of visual attention in object detection,” in Proc. IEEE Int. Conf. Image
Processing, 2003, vol. 1, pp. 253–256.
[13] Y. F. Ma and H. J. Zhang, “Contrast-based image attention analysis by using fuzzy growing,” in
Proc. 11th ACM Int. Conf. Multimedia, 2003,
pp. 374–381.
[14] R. Achanta, S. Hemami, F. Estrada, and S. Susstrunk, “Frequencytuned salient region
detection,” in Proc. IEEE Int. Conf. Comput. Vision
and Pattern Recognition, 2009, pp. 1597–1604.
[15] A. Oliva and A. Torralba, “Modeling the shape of the scene: A holistic representation of the spatial envelope,” Int. J. Comput. Vision, vol. 42,
no. 3, pp. 145–175, 2001.
[16] X. Hou and L. Zhang, “Saliency detection: A spectral residual approach,” in Proc. IEEE Int. Conf.
Comput. Vision and Pattern Recognition,
2007, pp. 1–8.
[17] C. Guo, Q. Ma, and L. Zhang, “Spatio-temporal saliency detection using phase spectrum of
quaternion Fourier transform,” in Proc. IEEE
Int. Conf. Comput. Vision and Pattern Recognition,
2008, pp. 1–8.
[18] R. J. E. Merry, Wavelet Theory and Application:
A Literature Study, DCT 2005.53. Eindhoven, The
Netherlands: Eindhoven Univ. Technol., 2005. [19] D. L. Fugal, Conceptual Wavelets in Digital
Signal Processing: An In-depth Practical Approach for the Non-Matematician. San Diego, CA: Space &
Signals Technical Publishing, 2009, pp. 1–78. [20] Q. Tian, N. Sebe, M. S. Lew, E. Loupias, and T. S. Huang, “Image retrieval using wavelet-based salient points,” J. Electron. Imag., vol. 10, 4, pp. 835–849, 2001.
[21] N. Murray, M. Vanrell, X. Otazu, and C. A. Parraga, “Saliency estimation using a non-parametric low-level vision model,” in Proc. IEEE Int. Conf.
Comput. Vision and Pattern Recognition, 2011.
[22] Y. Kocyigit andM. Korurek, “EMG signal classification using wavelet transform and fuzzy logic classifier,” ITU dergisi/d mühendislik, vol. 4, no. 3, 2005.
[23] John and L. Semmlow, Biosignal and
Biomedical Image Processing: MATLAB-Based Applications. New York: Marcel Decker, 2004. [24]
S. Theodoridis and K. Koutroumbas, Pattern
Recognition, 4th ed. London, U.K.:
Academic/Elsevier, 2009, pp. 20–24.
[25] S. Goferman, L. Zelnik-Manor, and A. Tal, “Context-aware saliency detection,” in Proc. IEEE
Int. Conf. Comput. Vision and Pattern Recognition,
2010, pp. 2376–2383.
[26] K. Koffka, Principles of Gestalt Psychology. London, U.K.: Routledge & Kegan Pul, 1955. [27] T. Liu, J. Sun, N.-N. Zheng, X. Tang, and H.-Y. Shum, “Learning to detect a salient object,” in Proc.
IEEE Int. Conf. Comput. Vision and Pattern Recognition, 2007, pp. 1–8.
[28] R. C. Gonzalez, R. E. Woods, and S. L. Eddins,
Digital Signal Procesing Using Matlab®. Englewood
Cliffs, NJ: Prentice Hall, 2004.