Calhoun: The NPS Institutional Archive
Theses and Dissertations Thesis Collection
2006-03
Isolated word recognition from in-ear microphone
data using Hidden Markov Models (HMM)
Kurcan, Remzi Serdar
Monterey, California. Naval Postgraduate School
NAVAL
POSTGRADUATE
SCHOOL
MONTEREY, CALIFORNIA
THESIS
Approved for public release; distribution is unlimited ISOLATED WORD RECOGNITION FROM IN-EAR MICROPHONE DATA USING HIDDEN MARKOV
MODELS (HMM)
by
Remzi Serdar Kurcan March 2006
Thesis Advisor: Monique P. Fargues
Co-Advisor: David Jenn
i
REPORT DOCUMENTATION PAGE Form Approved OMB No. 0704-0188
Public reporting burden for this collection of information is estimated to average 1 hour per response, including the time for reviewing instruction, searching existing data sources, gathering and maintaining the data needed, and completing and reviewing the collection of information. Send comments regarding this burden estimate or any other aspect of this collection of information, including suggestions for reducing this burden, to Washington headquarters Services, Directorate for Information Operations and Reports, 1215 Jefferson Davis Highway, Suite 1204, Arlington, VA 22202-4302, and to the Office of Management and Budget, Paperwork Reduction Project (0704-0188) Washington DC 20503.
1. AGENCY USE ONLY (Leave blank) 2. REPORT DATE March 2006
3. REPORT TYPE AND DATES COVERED Master’s Thesis
4. TITLE AND SUBTITLE: Isolated Word Recognition From In-Ear Microphone Data Using Hidden Markov Models (HMM)
6. AUTHOR(S) Remzi Serdar Kurcan
5. FUNDING NUMBERS
7. PERFORMING ORGANIZATION NAME(S) AND ADDRESS(ES) Naval Postgraduate School
Monterey, CA 93943-5000
8. PERFORMING
ORGANIZATION REPORT NUMBER
9. SPONSORING /MONITORING AGENCY NAME(S) AND ADDRESS(ES) N/A
10. SPONSORING/MONITORING AGENCY REPORT NUMBER
11. SUPPLEMENTARY NOTES The views expressed in this thesis are those of the author and do not reflect the official policy or position of the Department of Defense or the U.S. Government.
12a. DISTRIBUTION / AVAILABILITY STATEMENT
Approved for public release; distribution is unlimited 12b. DISTRIBUTION CODE 13. ABSTRACT (maximum 200 words)
This thesis is part of an ongoing larger scale research study started in 2004 at the Naval Postgraduate School (NPS) which aims to develop a speech-driven human-machine interface for the operation of semi-autonomous military robots in noisy operational environments. Earlier work included collecting a small database of isolated word utterances of seven words from 20 adult subjects using an in-ear microphone. The research conducted here develops a speaker-independent isolated word recognizer from these acoustic signals based on a discrete-observation Hidden Markov Model (HMM).
The study implements the HMM-based isolated word recognizer in three steps. The first step performs the endpoint detection and speech segmentation by using short-term temporal analysis. The second step includes speech feature extraction using static and dynamic MFCC parameters and vector quantization of continuous-valued speech features. Finally, the last step involves the discrete-observation HMM-based classifier for isolated word recognition. Experimental results show the average classification performance around 92.77%. The most significant result of this study is that the acoustic signals originating from speech organs and collected within the external ear canal via the in-ear microphone can be used for isolated word recognition.
The second dataset collected under low signal-to-noise ratio conditions with additive noise results in 79% recognition accuracy in the HMM-based classifier. We also compared the classification results of the data collected within the ear canal and outside the mouth via the same microphone. The second dataset collected under low signal-to-noise ratio conditions with additive noise results in 79% recognition accuracy in the HMM-based classifier. We also compared the classification results of the data collected within the ear canal and outside the mouth via the same microphone. Average classification rates obtained for the data collected outside the mouth shows significant performance degradation (down to 63%), over that observed with the data collected from within the ear canal (down to 86%). The ear canal dampens high frequencies. As a result, the HMM model derived for the data with dampened higher frequencies does not accurately fit the data collected outside the mouth, resulting in degraded recognition performances.
15. NUMBER OF PAGES
178 14. SUBJECT TERMS In-Ear Microphone, Isolated Word Recognition (IWR), Short-Term Energy
(STE), Zero-Crossing Rate (ZCR), Mel-Frequency Cepstral Coefficients (MFCC), LPC-derived Cepstral Coefficients (LPC-CC), Vector Quantization (VQ), K-Means Clustering Algorithm, Hidden Markov Models (HMM), Forward-Backward Algorithm (Baum-Welch Re-estimation Algorithm),
Viterbi Algorithm 16. PRICE CODE
17. SECURITY CLASSIFICATION OF REPORT Unclassified 18. SECURITY CLASSIFICATION OF THIS PAGE Unclassified 19. SECURITY CLASSIFICATION OF ABSTRACT Unclassified 20. LIMITATION OF ABSTRACT UL
NSN 7540-01-280-5500 Standard Form 298 (Rev. 2-89) Prescribed by ANSI Std. 239-18
ii
iii
Approved for public release; distribution is unlimited
ISOLATED WORD RECOGNITION FROM IN-EAR MICROPHONE DATA USING HIDDEN MARKOV MODELS (HMM)
Remzi Serdar Kurcan
Lieutenant Junior Grade, Turkish Navy B.S., Turkish Naval Academy, 1999 Submitted in partial fulfillment of the
requirements for the degree of
MASTER OF SCIENCE IN ELECTRICAL ENGINEERING
and
MASTER OF SCIENCE IN SYSTEMS ENGINEERING
from the
NAVAL POSTGRADUATE SCHOOL March 2006
Author: Remzi Serdar Kurcan
Approved by: Monique P. Fargues Thesis Advisor David Jenn Co-Advisor Ravi Vaidyanathan Second Reader Jeffrey B. Knorr
Chairman, Department of Electrical and Computer Engineering Dan Boger
iv
v
ABSTRACT
This thesis is part of an ongoing larger scale research study started in 2004 at the Naval Postgraduate School (NPS) which aims to develop a speech-driven human-machine interface for the operation of semi-autonomous military robots in noisy operational environments. Earlier work included collecting a small database of isolated word utterances of seven words from 20 adult subjects using an in-ear microphone. The research conducted here develops a speaker-independent isolated word recognizer from these acoustic signals based on a discrete-observation Hidden Markov Model (HMM).
The study implements the HMM-based isolated word recognizer in three steps. The first step performs the endpoint detection and speech segmentation by using short-term temporal analysis. The second step includes speech feature extraction using static and dynamic MFCC parameters and vector quantization of continuous-valued speech features. Finally, the last step involves the discrete-observation HMM-based classifier for isolated word recognition. Experimental results show the average classification performance around 92.77%. The most significant result of this study is that the acoustic signals originating from speech organs and collected within the external ear canal via the in-ear microphone can be used for isolated word recognition.
The second dataset collected under low signal-to-noise ratio conditions with additive noise results in 79% recognition accuracy in the HMM-based classifier. We also compared the classification results of the data collected within the ear canal and outside the mouth via the same microphone. Average classification rates obtained for the data collected outside the mouth shows significant performance degradation (down to 63%), over that observed with the data collected from within the ear canal (down to 86%). Recall that the ear canal dampens high frequencies. As a result, the HMM model derived for the data with dampened higher frequencies does not accurately fit the data collected outside the mouth, resulting in degraded recognition performances.
vi
vii
TABLE OF CONTENTS
I. INTRODUCTION...1
A. INTRODUCTION TO AUTOMATIC SPEECH RECOGNITION (ASR)...2
B. DIMENSIONS OF DIFFICULTY IN ASR TECHNOLOGY FOR HUMAN – COMPUTER INTERACTIONS...4
C. THESIS OBJECTIVE AND EQUIPMENT USED ...6
D. PREVIOUS RELATED RESEARCH ...8
E. THESIS ORGANIZATION...10
II. IN-EAR MICROPHONE DATA DIGITAL PRE-PROCESSING...13
A. INTRODUCTION...13
B. SPEECH PRE-PROCESSING ...18
1. Spectral Analysis...18
a. Spectrogram Analysis ...19
b. Mean Correction ...21
c. High-Pass Filtering vs. Pre-Emphasis Filtering and Band-Pass Filtering ...21
d. Framing and Windowing for Short-term Analysis...25
2. Speech Boundary Detection ...26
a. Short-term Energy Measure (STE Measure)...27
b. Short-term Zero-crossing Rate (STZC Rate) ...27
c. Endpoint Detection Algorithm from STE and STZC Measures...28
d. Endpoint Detection from Modified Teager’s Energy ...30
III. SPEECH FEATURE EXTRACTION AND VECTOR QUANTIZATION...33
A. INTRODUCTION...33
B. CEPSTRAL ANALYSIS ...34
1. Mel-Frequency Cepstral Coefficient (MFCC) Computation...38
2. LPC-derived Cepstral Coefficients ...46
C. VECTOR QUANTIZATION AND CODEBOOK GENERATION ...47
1. Vector Quantization (VQ)...47
2. Distortion Measure ...49
3. K-Means Algorithm ...50
4. Codebook Generation from Speech Features...53
IV. HIDDEN MARKOV MODELS (HMM) CLASSIFIER FOR ISOLATED WORD RECOGNITION (IWR) ...57
A. INTRODUCTION TO HMM ...57
1. Definition of the IWR Problem...60
2. Notations ...61
3. Discrete-Time Markov Process...62
viii
4. Extension to Discrete-Symbol HMMs...64
a. Example 4.2: Three-State Ergodic Hidden Markov Model...66
b. Example 4.3: Five-State Left-to-right Hidden Markov Model ...67
B. THE THREE FUNDAMENTAL PROBLEMS FOR HMM ...69
1. Solution to the Evaluation Problem ...69
a. The Direct Evaluation...70
b. The Forward-Backward Procedure...71
2. Solution to the Decoding Problem ...74
a. The Viterbi Algorithm...75
3. Solution to the Training Problem...78
a. The Baum-Welch Re-Estimation Algorithm (B-W Algorithm) ...78
b. Viterbi Re-Estimation Algorithm...81
C. HMM IMPLEMENTATION ISSUES...82
1. Scaling the B-W Re-estimation Formulas...82
2. Training with Multiple Observation Sequences...85
D. ISOLATED WORD RECOGNIZER IMPLEMENTATION USING HMMS...87
V. HMM CLASSIFICATION RESULTS ...93
A. SYSTEM OVERVIEW ...93
B. DHMM RECOGNIZER CLASSIFICATION RESULTS ...96
1. Overall Recognition Results...96
2. Experimental Results for the Second Dataset ...99
3. Timing Issues...101
VI. CONCLUSIONS AND RECOMMENDATIONS...103
A. SIGNIFICANT RESULTS AND CONCLUSIONS...103
B. RECOMMENDATIONS FOR FUTURE WORK...105
APPENDIX A. SPEECH FRONT-END DETECTION MATLAB PROGRAMS ...107
1. SPEECH ENDPOINT DETECTION FROM THE SHORT-TERM ENERGY AND ZERO-CROSSING RATE ...107
2. SPEECH ENDPOINT DETECTION FROM THE FRAME-BASED MODIFIED TEAGER ENERGY...111
3. SPEECH CROPPING BASED ON ENDPOINT DETECTION...114
APPENDIX B. SPEECH FEATURE EXTRACTION AND VECTOR QUANTIZATION MATLAB PROGRAMS...117
1. MEL-FREQUENCY CEPSTRAL COEFFICIENT (MFCC) COMPUTATION...117
2. LPC-DERIVED CEPSTRAL COEFFICIENT (LPC-CC) COMPUTATION...125
3. K-MEANS CLUSTERING ALGORITHM ...128
4. CODEBOOK GENERATION FOR VECTOR QUANTIZATION ...130
ix
1. HMM BAUM-WELCH RE-ESTIMATION ...133
2. HMM VITERBI TRAINING ALGORITHM...135
3. MULTIPLE-OBSERVATION HMM TRAINING ALGORITHM ...137
4. HMM LOGLIKELIHOOD COMPUTATION ALGORITHM...140
5. HMM RECOGNITION ALGORITHM...141
APPENDIX D. HMM CLASSIFICATION RESULTS FOR MULTIPLE EXPERIMENTS ...145
LIST OF REFERENCES ...147
x
xi
LIST OF FIGURES
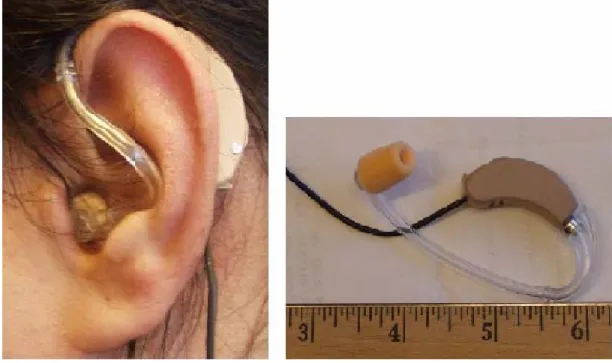
Figure 1.1. Foam-Encased in-Ear Microphone Device...7
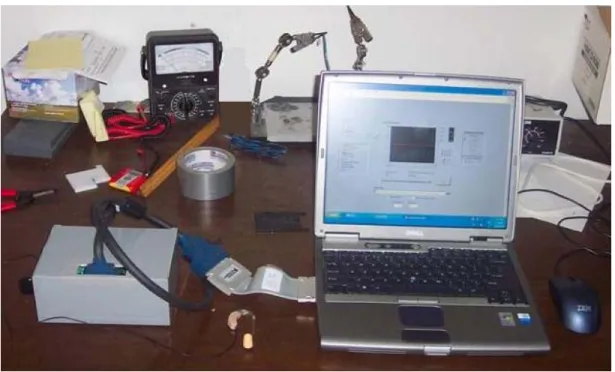
Figure 1.2. Equipment Components Used for Speech Data Collection. ...8
Figure 1.3. Throat and Air-Conductive Microphone (From [Zhang, 2004].). ...9
Figure 1.4 Main framework of the Isolated Word HMM recognizer...10
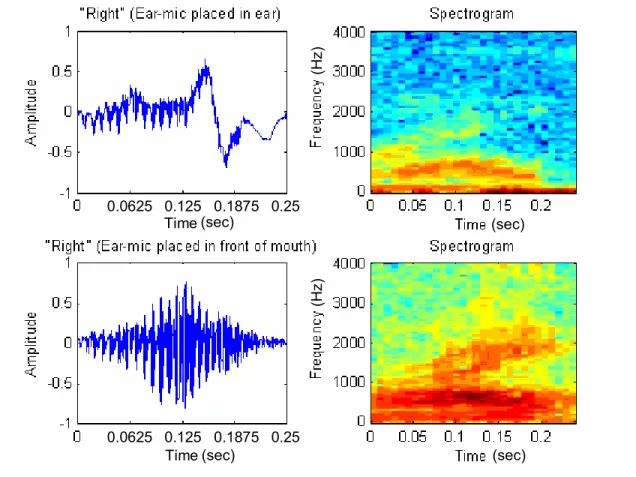
Figure 2.1. The Word “Right” Recorded via Ear-Microphone. ...18
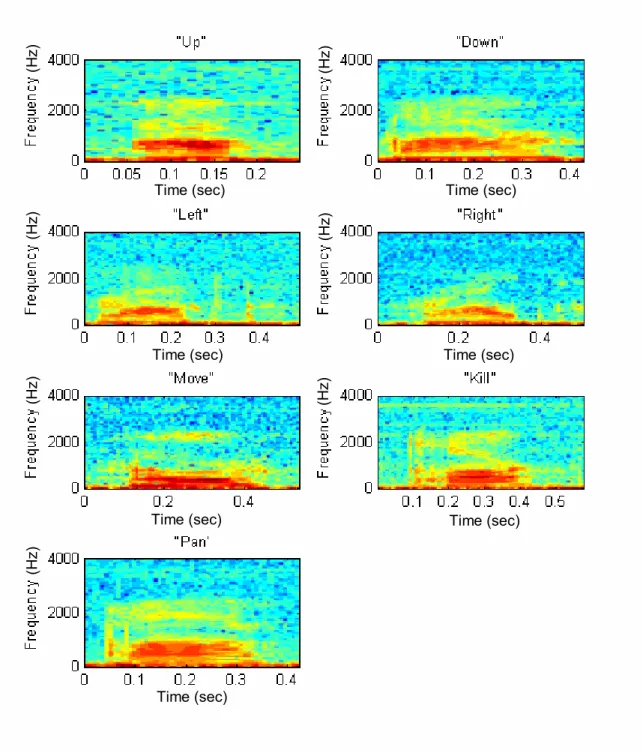
Figure 2.3. Spectrograms for the Utterances of Each Word in the Vocabulary...20
Figure 2.4. Mean Correction on One Trial of the Word “Down;” Top Plot: before Correction, Bottom Plot: after Correction. ...21
Figure 2.5. Frequency Response of the IIR Elliptic HPF...23
Figure 2.5. High-Pass Filtering Effect on One Trial of the Word “Down.” ...24
Figure 2.6. Typical Example of the Use of Short-Term Energy and Zero-Crossing Rate in Endpoint Detection...29
Figure 3.1. Linear Acoustic Model of Human Speech-Production (After [Picone, 1993])...35
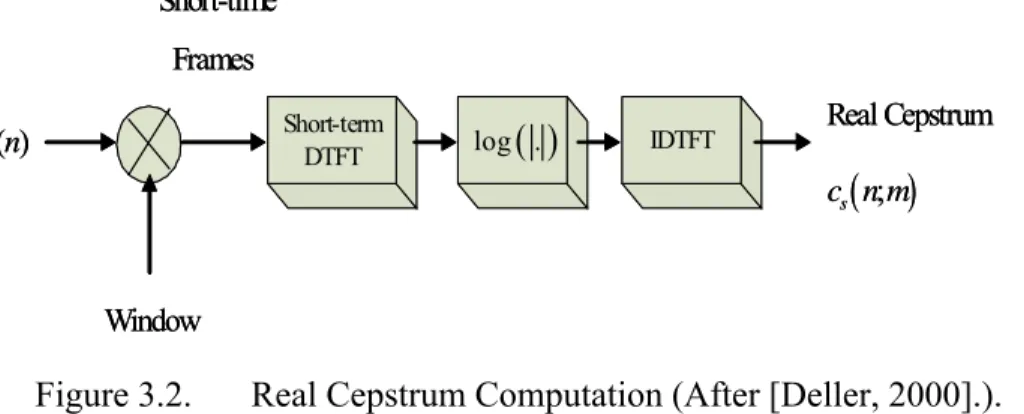
Figure 3.2. Real Cepstrum Computation (After [Deller, 2000].). ...36
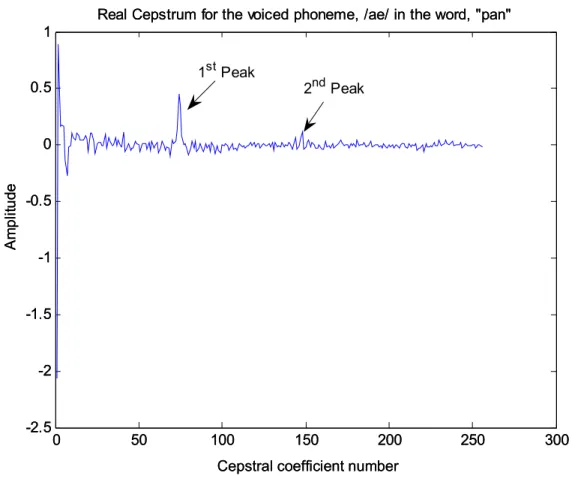
Figure 3.3. Real Cepstrum Computed for the Voiced Phoneme /ae/ in the Word “pan.”..37
Figure 3.4. The First 20 Coefficients of the Real Cepstrum for the Phoneme /ae/. ...38
Figure 3.5. Block Diagram for the MFCC Feature Extraction...40
Figure 3.6. Mel-scale Filter Band...42
Figure 3.7. Differential Filter Used to Compute Delta-MFCC Parameters. ...44
Figure 3.8. MFCC and Delta MFCC Parameters Extracted from the Ear-Microphone Data of the Spoken Word “Pan.” ...45
Figure 3.9. Cepstrogram Plot of the MFCC and Delta MFCC Parameters Extracted from the Word “Pan.” ...45
Figure 3.10. A Typical Example of Uniform Clustering of Two-Dimensional Space for Vector Quantization...49
Figure 3.11. Flow Diagram for the K-means LBG Clustering Algorithm. ...51
Figure 3.12. Average Distortion versus Codebook Size. ...54
Figure 3.13. Block Diagram for Vector Quantization of Speech Feature Vectors (After [Rabiner, 1993])...55
Figure 4.1. Inter-Speaker Temporal Variability in the Word “Right” Spoken by Four Different Speakers. ...58
Figure 4.2 An Illustration of a Discrete Observation HMM Classifier for IWR. ...60
Figure 4.3. Three-State Discrete-Time Markov Chain...64
Figure 4.4. Three-State Ergodic HMM. ...67
Figure 4.5. Five-State Left-to-Right HMM...68
Figure 4.6. The Lattice Structure Used to Derive the Forward Recursion (After [Deller, 2000])...72
Figure 4.7 Trellis Structure Illustrating the Viterbi Algorithm for a Three-State HMM..77
Figure 4.8. Illustration for the Computation of the Probabilityξt
( )
i j, (After [Rabiner, 1993])...80xii
Figure 4.9. Block Diagram of the Isolated Word HMM Recognizer ([After (Rabiner, 1993)]...89 Figure 5.1. System Block Diagram of the Isolated Word HMM Recognizer (After
[Sorensen, 2005].)...93 Figure 5.2. Average Classification Rates for Testing Sets; 80 Experiments, 62.5%
Training, 37.5% Testing. ...97 Figure 5.3. 95% Confidence Intervals and the Average Classification Rates for
Testing Sets; 80 Experiments...98 Figure 5.4. 95% Confidence Intervals and the Average Classification Rates for the
xiii
LIST OF TABLES
Table 2.1. English Phonemes and Characteristics for Vocabulary Words of Interest. ...16 Table 4.1. List of Basic Notations for HMMs. ...62 Table 5.1. Confusion Matrix for the Average Classification Rates for Testing Sets; 80
Experiments, 62.5 % Training, 37.5% Testing...97 Table 5.2. 95% Confidence Level Intervals for Testing Sets; 80 Experiments. ...98 Table 5.4. Average Classification Rates for the Second Data Set; 80 Experiments...99 Table 5.5. 95% Confidence Level Intervals for the Second Data Set; 80 Experiments. ..99 Table 5.3. Average Simulation Run-Times for 80 Experiments...101
xiv
xv
LIST OF ACRONYMS AND ABBREVIATIONS
A/D Analog-to-Digital ANC Active Noise Control ANN Artificial Neural Network
ARPA Advanced Research Projects Agency ASR Automatic Speech Recognition
B-W Baum-Welch
CMC Cepstral Mean Correction CSR Continuous Speech Recognition
DARPA Defense Advanced Research Projects Agency DCT Discrete Cosine Transform
DFT Discrete Fourier Transform
DHMM Discrete-symbol (or discrete-observation) Hidden Markov Model DSP Digital Signal Processing
DTW Dynamic Time Warping EM Expectation-Maximization FFT Fast Fourier Transform FIR Finite Impulse Response FPGA Field-Programmable Gate Array FTE Frame-Based Teager Energy HMM Hidden Markov Model
IID Independent and Identically Distributed IIR Infinite Impulse Response
IWR Isolated Word Recognition
LBG Linde-Buzo-Gray
LFCC Linear Frequency Cepstrum Coefficient LPC Linear Predictive Coding
LPC-CC LPC-derived Cepstral Coefficient MFCC Mel-frequency Cepstral Coefficient
NIST National Institute of Standards and Technology PLP Perceptual Linear Prediction
xvi RC Reflection Coefficient
RCC Real Cepstral Coefficient RCD Remote Control Device SNR Signal-to-Noise Ratio STE Short-Term Energy
STZC Short-Term Zero-Crossing
TIMIT Texas Instruments and Massachusetts Institute of Technology VQ Vector Quantization
xvii
ACKNOWLEDGMENTS
First, I would like to thank my thesis advisor Dr. Monique P. Fargues. Her precious guidance, continuous help, patience with my never-ending questions and inspiration kept me on track during the course of this thesis work. I would like to also thank my co-advisor Dr. David Jenn and my second reader Dr. Ravi Vaidyanathan for their valuable contributions.
Special thanks go to my best friends John Ortiz and his wife Danielle Ortiz. Their friendship and hospitality will never be forgotten.
Finally, I owe my parents Kemal Kurcan and Emel Kurcan and my sister Selda Kurcan for their endless support and love. Their encouragement during both bad times and good times always kept my spirits high when I was alone 10,000 miles away from home. I dedicate this thesis to them.
xviii
xix
EXECUTIVE SUMMARY
The performance of modern speech recognizers may turn out to be poor under adverse conditions, especially when classifiers are trained under high signal-to-noise ratio (SNR) environments like noise-free chambers (typically where SNR 30 dB≥ ) and operated in real-world surroundings of relatively lower SNR. Consequently, many researchers have recently focused on the task of building more noise-robust recognizers that may be operated in noisy environments (within a car or a noisy flight cabin) with higher accuracy.
This thesis study is part of an ongoing larger scale research started in 2004 at the Naval Postgraduate School which aims to develop a speech-driven human-machine interface command and control package applicable for the operation of semi-autonomous military robots in noisy operational environments. Earlier related research by Vaidyanathan [Vaidyanathan, 2004b] showed that the in-ear microphone device selected was sensitive enough to make use of tongue movements for a human-machine interface, which led to considering its extension to speech signals for isolated word recognition.
This thesis study extended the earlier work by Newton [Newton, 2006] who collected a database of isolated word utterances of seven words from 20 adult subjects by using the in-ear microphone. The research conducted here develops a speaker-independent isolated word recognizer based on these acoustic signals and a discrete-observation Hidden Markov Model (HMM). Hence, the objectives of this research were to:
• Develop a MATLAB simulation for a simple yet complete isolated word Hidden Markov Model (HMM) recognizer,
• Investigate the feasibility of using the acoustic speech signals collected within the external ear canal via the in-ear microphone for isolated word recognition,
• Explore the performance and noise-robustness of the in-ear microphone data for isolated word recognition in noisy operational environments.
xx
The speech database of this study included seven isolated words {down, up, right, left, pan, move, kill}, each repeated 50 times by 20 adult subjects and recorded with an 8 kHz sampling frequency.
The study began by investigating the characteristics of the in-ear microphone data by spectrogram analysis. The in-ear microphone data can be considered a low-pass filtered version of the speech signals emitted in front of the mouth. Spectrogram analysis showed that most of the signal energy was gathered below 2.5 kHz in the acoustic signals of the isolated word utterances. Mean correction was first applied to the in-ear microphone data to eliminate the DC bias of the microphone and then a high-pass filter was used to remove the noise distortion collected around 100 Hz based on the spectrogram analysis. After high-pass filtering, the acoustic signal is split into frames for short-term analysis. The most crucial part of pre-processing of the in-ear microphone data is the front-end detection to locate the speech boundaries and segment the acoustic signals of the isolated words from the non-speech or silence portion. This task becomes harder when bodily-created noises like gulps, coughs, tongue clicks or lip smacks occur during the in-ear microphone recordings. Non-speech events or noise may complicate the endpoint detection of speech waveform especially when dealing with words starting or ending with low energy phonemes (such as the weak fricative /f/, weak plosive burst /p/ or /t/) or nasals (such as /n/ at the end).
Two endpoint detection algorithms were implemented in MATLAB to determine the beginning and the termination of speech in a given isolated word utterance. The first segmentation algorithm combined two short-term speech signal analysis. The short-term energy (STE) measure was used to estimate initial speech boundaries while a second search of the zero-crossing rate (ZCR) was used to refine these boundaries. The second speech segmentation algorithm studied was based on the frame-based modified Teager energy. However, simulations showed this detection approach required longer processing time than the first algorithm due to its computationally-expensive search algorithm. In addition, the results showed the two algorithms provided comparable detection of endpoint locations. As a result, the focus rested on the first approach that uses STE and
xxi
ZCR to segment the in-ear microphone database due to its more computationally-efficient algorithm.
The purpose of speech feature extraction is to convert speech waveform to some type of parametric representation at a lower information rate for further analysis. Speech signals have non-stationary characteristics. As a result, the speech waveforms are commonly split into small frames (typically 5 ms to 40 ms) in which the signal characteristics are considered quasi-stationary to allow for short-term spectral analysis and feature extraction. A wide range of parametric speech representations may be used to generate input feature to speech recognizers. The most commonly used speech features include the Linear Predictive Coding (LPC) Coefficients, Real Cepstral Coefficients (RCC), LPC-derived Cepstral Coefficients (LPC-CC) and Mel-frequency Cepstral Coefficients (MFCC). LPC-CC and MFCC parameters were considered in this study to determine the best feature set for the in-ear microphone database. MFCC parameters are usually preferred over others because they are less susceptible to speaker-dependent variations likely to be present in speech signals. Classification results showed that MFCC parameters outperformed the LPC-CC parameters in recognition accuracy for the data under investigation. Dynamic delta-MFCC parameters were also derived to augment the spectral representation of the static MFCC parameters with some temporal information.
A discrete-symbol HMM (DHMM) with eight hidden states was selected as the classifier type because that type of classifier is simple to implement, has low computational load, and has been shown to perform well in isolated word recognition applications. We selected a codebook of length 128 which was generated by applying the K-means clustering algorithm to the training set of speech features. Next, vector quantization (VQ) was applied to map the continuous-valued speech features (12 MFCC and 12 delta-MFCC parameters) to a discrete set of codebook indices (or symbols), and quantized features used to estimate the optimum model parameters.
Two thirds of the data were used for generating the codebook and training the DHMM. The remaining one third of the data were used for testing the performance of the isolated word HMM recognizer. The average classification rate for this study’s multiple-speaker isolated word HMM recognition system was 92.77%. Results show that the
xxii
acoustic signals originating from speech organs and collected within the external ear canal via an in-ear microphone could be effectively used for isolated word recognition.
The second dataset collected under low SNR conditions with additive noise resulted in 79.24% recognition accuracy in the HMM-based classifier. This result is consistent with the theoretical noise-shielding property of the human ear, thus justifying the use of in-ear microphone data for speech enhancement and improved recognition under low-SNR conditions.
Finally, we investigated using the in-ear microphone outside the mouth and comparing classification results obtained for the data collected within the ear canal and outside the mouth. Average classification rates obtained for the data collected outside the mouth shows significant performance degradation (down to 63%), over that observed with the data collected from within the ear canal (down to 86%). The ear canal dampens high frequencies. As a result, the HMM model derived for the data with dampened higher frequencies does not accurately fit the data collected outside the mouth, resulting in degraded recognition performances.
I.
INTRODUCTION
This thesis study is a part of an ongoing larger scale research started in 2004 at NPS which aims to contribute to the development of a speech-driven human-machine interface command and control package applicable for the operation of semi-autonomous military robots in noisy environments. Towards this end, this research focused on developing an isolated word recognizer using Hidden Markov Models (HMM). The HMM classifier was trained on air pressure signals collected from within the ear-canal via an in-ear microphone because previous research results have shown these signals are less susceptible to environmental noise distortions than those collected in front of the mouth [Westerlund, 2003]. In a broad sense, the ultimate goal of Automatic Speech Recognition (ASR) is to build and train computers/machines or artificial intelligence that can receive and interpret spoken instructions and act upon them properly.
Great progress in ASR has yielded many practical applications in recent years, such as user-friendly speech interfaces in control consoles of cars, credit card number recognition and the verbal selection of menus over the telephone. However, after 50 year-long research efforts and considerable advances in ASR notwithstanding, robust speech recognition for human-machine interface still remains a challenging problem today. The performance of the modern speech recognizers may turn out to be poor under adverse conditions, especially when classifiers are trained under high signal-to-noise ratio (SNR) environments like noise-free chambers (typically where SNR 30 dB≥ ) and operated in real-world surroundings of relatively lower SNR [Deller, 2000]. In contrast, a healthy human listener’s performance is usually far more stable on average under similar training and operating conditions. Unfortunately many researchers agree that human-quality, adaptively-learning and noise-robust machines that recognize and interpret human speech will not be achieved in the near future [Deller, 2000; Gold, 2000; Owens, 1993]. However, even incremental improvements leading toward this ultimate goal in ASR are of great importance.
Next, a brief history of speech recognition technology is presented before addressing the difficulties in the ASR area.
A. INTRODUCTION TO AUTOMATIC SPEECH RECOGNITION (ASR)
Speech is the natural and the fundamental way of communication for most humans. Technically speaking, Automatic Speech Recognition (ASR) refers to a mechanism (hardware and software combined) that stores some representations of distinguishing characteristics of speech with a source of input equipment, such as a microphone and further processes these representations to match them to incoming speech in an effort to interact with machines, computers and/or human users
The first primitive recognizer was developed at Bell Labs during the early 1950s. However, it was the 1960s that brought many major breakthroughs to the field of ASR. Some of these achievements are noteworthy to mention herein because they did not only develop significant tools for speech recognition but also established the very basic concepts on which this thesis work is mainly based. Specifically, the development of the Fast Fourier Transform (FFT) by Cooley and Tukey in 1965 decreased the computational load of Discrete Fourier Transform (DFT) with a faster algorithm, thereby enabling the practical implementations of Digital Signal Processing (DSP) custom chips [Cooley, 1965; Gold, 2000]. Oppenheim, Schafer, and Stockham introduced Cepstral Analysis which performs deconvolution of the speech signal to separate an excitation sequence from an impulse response convolved with it [Oppenheim, 1968]. Cepstral coefficients and many derivatives have been widely used to represent the short-term spectral envelope of speech signals thus far.
It was also the late 1960s and early 1970s that saw another useful method for speech analysis, known as Linear Predictive Coding (LPC). One of the earliest and complete papers on the application of linear prediction to speech analysis was published by Atal and Schroeder [Atal, 1971; Deller, 2000]. Basically, LPC uses a pole-only (autoregressive) filter to model the speech signal. LPC coefficients and its derivatives are extensively used for transmitting speech spectral envelope information [Gold, 2000].
Most notably, the foundations for the statistical technique of Hidden Markov Modeling, which models an observed sequence as produced by a sequence of hidden states, dates back to the 1960s as well. However, the first successful applications of Hidden Markov Modeling to speech recognition were realized in the 1970s [Gold, 2000].
Baum and his colleagues developed a popular expectation-maximization (EM) algorithm, known as the Baum-Welch Re-estimation Algorithm (or Forward-Backward Algorithm), to estimate the parameters of a Hidden Markov Model (HMM) iteratively [Baum, 1966; Baum, 1970]. Hidden Markov Models (HMM) and the Baum-Welch Re-estimation Algorithm are widely used today in contemporary state-of-the-art speech recognition systems.
Dynamic Time Warping (DTW), a deterministic alternative approach to the statistical HMM was also introduced in the 1970s. DWT normalizes the different-length utterances of the same word and applies template-based classification to speech recognition.
Many different approaches incorporating DTW, HMM and Artificial Neural Networks (ANN) were developed for speech recognition in the 1970s. Among these studies, the project of the Advanced Research Projects Agency (ARPA), was a remarkable achievement in that it performed a 1000-word ASR system by using connected speech from a few speakers with a word error rate of less than 10% [Gold, 2000]. In the 1980s, the project of the Defense Advanced Research Projects Agency (DARPA Project) and the major other programs conducted by Texas Instruments and the Massachusetts Institute of Technology (TIMIT Project) and the National Institute of Standards and Technology (NIST) primarily concentrated on the collection of large corpora used for training and testing speech recognizers. These large corpora were subsequently used by the ASR research community at large for performance comparison of different approaches applied to speech recognition.
The ASR community witnessed some other important developments in the 1980s as well. Among those, the Mel-Cepstrum Analysis introduced by Davis [Davis, 1980], and the Dynamic Cepstral Coefficients proposed by Furui [Furui, 1986] can be considered remarkable techniques for speech feature-extraction due to significant improvement in recognition accuracy.
As for the speech recognizers of the 1980s, many researchers were experimenting with frame-based HMM recognizers, ANN recognizers or hybrid schemes combining HMM and ANN in isolated and/or continuous contexts of speech [Gold, 2000]. Most
importantly, the contemporary speech recognition systems of today still use these methods predominantly.
In the following decades, advances in computationally-efficient digital computing power and abundant memory made the inexpensive implementation of DSP chips and Field-Programmable Gate Arrays (FPGA) possible. Needless to say, this has been a major boon to the performance of ASR technology. Commercial ASR applications such as speech-to-text dictation software have been available and used extensively since the late 1990s. However, despite considerable progress, many aspects of ASR are still mysterious and problematic even today because the engineering view of human speech production and human ear perception is not yet fully conclusive. Hence, the research community believes that the field of speech recognition is still in its early infancy and will remain to pose a challenging problem for the near future. [Deller, 2000; Gold, 2000].
Next, the dimensions of difficulty involved in ASR are discussed because understanding the complexity of the ASR problem is the first step to practical and achievable solutions.
B. DIMENSIONS OF DIFFICULTY IN ASR TECHNOLOGY FOR HUMAN –
COMPUTER INTERACTIONS
Waibel and Lee addressed the question of complexity involved in ASR in [Waibel, 1990] as “dimensions of difficulty.” These are the factors that determine the complexity and the specifications of an ASR system. Deller et al. summarizes some of these factors that render speech recognition methods complicated [Deller, 2000].
First, speaker-dependency plays a defining role in speech recognition systems. A speaker-dependent ASR system is trained and tested on the utterances of a specific speaker to learn the representations characterizing speech. Thus, this type of recognizer is designed specifically to recognize the speech of its trainer. Most commercially available speech-to-text dictation software mainly uses this mode because it needs to be trained by each specific user before operation. On the contrary, a speaker-independent system is trained on many speakers in an effort to make the system capable of recognizing the speech of a generalized population who may be outside of the training population. The models used in this type of recognizers are derived from expected characteristics and are not fine-tunable to the end users. Therefore, there is no need for further training when a
new speaker is introduced to a speaker-independent system. This operation mode is more convenient for a telephone application where users navigate through speech-activated menus. However, the convenience of speaker-independent systems may come with lower recognition accuracy than that obtained with speaker-dependent systems.
Second, continuous speech recognition (CSR) systems may seem natural and user-friendly at first glance, but they require more sophisticated recognizers to handle word boundaries issues. Isolated word recognition (IWR) systems minimize this problem as they require a deliberate pause between each utterance to simplify the end-point detection algorithm needed to locate the beginning and the end of speech. As a result, IWR is expected to have higher recognition accuracy. Generally speaking, CSR systems require more CPU power and memory than ISR systems. Further, inter-speaker and intra-speaker variations of the training population in articulation, pronunciation and intonation make it even harder for CSR systems to determine speech boundaries, thus yielding lower classification accuracy compared to that obtained with ISR systems.
Third, the vocabulary size is another key factor that affects the dimension of difficulties in recognition. Considering the number of ambiguous utterances (e.g., “knight” and “night”) and acoustic confusability (e.g., “beer” and “bear”) in the vocabulary of interest naturally, the performance of a particular recognizer is expected to degrade with the increasing vocabulary size [Deller, 2000]. Small vocabulary (less than 100 words) recognizers can perform relatively simpler tasks such as destination sorting systems for shipping tasks, credit card number or telephone number recognition. In these examples, specific models for each word in the vocabulary can be stored in the system and recognition is achieved by an exhaustive search through the whole vocabulary. As the vocabularies become larger, the recognition task creates increasing memory requirements. When training and modeling for each word in a larger vocabulary becomes impractical, models of subword units like syllables and phonemes are preferred over models of words.
Fourth, the waveform of a speech signal is very susceptible to the variations in channel, microphone characteristics, room reverberation or background noise. Nonlinear
effects of noise and channel distortion can be very destructive for recognition tasks, especially when no a-priori knowledge is available about their characteristics.
Finally, another important parameter in ASR system performances is whether any linguistic information is built into the recognizer to fine-tune algorithms. Speech recognizers are trained on basic speech unit models such as phones, phonemes, syllables or words. Linguistic (or grammar) constraints deal with how these basic units should be concatenated to form a meaningful message in a particular language. Such linguistic information may be embedded into more sophisticated recognizers.
All the above factors have a major impact on the success of a particular ASR system and add up to determine the necessary level of system complexity in design phase. Among all of the above-mentioned factors, performance degradation in noisy real-world environments is probably the most significant factor limiting the progress of ASR technology today. Consequently, many researchers have recently focused on the task of building more noise-robust recognizers that may be operated in noisy environments (within a car or a noisy flight cabin) with higher accuracy [Moon, 1997; Shozakai, 1998; Graciarena, 2003]. Lippmann et al. reported a direct comparison of human listeners and machine recognizers on a range of tasks in his speech recognition research [Lippman, 1997; Gold, 2000]. His findings supported the fact that noise considerably degrades the performance of ASR systems even for simple tasks, whereas the superiority of human performance increases in noise and for more difficult speech contexts such as spontaneous speech unlike machine recognizers. His experimental results on human perception of distorted speech sets a good benchmark for the ultimate goal of more humanlike, noise-robust and adaptive ASR systems of the future [Gold, 2000].
Next, the main objectives are presented as well as the specifications of the experimental ASR system on which this thesis work is focused.
C. THESIS OBJECTIVE AND EQUIPMENT USED
The objective of this research was to design an isolated word HMM recognizer with a small vocabulary to evaluate the effectiveness of the acoustic speech signals collected within ear canal on speech recognition. This work uses a speech database collected earlier by Newton [Newton, 2006] which consists of isolated word utterances
from 20 adult subjects. Each subject repeated a set of seven isolated words {down, up, right, left, pan, move, kill} 50 times, recorded with an 8 kHz sampling frequency.
The speech signals were collected via the in-ear microphone shown in Figure 1.1 in an indoor office environment with medium SNR levels to simulate real-world conditions and potential operational environments. A second set of data were collected under additive noise in the same office environment with the in-ear microphone located in the ear first and then in front of the mouth to evaluate the noise shielding properties of the in-ear microphone. Figure 1.2 shows the whole equipment set-up used for database collection including the in-ear microphone, analog-to-digital (A/D) converter, PCMCIA card and a general purpose notebook computer.
Figure 1.2. Equipment Components Used for Speech Data Collection.
Next, the motivation behind this study is discussed and previous related research summarized.
D. PREVIOUS RELATED RESEARCH
As ASR technologies are transferred more and more to daily-life applications, the need for greater robustness to noisy environments is growing. A great deal of recent work has highlighted the need for robust speech detection, enhancement and recognition via the use of multiple-microphone arrays [Zhang, 2004] or more sophisticated adaptive noise canceling devices [Westerlund, 2003].
Westerlund et al. proposed a sophisticated approach to improve speech recognition where a Hidden Markov Model (HMM) recognizer was used to evaluate the quality and intelligibility of speech signals recorded using an ear-microphone. One of the pieces of equipment used in his research was an Active Noise Control (ANC) headset equipped with an in-ear microphone and ear muffs. This work showed that the high-pass filtering property of the passive absorbers (ear-muffs) is convenient for noise reduction when combining an ANC headset with an in-ear microphone since the speech signal in the external auditory canal is a low-pass filtered version of the speech signal in front of the mouth. Consequently, Westerlund reported that this combination of passive and
active noise reduction methods with the use of an ear-microphone had considerable impact on speech recognition performances, resulting in a 50% recognition rate increase in a severely noisy environment.
The idea that a microphone can be placed on other locations of the body rather than just in front of the mouth was also proposed by other researchers [Zhang, 2004; Graciarena, 2003]. Zhang et al. developed a headset prototype that integrates several heterogeneous sensors including a close-talk and a throat microphone shown in Figure 1.3 for robust speech detection and recognition, achieving promising results.
Figure 1.3. Throat and Air-Conductive Microphone (From [Zhang, 2004].). Graciarena et al. also developed a method that combines standard microphone and throat microphone features in noisy continuous speech recognition experiments. This research provided significant word error rate reduction compared to that obtained with a single microphone [Graciarena, 2003]. Although all the above-mentioned research reported considerable robustness and improvement on speech recognition, the implementations used were either intrusive or involved rather complicated schemes in terms of computational load.
Vaidyanathan et al. recently introduced a unique signal processing strategy which maps the air flow signals generated from tongue movements collected within the ear canal to specific commands [Vaidyanathan, 2004a]. The in-ear microphone used in this work is simpler in design and more convenient to wear when compared to more complicated and intrusive alternatives. The microphone earpiece contains a small passive
sensor, which is commercially available off-the-shelf and is similar to those commonly found in hearing aids. This work showed that various tongue movements within the oral cavity create unique and traceable pressure changes in the human ear, which can be captured via an ear-microphone and classified accurately. These results were applied to the hands-free tele-operation of a mobile robot named “Whegs II hexapod robot.” This research also reported that
…Conventional signal processing techniques are generally inadequate to recognize the subtle pressure variations in the ear canal resulting from tongue movement. The ear canal itself is an interference-ridden, noise-amplified environment for acoustic recording. External noise (environmental sounds) can also easily obscure the slight pressure deviations accompanying tongue movement [Vaidyanathan, 2004b].
This earlier research study showed that the in-ear microphone device selected was sensitive enough to collect tongue movements, which led to considering its extension to speech signals. The next section presents the organization of this thesis work.
E. THESIS ORGANIZATION
This initial chapter of the thesis provided an introduction to ASR technology and focused on the main challenges in the ASR field so as to present the fundamentals of ASR. Then the chapter introduced the main objective of this thesis work, equipment used for speech data collection and explained the earlier related research.
Figure 1.4 represents the main framework of the Isolated Word HMM recognizer built to test the viability of using ear-microphone data for speech recognition in this research. Speech Endpoint Detection Speech Feature Extraction Vector Quantization ClassificationHMM Speech Endpoint Detection Speech Feature Extraction Vector Quantization ClassificationHMM
Figure 1.4 Main framework of the Isolated Word HMM recognizer
Chapter II first presents a discussion of the characteristics of in-ear microphone data. Next, the chapter covers the processing of these acoustic signals. The
pre-processing involves the short-term signal analysis, the endpoint detection algorithm to determine the onset and the termination of a spoken word in a given acoustic speech signal.
Chapter III introduces the popular speech feature coefficients used to extract spectral information from acoustic signals. The computation of Mel-frequency Cepstral Coefficients (MFCC) is explained using a step-by-step approach. Then, the dynamic delta parameters (delta-MFCC) are derived from the MFCC parameters to supplement information of MFCC parameters with information on its rate of change over time. The rest of the chapter deals with the vector quantization (VQ) since a discrete-observation HMM is to be used rather than a continuous-density HMM. The K-means clustering algorithm is described and used to generate a codebook which maps the continuous-valued speech features (MFCC and delta-MFCC parameters) to a discrete set of codebook indices.
Chapter IV discusses the fundamentals of HMM, the three basic HMM problems and their efficient solution algorithms. The chapter concludes with the discrete-symbol HMM implementation of the isolated word recognition (IWR) system to justify the effectiveness of the air flow signals collected within the ear canal for speech recognition.
Chapter V provides a system overview of the isolated word HMM recognizer and presents HMM classification results.
II.
IN-EAR MICROPHONE DATA DIGITAL PRE-PROCESSING
A. INTRODUCTION
Traditional speech recognition systems typically use a directional microphone to collect speech data. Most directional microphone systems are successful in low-noise environments. However, speech recognition performances may degrade significantly in high noise surroundings, and many different methods have been proposed to improve the robustness of speech recognition systems. Some of these include complex techniques using multiple microphone arrays (to work on multi-channel data), adaptive noise cancellation methods, combining different types of speech features or using sophisticated endpoint detection schemes. However, most of them are either intrusive or impractical to implement in real world applications.
In an effort to guard against noisy surroundings and allow for a relatively simple speech recognition approach, an unconventional recording device, an earpiece microphone placed inside the external ear canal was used for capturing the speech signal. Data were collected using an 8 kHz sampling rate to ensure at least telephone-quality-like spectral information would be available to the recognizer. A small vocabulary consisting of seven isolated words was recorded in an earlier study [Newton, 2006] and included the following words: left, right, up, down, move, kill and pan. Twenty experimental adult subjects uttered each word 50 times, which led to a database of 20 50 7 7000× × = words.
First, we present a brief overview of human auditory and speech production systems is presented, and discuss the main differences observed between the speech data collected within the ear canal and the data collected in front of the mouth.
Fundamentally, the simplest form of communication occurs when a speaker releases an acoustic sound pressure wave in the air by using speech articulators such as vocal folds, palate, teeth, tongue, etc. For example, a single-frequency sound wave traveling through air from a speaker’s mouth to a listener’s ears excites a sinusoidal pressure variation in the direction of propagation.
Speech processing is a multi-disciplinary field as hearing is an integral part of the speech chain, and a broad review of sound-wave propagation and hearing mechanism can
be found in the white paper, [Sibbald, 2001]. Due to the close connection between the unique method of speech-collection and the human hearing process, it is first necessary to highlight some basic related dynamics of the human auditory system before proceeding to an engineering view of speech production. The frequency response of a healthy human ear is between approximately 20 Hz to 20 kHz, with the high frequency capability diminishing with age. Consequently, the standard CD audio sampling frequency was chosen to be 44.1 kHz, which allows for frequencies up to the usual highest frequency perceivable by the human ear since the sampling frequency should be at least double the highest frequency component available. However, the human ear is most sensitive to a frequency spectrum ranging from 500 Hz to 4000 Hz, which roughly corresponds to the speech bandwidth carried along analog telephone lines [Marsh, 1999]. In addition to this inherent sensitivity, the human ear is capable of a wide dynamic range of hearing intensity, which is practically measured at approximately 130 dB from the threshold of hearing to the threshold of pain. It should be noted that for the purposes of this study, the structures of the outer and middle ear can be considered to be both a pre-amplifier and a limiter that contribute to this remarkable sensitivity and the dynamic range [Sibbald, 2001].
Although the details of the human hearing mechanism is beyond the scope of this thesis, it is important to note that the auditory canal can resonate and amplify sounds within a frequency range of approximately 2000 Hz to 5500 Hz by up to a factor of 10 [Marsh, 1999]. Besides, further amplification – up to 20 times at some resonance frequencies – takes place in the oval window of the cochlea. This knowledge provides a clue why minute pressure variations of external noise are amplified inside the ear. Hence, it was necessary to isolate the in-ear microphone from environmental noise sources by placing it inside a foam case during the data collection process.
The major components of the human speech production system are the lungs, trachea, larynx (organ of voice production), throat, oral cavity and nasal cavity; the last three together being referred to as the vocal tract in technical discussions. Finer acoustic organs critical to speech production include vocal cords (or vocal folds), tongue, lips, teeth, velum and jaw, which are called articulators by speech scientists. Speech is characterized as a discrete sequence of sound segments called phones, each
corresponding to certain positions of articulators during their production despite the fact that the analog speech signal is naturally continuous and dynamic in time and magnitude. Phones are acoustic manifestations of phonemes, which are considered to be linguistic codes that comprise a language. An interested reader can refer to [Deller, 2000] for a list of approximately 42 phonemes that constitute the language of American English.
From a simple engineering point of view, speech production can be considered an acoustic filtering process in which a speech sound source excites the vocal tract filter [Deng, 2003]. More technically, the larynx provides a periodic vibration to the vocal cords, causing quasi-periodic voiced speech. Voiced sounds consist of a fundamental frequency and its harmonics produced by vocal cords. Likewise, the fundamental period, or pitch period (or only pitch), of voiced speech corresponds to the successive vocal cord closure rate [Owens, 1993]. According to Deller, an alternative definition of the term pitch refers to the perceived fundamental frequency of a sound, whether or not that sound is actually present in the waveform. Although every speaker has a habitual pitch level, pitch generally shifts up and down during speaking in response to various factors including stress, intonation or emotion. The vocal tract changes the periodic vibration causing formant (or resonances) and sometimes anti-formant (or anti-resonances) frequencies, owing to the poles and the zeros in the vocal tract transfer function, respectively [Witten, 1982]. Further, the vocal tract length significantly affects all vowel formants frequency locations. Formant locations and pitch period are commonly used characteristics of phonemes to extract information from the speech signal for further analysis.
Unvoiced sounds are generated by forcing air flow through a vocal tract constriction between the glottis and mouth. Unlike voiced speech, there is no fundamental frequency in an excitation signal with unvoiced sounds, resulting in a noise-like and aperiodic signal. Note that unvoiced consonants (such as the weak fricative /f/ and stop sound /t/ as in the word “Left” or the weak plosive burst /p/ as in the word “Pan”) have considerably less energy and are usually focused on higher frequencies, whereas the voiced vowels (such as /u/ as in the word “Up” or /o/ as in the word “Move”) have most of the energy located in the lower portion of the spectrum as a main difference
[Fargues, 2005]. Table 2.1 summarizes the phonemes and the corresponding characteristics of the words used in this study.
Word Phoneme Manner of articulation Voiced? Example word
l liquid yes love
є (eh) vowel yes bet
f fricative no fluff
Left
t stop no tot
r liquid yes roar
αι (ay) diphthong yes bite
Right
t stop no tot
Λ (ah) vowel yes mud
Up
p stop no pop
d stop yes did
αu (aw) diphthong yes bout
w glide yes wow
Down
n nasal yes none
m nasal yes maim
u (uw) vowel yes boot
Move
v fricative yes valve
p stop no pop
æ (ae) vowel yes bat
Pan
n nasal yes none
k stop no kick
i (iy) vowel yes beat
Kill
l liquid yes love
Having given a brief discussion of human auditory system, speech production and the general characteristics of speech signal, it is now possible to focus on the unique properties of the speech data collected via the in-ear microphone. Previous discussions will demonstrate the differences between typical speech signals recorded by conventional directional microphones and those obtained from the in-ear microphone.
Although most of the acoustic sound energy originates from the mouth, some sound waves are emitted from the nostrils, throat and cheeks as well [Deller, 2000]. All these pressure variations in the air constitute the analog speech waveform. This speech waveform is first recorded by the in-ear microphone placed inside the external ear canal and then converted to a digital format by an analog-to-digital converter for further processing. According to Deng, typical human communication spans from below 100 Hz up to 7 kHz due to the limitations of speech production organs [Deng, 2003].
In an effort to compare the two different data-collection methods, Figure 2.1 shows time plots and spectrograms obtained for the word “right” collected with the in-ear microphone placed within the ear canal (top plots) and in front of the mouth (bottom plots). Both the time plot and spectrogram illustrate a portion of 2,000 samples in the signals. Note that both signals sounded very similar except for a small difference in the signal loudness (or amplitude). Figure 2.1 shows that signal collected from the mouth has higher frequency components than that collected within the ear canal. The signal collected from the mouth (the lower waveform) has a comparatively higher frequency content up to 3000 Hz, while the signal collected from the ear has most of its energy located in the spectrum up to 1000 Hz. Similar behavior regarding the frequency ranges was also observed for the other words of interest in the vocabulary. Figure 2.1 also shows the presence of a low frequency distortion resulting from the collection equipment.
It was observed that signals obtained from within the ear canal had low amplitudes and the A/D converter gain control was adjusted accordingly before recording to ensure that speech signals levels were high enough for recording purposes.
Time Time 0.0625 0.125 0.1875 0.25 0.0625 0.125 0.1875 0.25 Time Time 0.0625 0.125 0.1875 0.25 0.0625 0.125 0.1875 0.25 (sec) (sec) (sec) (sec) (Hz) (H z) Time Time 0.0625 0.125 0.1875 0.25 0.0625 0.125 0.1875 0.25 Time Time 0.0625 0.125 0.1875 0.25 0.0625 0.125 0.1875 0.25 (sec) (sec) (sec) (sec) (Hz) (H z)
Figure 2.1. The Word “Right” Recorded via Ear-Microphone.
Next, speech pre-processing issues are discussed. Spectral analysis, filtering, framing and windowing for short-term analysis are covered in detail.
B. SPEECH PRE-PROCESSING
1. Spectral Analysis
Spectral analysis basically involves digital filtering techniques to remove the noise and emphasize important frequency components of interest. Considering that the foam-encase of the ear-microphone decreases the amount of external noise in the ear canal during recording, the need for filtering mostly stems from the existence of bodily-created noises such as gulps, tongue clicks, lip smacks or coughs in the signal or due to the collection equipment. In addition, the microphone and the A/D converter used also introduce undesirable side effects, such as a typically 50-60 Hz humming noise, a fluctuating dc bias in the microphone and some other non-linear distortions due to the converter [Picone, 1993].
Before extracting speech feature information from the in-ear microphone data, it is first necessary to deal with the distortions in the signal to eliminate any subsequent problems with the parametric spectral analysis.
a. Spectrogram Analysis
First, the speech signal spectrograms were analyzed to identify the frequency bands most affected by unwanted distortions. Figure 2.3 illustrates the spectrograms obtained for one trial of each word contained in the vocabulary spoken by the same adult male subject.
Time (sec) Time (sec) Time (sec) Time (sec) Time (sec) Time (sec) Time (sec) (H z) (Hz) (Hz) (H z) (Hz) (Hz) (H z) Time (sec) Time (sec) Time (sec) Time (sec) Time (sec) Time (sec) Time (sec) Time (sec) Time (sec) Time (sec) Time (sec) Time (sec) Time (sec) Time (sec) (H z) (Hz) (Hz) (H z) (Hz) (Hz) (H z)
Figure 2.3. Spectrograms for the Utterances of Each Word in the Vocabulary. Figure 2.3 shows that recordings contain non-speech components in the frequency band between 50 to 100 Hz. It also shows that most of the speech signal energy for all words considered is roughly contained in the frequency band ranging from 100 Hz up to 2000-2500 Hz.
b. Mean Correction
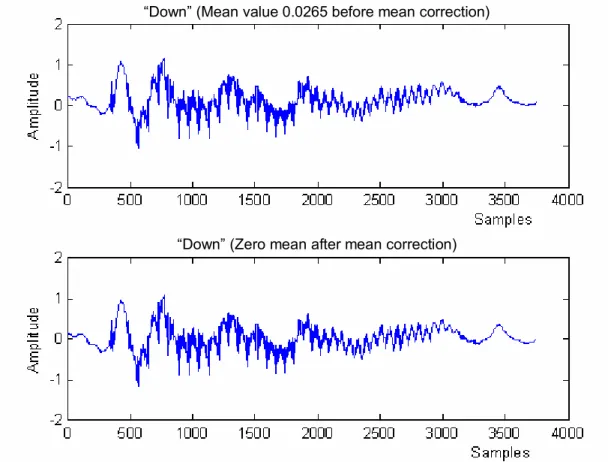
The purpose of mean correction is to remove any dc off-set that may be introduced by the microphone or the converter if any. Figure 2.4 shows the time-domain plot of the word, “down” with a mean value of 0.0265. Although the offset in the signal before mean correction is small, the effect of mean-subtraction can be seen as a shift in abscissa (amplitude) by close investigation.
“Down” (Zero mean after mean correction) “Down” (Mean value 0.0265 before mean correction)
“Down” (Zero mean after mean correction) “Down” (Mean value 0.0265 before mean correction)
Figure 2.4. Mean Correction on One Trial of the Word “Down;” Top Plot: before Correction, Bottom Plot: after Correction.
c. High-Pass Filtering vs. Pre-Emphasis Filtering and Band-Pass Filtering
Today’s speech recognition applications require relatively high signal-to-noise ratio (SNR) levels (usually above 30 dB) to insure high recognition performances [Picone, 1993]. Non-linear distortions due to recording devices, A/D conversion and background noise degrade recognition performances. Such adverse effects can be partly removed or decreased by applying a finite impulse response (FIR) high-pass filter.
Usually, a one-coefficient simple digital filter, known as a pre-emphasis filter, is used. There are two common reasons for using this filter. First, voiced portions have a typical attenuation of about -12 dB per octave1 with increasing frequency. Thus,
the pre-emphasis filter serves to compensate such high frequency attenuation and improves the spectral feature extraction [Deng, 2003]. Second, human hearing is more sensitive in the frequency band above 1 kHz. The pre-emphasis filter amplifies this region of the spectrum and contributes in modeling the most perceptually significant portion of the spectrum [Picone, 1993]. A common form of the pre-emphasis filter is given in [Deng, 2003] as follows:
( ) ( ) ( 1),
y n =s n −As n− (2.1)
where s(n) is the speech signal and A is typically chosen between 0.9 and 1.0, reflecting the degree of pre-emphasis.
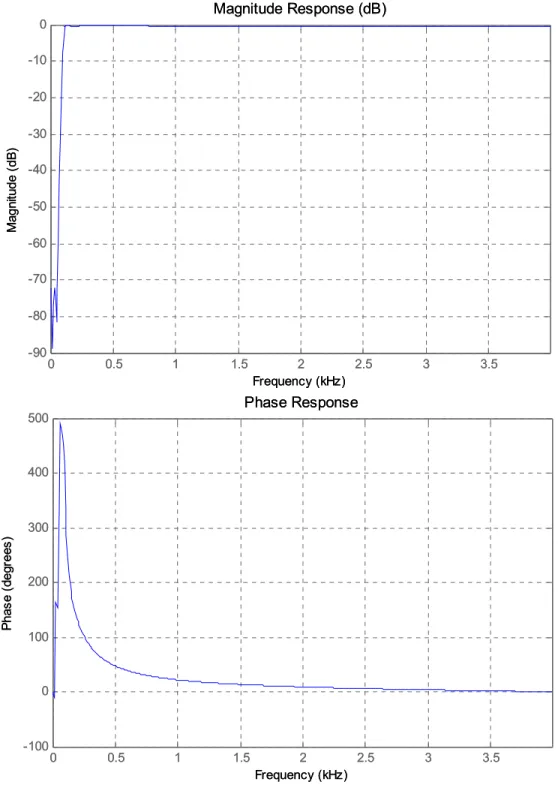
However, recall that Figure 2.3 showed that the ear canal dampened high frequency components as most of the words energy content was contained in the frequency range between 100 Hz to 2500 Hz, which is lower than that observed with the speech collected outside the mouth with the same microphone. Consequently, the pre-emphasis filtering did not contribute to the efficiency of the spectral feature analysis in the experimental results with the MATLAB simulations. Thus, an alternative filtering technique, high-pass filtering, was preferred to mask the low frequency ambient noise. A 6th order infinite impulse response (IIR) elliptic high-pass filter was applied. The filter specifications were as follows:
• The stopband: 0 - 60 Hz.
• The passband: 100 – 4000 Hz (half of the sampling frequency).
• The passband ripple: 0.5 dB.
Figure 2.5 represents the frequency response of the high-pass filter used.
0 0.5 1 1.5 2 2.5 3 3.5 -90 -80 -70 -60 -50 -40 -30 -20 -10 0 Frequency (kHz) M ag ni tud e ( dB ) Magnitude Response (dB) 0 0.5 1 1.5 2 2.5 3 3.5 -100 0 100 200 300 400 500 Frequency (kHz) P ha se ( deg re es ) Phase Response 0 0.5 1 1.5 2 2.5 3 3.5 -90 -80 -70 -60 -50 -40 -30 -20 -10 0 Frequency (kHz) M ag ni tud e ( dB ) Magnitude Response (dB) 0 0.5 1 1.5 2 2.5 3 3.5 -100 0 100 200 300 400 500 Frequency (kHz) P ha se ( deg re es ) Phase Response
Figure 2.5. Frequency Response of the IIR Elliptic HPF.
Note that the nonlinear phase response may introduce some phase distortion in the filtered speech signal. However, verification was completed by listening to ensure that the filtered signal was still perfectly understandable to the human ear.
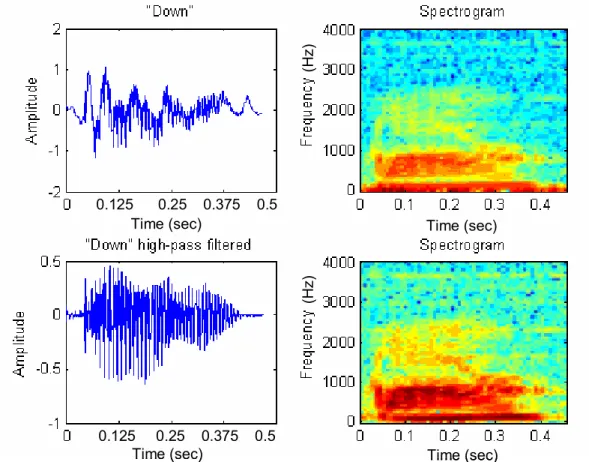
Figure 2.5 illustrates the high-pass filter effects on one trial of the word “Down.” Upper and lower plots present time and spectrogram traces before and after filtering, respectively. Results show that the filter has removed the low frequency trends observed in the original which elicit the higher frequency components more clearly in the spectrogram plot of the filtered signal.
Time (sec) Time (sec) Time (sec) Time (sec) 0.125 0.25 0.375 0.5 0.125 0.25 0.375 0.5 (Hz) (H z) Time (sec) Time (sec) Time (sec) Time (sec) 0.125 0.25 0.375 0.5 0.125 0.25 0.375 0.5 (Hz) (H z)
Figure 2.5. High-Pass Filtering Effect on One Trial of the Word “Down.” Experiments were also conducted with a 6th order IIR elliptic band-pass filter for performance comparison with the high-pass filter. This band-pass filter had the following specifications:
• The first stopband: 0 – 60 Hz.
• The passband: 100 – 2000 Hz.
• The second stopband: 2400 – 4000 Hz.
• The stopband attenuation: 60 dB.
The high-pass filtered data resulted in, on average, 4% better recognition rates than the recognition rates obtained from the band-pass filtered data.
d. Framing and Windowing for Short-term Analysis
Speech is a dynamic and non-stationary process, as the amplitude of the speech waveform varies with time due to variations in the vocal tract and articulators [Deng, 2003]. However, speech analysis usually presumes that the statistical properties of the non-stationary speech process change relatively slowly over time. Although this assumption is not strictly valid, it makes it possible to process short-time speech frames, ranging typically from 10 ms to 40 ms, as a stationary process. Generally speaking, the use of short frame duration and overlapping frames is chosen to capture the rapid dynamics of the spectrum. Speech parameters are extracted on a frame-by-frame basis and the amount of overlap determines how quickly parameters can change from frame to frame [Picone, 1993].
Windowing means multiplication of a speech signal ( )s n by a window ( )
w n to weight or favor samples by the shape and duration of the window. Coupled with overlapping short-term frames, successive windowing is equal to applying a sliding window to the long-term speech signal. The simplest window has a rectangular shape, weighting all samples of speech signal equally. In fact, not windowing segmented short-duration frames at all is equivalent to applying a rectangular window.
Window duration determines the amount of averaging used in power or energy calculation. Window duration and frame duration can be adjusted as a pair. For instance, a frame duration of 20 ms can be coupled with a window duration of 30 ms [Picone, 1993]. An alternative is to choose the window duration equal to the frame duration for simplicity.
As a matter of fact, the selection of proper frame duration (and indirectly the window duration) is eventually dependent on the change of rate of the vocal tract shape. Frames of 10 ms with 50% overlap are chosen and a rectangular window applied to each frame before calculating short-term parameters such as zero-crossing rate and short-term energy. Note that selecting too small a frame duration or equivalently increasing the frame rate would result in increased complexity and memory requirements.
2. Speech Boundary Detection
Determining the beginning and the termination of speech in the presence of background noise is a complicated problem [Rabiner, 1975].
The problem of separating speech from background silence and noise does not constitute a minor task, except in cases of very high signal-to-noise ratios (on the order of 30 dB or better). Environments with high SNR are rarely seen in real-world applications of speech recognition systems [Rabiner, 1975; Deller, 2000]. Further, a noise-robust endpoint detection algorithm must also be capable of dealing with speaker-dependent disturbances like coughs, gulps, tongue clicks, lip-smacks, etc. [Srydal, 1995].
Also note that the efficiency of accurate endpoint detection has a significant and direct effect on the performance of the entire recognition system. In practice, the process of accurate endpoint detection is not stable and many recognition faults (or misclassifications) can be traced back to poor endpoint detection [Qiang, 1998].
Rabiner and Deller et al. reported the broad categories of low energy phonemes, which usually cause endpoint detection failures [Rabiner, 1975; Deller, 2000]:
• Weak fricatives ({f, th, h}, such as /f/ located in the word, “half”).
• Weak plosive bursts ({p, t, k}, such as /p/, /t/ and /k/ present in the words, “pan”, “left” and “kill” respectively).
• Final nasals ({m, n, ng}, such as /n/ present in the words, “pan” and
“down”), and
• Trailing vowels at the end (such as /u/ in “zoo”).
Ordinarily, zero-crossing rate and short-term energy can be combined to form appropriate spatial or temporal features for determining the onset and termination of speech boundaries [Qiang, 1998]. Note that these temporal features can be extracted simply from the sample values of speech signal without transforming the signal into the frequency domain.
Rabiner et al. proposed a fairly simple and reliable algorithm for detecting the beginning and the termination of speech utterances in low noise environments (i.e., in a SNR level of at least 30 dB), based on short-time energy and a zero-crossing rate of speech [Rabiner, 1975]. This work mainly focused on the implementation of said algorithm in MATLAB.