THESIS FOR THE DEGREE OFDOCTOR OFPHILOSOPHY
Driver interaction with vulnerable road users
Modelling driver behaviour in crossing scenarios
Christian-Nils Boda
Department of Mechanics and Maritime Sciences CHALMERS UNIVERSITY OF TECHNOLOGY
Driver interaction with vulnerable road users Modelling driver behaviour in crossing scenarios CHRISTIAN-NILS BODA
ISBN 978-91-7905-189-1 c
CHRISTIAN-NILS BODA, 2019.
Doktorsavhandlingar vid Chalmers tekniska högskola Ny serie nr 4656
ISSN 0346-718X
Department of Mechanics and Maritime Sciences Chalmers University of Technology
SE–412 96 Göteborg, Sweden Telephone + 46 (0) 31 – 772 1000
Cover image: Ph.D. work organization
Typeset by the author using LATEX.
Printed by Chalmers Reproservice Göteborg, Sweden 2019
till Vilfred, Teodor, och Maria à Rosalie, Joëlle, et Christian
Abstract
Every year, more than 5000 pedestrians and 2000 cyclists die on European roads. These vulnerable road users (VRUs) are especially at risk when interacting with cars. Intelligent safety systems (ISSs), designed to mitigate or avoid crashes between cars and VRUs, first entered the market a few years ago, and still need to be improved to be effective. Understanding how drivers interact with VRUs is crucial to improving the development and the evaluation of ISSs. Today, however, there is a lack of knowledge about driver behaviour in interactions with VRUs. To address this deficiency and contribute to realising the full potential of ISSs, this thesis has multiple objectives: 1) to investigate and describe the driver response process when a VRU crosses the driver path, 2) to devise models that can predict the driver response process, 3) to inform Euro NCAP with new knowledge about driver interactions with crossing VRUs that may guide the development of their test scenarios, and 4) to develop a framework for ISS evaluation through counterfactual simulation and analyse the impact of the chosen driver model on the simulation outcome. The thesis results show that the moment when a VRU becomes visible to the driver has the largest influence on the driver’s braking response process in driver-VRU interactions. Data gathered in driving simulators and on a test track were used to devise different predictive models: one model for the pedestrian crossing scenario, and three for the cyclist crossing scenario. The model for the pedestrian crossing scenario can estimate the moments at which key components of the driver response process (e.g. gas pedal fully released and brake onset) happen. For the cyclist crossing scenario, the first model predicts the brake onset time and the second predicts the experienced discomfort score given the cyclist appearance time. The third predicts the continuous deflection signal of the brake pedal based on the interaction of two visually-derived cues (looming and projected post-encroachment time). These models could be used to improve the design and evaluation of ISSs. From the models, appropriate warning or intervention times that are not a nuisance to the drivers could be adopted by the ISSs, therefore maximizing driver acceptance. Additionally, the models could be used in counterfactual simulations to evaluate ISS safety benefits. In fact, it was shown that driver models are a critical part of these simulations, further demonstrating the need for the development of more realistic driver models. The knowledge provided by this thesis may also guide Euro NCAP towards an improved ISS test protocol by providing information about scenarios that have not yet been evaluated.
Keywords: Active safety, counterfactual analysis, pedestrian, bicyclist, driver be-haviour, driver model, Euro NCAP.
Funding acknowledgments
This work was conducted at SAFER and Chalmers University of Technology within the ‘Drivers in Interaction with Vulnerable road users’ project (www.divproject.eu), sponsored by Toyota Motor Europe and Veoneer AB (formerly known as Autoliv Research). The earlier stage of this work was funded by Vinnova (EFrame project) and the National Academy of Sciences (S08 — S2-S08A-RW-1).
Acknowledgments
I would like to thank all my colleagues in the Vehicle Safety division for the fruitful discussions since I started to work at Chalmers. Marco, thank you for your patience and for making my life as a Ph.D. candidate as smooth and entertaining as possible. Thank you, Jonas, for having offered me the opportunity to join the research group back in 2013 and for having motivated me to stay. Special thanks go to my examiner, Robert Thomson, for his helpful and constructive feedback.
I also acknowledge the great cooperation with all the partners of the DIV project: Toyota Motor Europe, Autoliv, and Veoneer.
Finally, I would like to thank my family that has followed me on this long and chal-lenging journey.
Christian-Nils Boda Göteborg, November 2019
List of Publications
Paper I - Marco Dozza, Christian-Nils Boda, Leila Jaber, Prateek Thalya, and Nils Lubbe (2019). “How do drivers negotiate intersections with pedestrians? Fractional factorial design in an open-source driving simulator”. Journal article. An earlier version of this paper was presented at the RSS2017 Road Safety & Simulation International Conference. After major revisions, a new version of the paper was submitted to Accident Analysis & Prevention
Paper II - Christian-Nils Boda, Marco Dozza, Katarina Bohman, Prateek Thalya, Annika Larsson, and Nils Lubbe (2018). “Modelling how drivers respond to a bicyclist crossing their path at an intersection: How do test track and driving simulator compare?” In:Accident Analysis & Prevention111, pp. 238–250. ISSN: 0001-4575.
DOI:https://doi.org/10.1016/j.aap.2017.11.032
Paper III - Christian-Nils Boda, Marco Dozza, Pablo Puente Guillen, Prateek Thalya, Leila Jaber, and Nils Lubbe (2019). “Modelling discomfort: How do drivers feel when cyclists cross their path?” Submitted to Accident Analysis & Prevention
Paper IV - Christian-Nils Boda, Esko Lehtonen, and Marco Dozza (2019). “A computa-tional driver model to predict driver control at unsignalised intersections.” Submitted to IEEE Transactions on Intelligent Transportation Systems
Paper V - Jonas Bärgman, Christian-Nils Boda, and Marco Dozza (2017). “Counterfac-tual simulations applied to SHRP2 crashes: The effect of driver behavior models on safety benefit estimations of intelligent safety systems”. In: Accident Analysis & Prevention102, pp. 165–180. ISSN: 0001-4575.DOI:https://doi.org/10. 1016/j.aap.2017.03.003
List of Acronyms
ACAT – Advanced Crash Avoidance Technologies AD – Automated Driving
AEB – Autonomous Emergency Braking ATD – Arrival Time Difference
CLMM – Cumulative Link Mixed Model
DGPS – Differential Global Positioning System FCW – Forward Collision Warning
FOT – Field Operational Test
IIHS – Insurance Institute for Highway Safety ISS – Intelligent Safety System
NCAP – New Car Assessment Programme NDD – Naturalistic Driving Data
NDS – Naturalistic Driving Study
NHTSA – National Highway Traffic Safety Administration PET – Post-Encroachment Time
RTK – Real-Time Kinematic TTA – Time-To-Arrival TTC – Time-To-Collision VRU – Vulnerable Road User
Contents
Abstract v
Funding acknowledgments vii
Acknowledgments ix
List of Publications xi
List of Acronyms xiii
1 Introduction 1
1.1 Background . . . 1
1.2 Objectives . . . 3
1.3 Scope of the thesis . . . 3
2 Driver behaviour in pedestrian and cyclist crossing scenarios 5 2.1 Factors influencing driver behaviour at crossings . . . 5
2.2 Driver behaviour models in crossing scenarios . . . 8
3 Test environments for investigating driver behaviour 9 3.1 Driving simulators . . . 9
3.2 Test tracks . . . 10
3.3 Comparing driving simulators and test tracks . . . 10
4 Modelling driver behaviour 13 4.1 Model definition . . . 13
4.2 Modelling framework . . . 13
5 Evaluating intelligent safety systems 17 6 Methods 19 6.1 Overview of the research methodology . . . 19
6.2 Data collection . . . 20
6.2.1 Participants . . . 20
6.2.2 Experimental protocols . . . 21
6.2.3 Test environment setups . . . 22
6.2.4 Naturalistic driving data . . . 23
CONTENTS CONTENTS
6.3 Driver behaviour modelling . . . 24
7 Summary of papers 27 8 Discussion 39 8.1 Studying the driver response process . . . 39
8.2 Modelling driver behaviour . . . 40
8.3 Test environments . . . 41
8.4 Design of intelligent safety systems . . . 43
8.5 Evaluation of intelligent safety systems . . . 43
9 Conclusion and future work 45 9.1 Conclusion . . . 45
9.2 Future work . . . 46
Bibliography 49
Chapter 1
Introduction
1.1
Background
Pedestrians and cyclists account for a large number of fatalities on the world’s roads. In the European Union, at least 5000 pedestrians and 2000 cyclists die every year (Strandroth et al. 2014) in road crashes, accounting for 27% of all road fatalities. In the USA, pedestrians killed by motor vehicles represent the third-highest number of deaths on the road. In 2015, pedestrians accounted for 14.5% of road fatalities and cyclists accounted for 2.2% (Washington DC 2016). In China, traditional and electric-powered bicycles accounted for 35% of road fatalities in 2013 (Sui et al. 2019), and pedestrians accounted for 25% (Chen et al. 2014). In the China in-depth accident study (CIDAS), cyclist crossing scenarios were shown to be the most frequent type of cyclist-car crash (Sui et al. 2019). Similarly, pedestrian crossing scenarios accounted for 79% of the pedestrian fatalities on the road, according to the data provided by CIDAS (Chen et al. 2014). In Europe, crash statistics from the German in-depth accident study show that around 75% of the pedestrian crashes between 1999 and 2008 were crossing scenarios (Ebner et al. 2011). The Swedish Volvo Cars cyclist accident database showed that the most frequent type of cyclist crashes on Swedish road was crossing scenarios (39% of all cyclist crashes) (Lindman, Jonsson, et al. 2015). These crash statistics show the preponderance of crossing crashes for pedestrians and cyclists regardless of the geographic region and motivate the development of safety countermeasures to reduce the number of these crashes.
Pedestrians and cyclists are categorized as vulnerable road users (VRUs), defined in an European directive as “non-motorised road users, such as pedestrians and cyclists as well as motorcyclists and persons with disabilities or reduced mobility and orientation” (European Parliament 2010). Although the general trend in Europe is towards a decrease in road fatalities, VRU casualties are not decreasing (European Commission 2016). Safety systems that are already on the market attempt to address this problem. Passive safety systems, such as soft car parts (bumper, hood, etc.) or, more recently, pedestrian airbag systems, are effective at reducing the number of fatalities or injuries when a crash is unavoidable (Jakobsson et al. 2013). Intelligent safety systems (ISSs), which include advanced driver-assistance systems and different forms of automated driving systems, strive to avoid crashes by warning drivers or taking control of the car (e.g., Toyota’s Pre-Collision System with Pedestrian Detection function (Hayashi et al. 2013; Tsuchida et al.
2 1.1. Background
2007), Volvo’s Pedestrian and Cyclist Detection with Full Auto Brake system (Lindman, Ödblom, et al. 2010)). Although the traffic scenarios in which VRUs cross the drivers’ travel path have been identified as the most critical for VRUs (Gohl et al. 2016), today’s ISSs address the crossing scenarios only within a restricted operational design domain (Hayashi et al. 2013; Lindman, Ödblom, et al. 2010; Tsuchida et al. 2007)—probably because crossing scenarios are particularly challenging. Thus the present thesis focuses on crossing scenarios to support the development of appropriate ISSs.
The evaluation of ISS performance, essential for systems development, aims to deter-mine how efficient the systems are and in which conditions they may perform suboptimally (Euro NCAP 2015; Euro NCAP 2017; Fildes et al. 2015; Hulshof et al. 2013). Several methodologies evaluating ISS performances exist. They may differ by the product’s life status (in-development, after-market, etc.), the test environment (simulation, test track, field-operational test, etc.), or by the test party (suppliers, car manufacturers, third-party programmes, etc.). For instance, a well-known safety performance evaluation programme in the European Union is the European New Car Assessment Programme (Euro NCAP), which evaluates ISS using publicly available test protocols and issues a safety score for each of the tested cars. This type of programme exists in other parts of world as well (e.g., JNCAP for Japan, IIHS’s NCAP in the USA, etc.1).
While NCAPs remain a great tool for evaluating ISSs’ safety performances and raising public awareness of car safety while being a great advocate for the introduction of new ISSs in cars, NCAPs are only evaluating ISSs that are already on the market. Moreover, while ISSs may be performant in specific use cases, they might not be performant at reducing the number of crashes and fatalities, or the severity of injuries globally. This is the reason why it is important to evaluate how much impact the ISS would have when introduced onto the market. Safety benefits (e.g., the annual reduction in the number of crashes or injuries (Funke et al. 2011)) of an ISS represent a set of numerical indicators that describe how an ISS impacts the current crash statistics. For ISS designers, being able to estimate safety benefits prospectively helps them determine how much impact their system would have, even before its introduction onto the market. Safety benefit evaluation methodologies using counterfactual simulations were developed to serve this purpose. Multiple examples can be found in the literature (Lindman, Ödblom, et al. 2010; McLaughlin, Hankey, and Dingus 2008; Kusano and Gabler 2012; Kusano, Gabler, and Gorman 2014; Sander and Lubbe 2016; Sander 2018; Zhao et al. 2019). Although counterfactual simulation results depend on the chosen driver model (Lundgren and Tapani 2006), driver behaviour models implemented in the examples found in the literature are usually as simple as one single fixed reaction time to a warning and may not be describing a realistic behaviour given the driving scenario. Unfortunately, realistic driver models are quite sparse in the literature, especially those that focus on a specific driving interaction such as intersection encounters. Not only is developing a detailed and realistic driver model for this specific driving interaction critical from the point of view of counterfactual simulations (Lundgren and Tapani 2006), but such a model could also be useful for ISS designers. Historically, drivers have been the ones controlling their cars, but with the introduction of ISSs the controls may be shared between drivers and ISSs. The interaction between drivers and ISSs is thus crucial; each ISS must take the driver’s intent into consideration to maximize its safety
1see
Chapter 1. Introduction 3
performance (Rodrigues de Campos et al. 2017) without annoying drivers (Lubbe and Davidsson 2015). The need for models that can predict driver intent (or behaviour) for ISS threat-assessment algorithms is therefore obvious. This need and the lack of driver models for VRU crossing scenarios support one of the objectives of this thesis: to develop a more comprehensive and situation-dependent (e.g., in terms of kinematics, environment, etc.) computational driver model.
The present thesis focuses on these issues by investigating driver behaviour in VRU crossing scenarios and by devising driver behaviour models as well as an ISS safety benefit evaluation framework.
1.2
Objectives
The overall aim of this thesis work is to inform the development and evaluation of ISS by modelling how drivers interact with pedestrians and cyclists at intersections. Several objectives have been set:
1. Investigate and describe the driver response process when a pedestrian or a cyclist crosses the driver’s path.
2. Devise models that can predict the driver response process.
3. Provide new knowledge about driver interactions with a crossing pedestrian or cyclist that could be used by Euro NCAP to guide the development of their tests.
4. Develop a framework for ISS evaluation through counterfactual simulation and analyse the impact of the chosen driver model on the simulation outcome.
The thesis is organized as follows. First, Chapters 2-5introduce the literature on driver behaviour in driver-VRU interactions, the test environments for data collection, the field of driver behaviour modelling, and ISS evaluation. Second,Chapter 6presents the overall research approach followed during the Ph.D. project. Third,Chapter 7presents the five papers produced during the thesis work. Fourth,Chapters 8-9present the discussion and conclusions about the outcome of the research performed during this Ph.D. project with respect to the above-mentioned objectives and how future research could address the remaining research gaps.
1.3
Scope of the thesis
The interaction between road users is complex as they communicate with, and react to, each other. In the ideal interaction, road users react to each other based on the outcome of their communication. Many studies have evaluated the extent to which non-verbal communication between road users can influence driver behaviour; for instance, it was shown that the appearance of a cyclist influences the driver’s overtaking behaviour (Walker 2007; Walker et al. 2014), and that driver behaviour is affected if the pedestrian stares or smiles at the driver (Guéguen, Meineri, et al. 2015; Guéguen, Eyssartier, et al. 2016).
4 1.3. Scope of the thesis
Non-verbal communication may be crucial to the whole interaction between a driver and a crossing pedestrian or cyclist. However, its study would require an extensive effort to include all road user’s perspectives, including their communication and their reactions. Before addressing the role of non-verbal communication, the response process as a reaction to basic external cues needs to be understood.
Finally, with the introduction of automated driving (AD) systems, the contemporary notion ofdriveris evolving to include AD systems that can control the car autonomously. In this thesis, the termdriverrefers to the human occupant controlling the car.
Chapter 2
Driver behaviour in pedestrian and
cyclist crossing scenarios
2.1
Factors influencing driver behaviour at crossings
Interest in the driver-VRU interaction is not new; in the mid-20th century, studies were already being undertaken in order to reduce pedestrian casualties on the road. For instance, in the pre-digital era, Barrett et al. (1968) demonstrated that automobile simulators could be useful for pedestrian-driver interaction studies. In a site-based observation study, Katz et al. (1975) examined which factors influence a driver’s decision to yield at pedestrian crossings. In the case of cyclist-driver interactions, Kroll and Ramey (1977) investigated the influence of bicycle lanes on driver behaviour when overtaking a cyclist, while McHenry and Wallace (1985) looked at the effect of curb lane width on the same interaction. Research into the safety aspects of driver-VRU interactions has continued since then to better understand the relevant driver behaviour, in particular by identifying the relevant factors and evaluating the driver’s role in making the driver-VRU interaction unsafe. A summary of these studies can be found in Tables 2.1 and 2.2. The investigated factors can be grouped into three types (Himanen and Kulmala 1988): 1) road user characteristics, 2) encounter configuration, and 3) physical environment. Note that only the studies which quantify the factors’ effect on driver behaviour are presented here. Table 2.1 lists the studies which investigated crossing interactions with pedestrians, and Table 2.2 lists those with cyclists.
The literature review reveals that more information (i.e., more studied factors) about driver-pedestrian interactions is available compared to driver-cyclist interactions. For instance, one interesting factor that was only analysed in pedestrian crossing scenarios is the moment at which the VRU appeared to the driver for the first time (orappearance time) (Iwaki et al. 2015). Other factors were also shown to have a significant effect on drivers’ response process: VRU conspicuity (Balk et al. 2008; Langham and Moberly 2003), car speed (Katz et al. 1975; Himanen and Kulmala 1988; Lubbe and Rosén 2014; Silvano et al. 2016), pedestrian speed (Lubbe and Davidsson 2015), pedestrian lateral position (Himanen and Kulmala 1988), cyclist speed (Petzoldt et al. 2015; Silvano et al. 2016), and crossing entry (Räsänen and Summala 2000)). Notably, the appearance time is a crucial point in the driving sequence that relates to all of those factors. Since only one study has quantified the effect of this factor on driver behaviour in pedestrian crossing scenarios, and none have
6 2.1. Factors influencing driver behaviour at crossings
done so in cyclist crossing scenarios, the current thesis further analysed this factor for both types of VRU.
Chapter 2. Driver behaviour in pedestrian and cyclist crossing scenarios 7
Table 2.1: List of factors investigated in driver-pedestrian crossing interactions by study
Type of factor Factor Reference
Road users’ characteristics
Driver age (Bromberg et al. 2012; Katz et al. 1975; Sun et al. 2002) Driver gender (Sun et al. 2002)
Vehicle type (Sun et al. 2002)
Headlamp type (Bullough and Skinner 2009)
Warning safety system (Lubbe 2017)
Pedestrian conspicuity (Balk et al. 2008; Langham and Moberly 2003)
Encounter configuration
Oncoming traffic (Sun et al. 2002)
Crossing angle (Iasmin et al. 2015)
Number of pedestrians (Katz et al. 1975; Himanen and Kulmala 1988; Sun et al. 2002)
Car speed (Katz et al. 1975; Himanen and Kulmala 1988; Lubbe and Rosén 2014)
Pedestrian speed (Lubbe and Davidsson 2015)
Gap timing (Várhelyi 1998)
Pedestrian lateral distance (Himanen and Kulmala 1988)
Appearance time of the pedestrian
(Iwaki et al. 2015)
Non-verbal communication (Guéguen, Meineri, et al. 2015; Guéguen, Eyssartier, et al. 2016; Katz et al. 1975)
Physical environment
Crossing marking presence (Katz et al. 1975)
Road width (Himanen and Kulmala 1988)
Safety structures (Himanen and Kulmala 1988; Bella and Silvestri 2015; Bella and Silvestri 2016)
8 2.2. Driver behaviour models in crossing scenarios
Table 2.2: List of factors investigated in driver-cyclist crossing interactions by study
Type of factor Factor Reference
Road users’ characteristics Driver expectancy (Phillips et al. 2011)
Encounter configuration
Crossing direction (near or far side)
(Räsänen and Summala 2000)
Car speed (Silvano et al. 2016)
Cyclist speed (Petzoldt et al. 2015; Sil-vano et al. 2016)
Arrival time difference (Silvano et al. 2016)
Physical environment
Cycle crossing location (Räsänen and Summala 2000)
Cycle lane width (Räsänen, Koivisto, et al. 1999)
Road traffic regulation (Räsänen, Koivisto, et al. 1999)
2.2
Driver behaviour models in crossing scenarios
Three models covering the pedestrian crossing scenario and one covering the cyclist crossing scenario were found in the literature. In the pedestrian crossing scenario, the three models were designed to predict different facets of the driver behaviour. The first model (Sun et al. 2002) is a computational model that evaluates the probability of a driver’s yielding. The second model (Bella and Silvestri 2016) is a braking-response model that predicts the deceleration-phase duration (from the initial speed to the minimum speed) given the type of safety treatment (infrastructure design), the car’s initial speed, longitudinal distance to the crossing, minimum speed reached, and average deceleration rate. It is interesting to note that the authors concluded by saying that drivers could approach the intersection more smoothly when infrastructure design provided better visibility (i.e., longer appearance time). Finally, the third model (Iwaki et al. 2015) is a more complete computational model. It predicts the start of gas pedal release and brake initiation as well as jerk and maximum deceleration, with appearance time as a main factor. As for the cyclist crossing scenario, the only model found in the literature attempts to evaluate the probabilities of getting into a conflict and of yielding (Silvano et al. 2016), as functions of the lateral distance of the bicycle, the car and bicycle speeds, and the car and bicycle time-to-collision. The model was not developed to predict any part of the driver response process (e.g., brake initiation, steering, or any other type of control) other than the yielding decision. Previous research has not been able to develop a driver behaviour model in either pedestrian or cyclist crossing scenarios that predicts and quantifies driver response processes.
Chapter 3
Test environments for investigating
driver behaviour
To support the development of ISSs, the analysis of driver behaviour is essential. Being able to predict driver intent helps the ISS intervene appropriately, in line with the driver’s expectations. In order to analyse and model driver behaviour, driving data are required. Driving data include information related to the driver (demographics, gaze location, and secondary task, etc.) and the driving environment (including other road users’ kinematics) as well as the driven car (pedals and steering wheel position, speed, and indicator light status, etc.). These data could be collected in one of the three test environments: 1) driving simulators, 2) test tracks, and 3) on-road studies.
3.1
Driving simulators
Driving simulators were already mentioned in the literature at the beginning of the 20th century; the work of De Silva (1936) was presented by Caird and Horrey (2011) as one of the first studies investigating driver behaviour in a simulator setup. In the 1960s, driving simulators were proposed for studying driver behaviour in interactions with VRUs (Barrett et al. 1968). Simulators provide a safe experimental environment as drivers drive a virtual car—an especially substantial safety advantage when studying specific medical conditions (e.g., post-stroke symptoms (Blane et al. 2018)). Fortunately, free, open-source driving simulators, such as OpenDS (Math et al. 2013), are now easily available.
The proliferation of simulators has resulted in a heterogeneous mix. For research purposes, a simulator can be classified as low or high fidelity, depending on how well it reproduces the real-world experience. Fidelity can be further defined in terms of three types of validity: ecological validity, the degree to which the test environment reflects the real-life on-road environment; behavioural validity, the extent to which a simulator elicits the same driving behaviour that occurs when driving on real roads; and physical validity, the extent to which the physical components of a simulated vehicle (i.e., layout, visual displays, and dynamic characteristics) correspond to real-world vehicles (definitions adapted from (Mullen et al. 2011)). Extensive research on simulator validity was conducted in 2011 (Mullen et al. 2011), containing most of the considerations that a researcher should keep in mind when using simulators. Ecological, behavioural, and physical validities in a simulator
10 3.2. Test tracks
setup define the extent to which the environment, driver, and vehicle, respectively, reflect reality. These validities are important when interpreting driver behaviour in a simulator and should be considered when generalising results to the real world.
3.2
Test tracks
In a test-track environment, participants drive a real car in a closed area. This method allows the researchers to control the scenarios under investigation in terms of other road users, traffic signals, etc. Test-track environments can be used for multiple purposes, including studying driver behaviour: for example, Kiefer et al. (1999) described evaluation procedures for ISS on a test track, and Najm and Smith (2004) presented a driver response model using data gathered on a test track.
A test-track setup may be a safer environment for the participants than on-road studies, as many unpredictable elements are eliminated. However, as a result, the ecological validity of the collected driving data may be questionable. This may influence the behavioural validity; drivers may not behave as they would on real roads.
3.3
Comparing driving simulators and test tracks
Driving simulators and test tracks are very similar: they both enable researchers to tightly control the participants’ environment. Both have the benefit of costing less than large-scale on-road studies such as field operational tests (FOTs) and naturalistic driving studies (NDSs). These studies assess ISS performance or analyse natural driving behaviour by having participants drive instrumented cars that unobtrusively record daily driving data (Carsten et al. 2013). FOTs and NDSs usually require significant human and financial resources, so driving simulators and test tracks may be better suited for testing a single, specific empirical hypothesis. However, the benefits of their low cost and tight control must be weighed against their reduced validity.
Driving simulator setups range from low-cost fixed-base simulators to highly expen-sive and complex moving-base simulators. By increasing the complexity of the setup, researchers hope to obtain higher physical, ecological, and behavioural validity. For driver behaviour researchers, the most important of these is behavioural validity. As long as the test environment elicits valid driver behaviour, it should be sufficient for researchers studying driver behaviour. Unfortunately, it is an arduous task to evaluate how valid driver behaviour is in a given test environment. A recently published systematic literature review, Wynne et al. (2019), assessed the results of studies that compared the validity of driving simulators and real-world experiments (including test tracks). The variability of the results was quite large and showed that the level of complexity in simulators does not necessarily correlate with the level of validity.
One important methodological issue is the difference between a fixed-base driving simulator and a test track. While neither of these environments consists of real roads with real traffic, a comparison of their results may indicate which parts of driver behaviour are affected by the degree of physical validity. For instance, would driver braking behaviour be similar in an environment that does not provide acceleration cues (a fixed-base simulator)
Chapter 3. Test environments for investigating driver behaviour 11
and one that does (a test track)? If the braking behaviours are different, would some parts of the braking response process be similar anyway—and if so, which ones? Addressing these questions would help researchers choose the most appropriate test environment for addressing their research objectives.
Chapter 4
Modelling driver behaviour
4.1
Model definition
Thoroughly modelling driver behaviour is, if not impossible (Michon 1985), certainly arduous (Cacciabue et al. 2010). Markkula (2015) divides driver models into three cat-egories: conceptual, statistical, and process. Conceptual models qualitatively describe how drivers interact with their vehicle and the environment (the models developed by Ljung Aust and Engström (2011) and Summala (1988) are this type). The other two model types quantitatively describe drivers’ behaviour. Statistical models describe some limited aspects of driver behaviour using probability distributions. They are open-loop models, meaning their output does not depend on previous output (orfeedback). This type of model was used by Kusano and Gabler (2012), for example. Process models (orcomputational
models), like statistical models, are mathematical, but their output depends on previous and current data. Examples of these closed-loop models can be found in Plöchl and Edelmann (2007) and Markkula (2014). It is noteworthy that statistical models can be components of process models (Markkula 2015; Bärgman et al. 2017).
4.2
Modelling framework
Several driver modelling frameworks are available in the literature and it is difficult to choose the most appropriate one for a given research aim. Each has its individual qualities: ACT-R (Anderson et al. 2004) provides a comprehensive architecture for modelling human behaviour (see (Salvucci 2006) for an application in a driving context), control theory (see (McRuer et al. 1977; Saleh et al. 2011)) can model dynamic systems (i.e., they can generate a continuous output depending on current and past data), and artificial neural networks (see (Lin et al. 2005)) can model complex non-linear systems (in this case, driver behaviour). All have a conceptual background and offer tools for modelling driver behaviour according to their specific paradigm, or cross-paradigm approach.
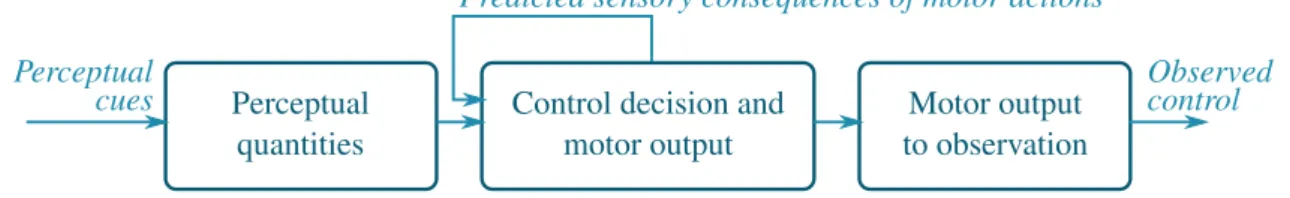
A recent human behaviour modelling framework, based on neuroscience, was proposed by Markkula, Boer, et al. (2018). It integrates three concepts from neuroscience: 1) motor primitives, 2) evidence accumulation, and 3) prediction of sensory consequences of motor actions (Markkula, Boer, et al. 2018). The mathematical implementation was derived from
14 4.2. Modelling framework
control theory. Overall, the framework offers the possibility of quickly devising a model with a human-like intermittent control output, regardless of the number of perceptual cues given. Note that the control is consideredhuman-likebecause it mimics the motions of the human body, in terms of the intermittency of the control adjustments and their form (the motor primitives) (Flash and Hochner 2005; Dégallier and Ijspeert 2010; Schaal et al. 2000).
Motor output to observation Control decision and
motor output Perceptual
quantities
Perceptual Observed
cues control
Predicted sensory consequences of motor actions
Figure 4.1: Main blocks forming the driver model adapted from the framework of Markkula, Boer, et al. (2018).
The overall structure of the framework is represented in Figure 4.1. The main part of the driver model is theControl decision and motor outputblock, in which the evidence is accumulated. Note that the way that neuronal evidence accumulation happens is still subject to debate in neuroscience: see, for example, the ramping (or diffusion-to-bound) accumulation model (Purcell et al. 2010; Schustek and Moreno-Bote 2014) versus the discrete stepping model (Latimer, Yates, et al. 2015; Latimer, Huk, et al. 2017). The ramping model was the first to be established, and the type of accumulation model might not significantly affect the results in predicting driver behaviour, so the evidence accumulation was modelled (as defined by (Purcell et al. 2010)) as a ramping process in the framework. One way to express the accumulation process mathematically is
dA(t)
dt =k×(t) +gate+µ(t), (4.1)
whereA is the activity of the accumulator, k a gain, the difference between the received and predicted perceptual quantities, gate a leakage term, andµ a noise term (formula adapted from (Markkula, Boer, et al. 2018)). The generated motor output is transposed to the observed control (e.g., from steering rate to steering position in the example from Markkula, Boer, et al. (2018)). Each time the activity of the accumulator reaches a specific threshold (i.e., when enough evidence has accumulated), a control adjustment is made. The model generates a continuous control signal that is a combination of motor-primitive adjustments, resulting in a human-like intermittent control (Flash and Hochner 2005; Dégallier and Ijspeert 2010; Schaal et al. 2000).
One of the advantages of the framework is that the structure can be expanded—it does not depend on a single accumulation process. Several accumulation processes may be hierarchically structured, to create a more comprehensive driver model. For instance, Markkula, Romano, et al. (2018) describe a pedestrian behaviour model that interconnects different evidence accumulation blocks, accounting for different perceptual quantities. The pedestrian’s decision is made based on the accumulated evidence, giving priority to one accumulation process (i.e., enough evidence that the driver saw the pedestrian has
Chapter 4. Modelling driver behaviour 15
accumulated) over the others (i.e., the driver has made the decision to slow down, and the pedestrian has enough evidence to decide it is safe to cross before the car passes).
Markkula, Romano, et al. (2018)’s framework has been used when modelling driver steering and braking control in different traffic scenarios: rear-end (Svärd et al. 2017), and path-following (Markkula, Boer, et al. 2018). However, the implementation of the framework in crossing scenarios was not done and further research is required to better understand how this can be done.
Chapter 5
Evaluating intelligent safety systems
Among many ISS evaluation methodologies, the NCAPs’ methodology and the safety benefit evaluation methodology with counterfactual simulations are particularly worth studying. Both methodologies are employed to evaluate ISSs, but they do not evaluate the same safety indicators so they are not in opposition and should be seen as complementary to each other. In fact, seeing the potential of prospective simulations, researchers have already suggested that Euro NCAP incorporate simulations into their assessment programme (Page et al. 2015). This addition seems to be under consideration by Euro NCAP, according to their roadmap towards 2025 (Euro NCAP 2018).
Several methodologies aim at evaluating ISS performance given a specific driving scenario. Performance is evaluated by comparing correct interventions or non-interventions against the unnecessary or missed interventions (Nilsson 2014). Several tools for the evaluation of ISS performances exist. Software or hardware in-the-loop (SIL or HIL) simulations (Zhou et al. 2016) or tests using driving simulators or test tracks could be used (e.g., NCAPs evaluate the ISS performances by means of test-track experiments). While the test environment may be different from one tool to another, it is not the only difference; the choice of tool mainly depends on the stage of the ISS’s product life cycle. The SIL simulations are used at an early stage, enabling designers to refine the ISS’s performance; at the other end of the product life cycle, NCAPs (such as Euro NCAP) evaluate ISSs that are already on the market. The test scenarios of NCAPs, including Euro NCAP, are often derived from crash statistics and attempt to provide the public with a car’s safety rating. However, the test scenarios may not do justice to some ISSs because they would expect a warning or intervention at a certain time. For instance, if a forward collision warning (FCW) system is designed to issue a warning later than the time-to-collision awarded for the highest safety score by Euro NCAP, the system may be underrated even though its intervention was legitimate, in the sense that it enables drivers to avoid a crash. It is, therefore, important to develop further knowledge of driver behaviour. Doing so can help improve NCAP’s test protocols by accounting for realistic behaviour and assessing the ISSs fairly.
While the performance evaluation addresses the operation of the ISS in specific driv-ing scenarios, the safety benefit evaluation deals with the number of crashes (and, by correlation, of injuries and casualties) that the ISS would reduce in the real world if the fleet of vehicles were equipped with this specific ISS. Multiple methodologies have been
18
developed and proposed in the literature to evaluate ISS safety benefits before the ISS is introduced in the market. They rely mainly on virtual models (e.g., environment, vehi-cles, and road users), and on crash kinematics (e.g., kinematics reconstruction from crash statistics or from naturalistic driving data (NDD) collected in on-road studies). One of the largest efforts to set up a methodology for the evaluation of ISS safety benefits was led by the National Highway Traffic Safety Administration (NHTSA). During the NHTSA’s advanced crash avoidance technologies (ACAT) programme, several methodologies using counterfactual simulations (Carter et al. 2009; Funke et al. 2011) were introduced and exemplified with different types of ISS (e.g., lane departure warning and backing-up crash countermeasure systems). While all the developed methodologies offer a solid platform for future ISS evaluations, many examples (Gordon et al. 2010; Van Auken et al. 2011; Perez et al. 2011) only include relatively naïve driver models.
Because they depend on the nature of the ISS to be evaluated, the evaluation methods found in the literature are all slightly different, but they all use simple driver models. However, accurate driver models are key for realistic simulations (Lundgren and Tapani 2006), in particular for the evaluation of ISSs that rely on driver reaction. In contrast, ISSs that do not expect driver control input, such as autonomous emergency braking (AEB) systems, may not require an evaluation method with a comprehensive driver model (Lindman, Ödblom, et al. 2010; Sander 2018; Zhao et al. 2019). However, driver models should be able to predict realistic driver control for ISSs that rely on driver intervention, such as warning systems. Unfortunately, studies that attempt to evaluate the safety benefits of warning systems usually implement naïve driver models that include a reaction time and a reaction intensity that are either deterministic or drawn from distributions (Sugimoto and Sauer 2005; McLaughlin, Hankey, Dingus, and Klauer 2009; Kusano and Gabler 2012; Kusano, Gabler, and Gorman 2014; Billicsich et al. 2016). Very few studies have implemented a driver model that was situation-dependent (i.e., the driver reaction depends on the environment, the kinematics, etc.), although Markkula, Engström, et al. (2016) suggested that reaction times may be correlated with the urgency of the situation (e.g., shorter times-to-collision would elicit shorter reaction times). One of the few studies that used a kinematics-dependent driver model, that of Roesener et al. (2017), proposed a methodology to evaluate the benefits of an automated driving (AD) system. Simulated driver control was predicted with a model that includes a reaction time (determined by a statistical distribution) followed by a kinematics-dependant reaction intensity, either for braking or steering. Those studies may not have put much effort into their driver model, and the impact of the driver model on the result of the evaluation is unknown.
Chapter 6
Methods
6.1
Overview of the research methodology
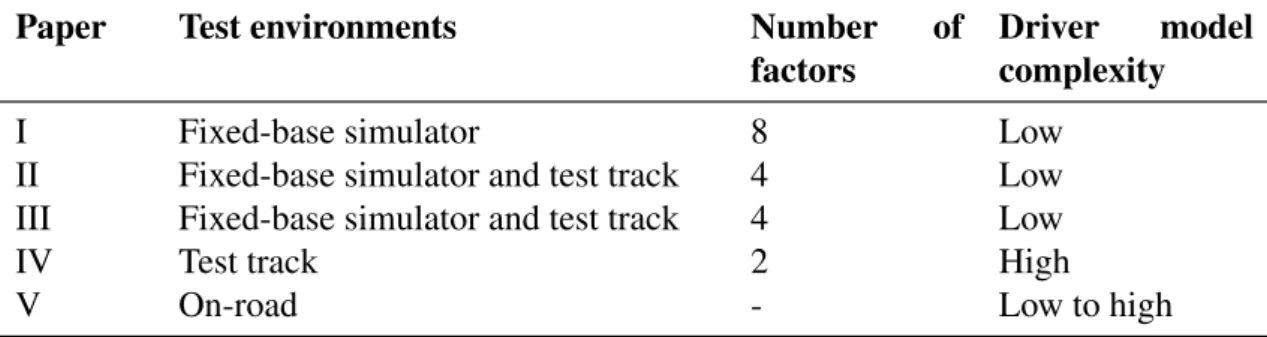
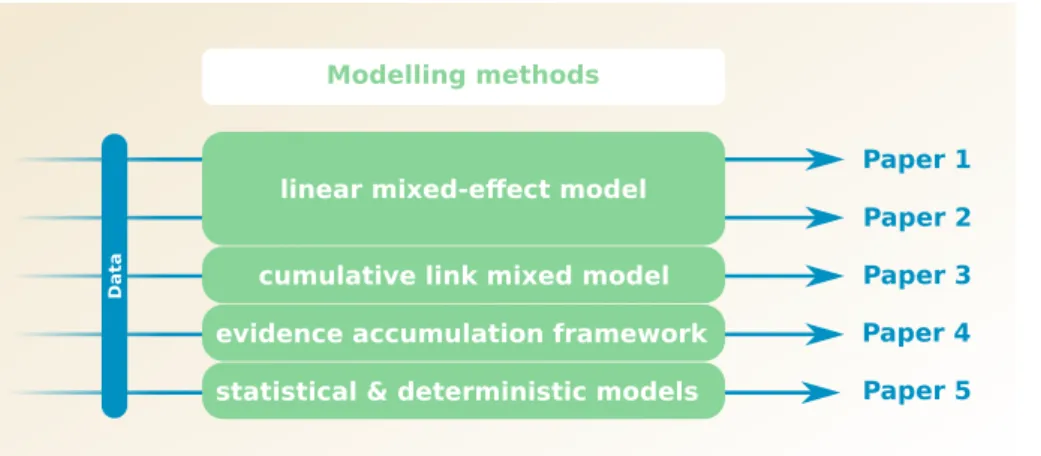
While each of the appended papers addresses different research interests, they are all interconnected via the overall methodology of this Ph.D. project. Table 6.1 demonstrates three ways of categorising the methodology: 1) test environments, 2) the number of factors analysed, and 3) the complexity of the devised driver models. The data used for the analyses in the five papers were collected in three types of test environment: driving simulator, test track, and real world (road). The simulators set up for this project’s analyses were inexpensive fixed-based simulators. The initial assumption was that as the complexity of the test environments increased (i.e., resembling the real-world environment more) the participants would exhibit more genuine driving behaviour. However, the observations from the fixed-base simulators would still provide useful indications about how drivers behave. Additionally, the inexpensive fixed-base simulator setups provide a good way to investigate several factors without designing a complex experimental protocol; the simpler protocol can easily be preserved when switching between different trials. The first paper included several factors, to determine which had a significant influence on driver behaviour. Built uponPaper I’s results, the analyses carried out forPapers II-IIIfocused on four specific factors. The driver behaviour model presented inPaper IVwas, in turn, partly based on one factor related to one of those four inPapers I-III.Paper Vdid not analyse any factors on driver behaviour since its goal was to evaluate how driver behaviour models could affect the results of ISS safety benefit evaluations. Paper Vimplemented
Table 6.1: Methodological progression through the papers
Paper Test environments Number of
factors
Driver model complexity
I Fixed-base simulator 8 Low
II Fixed-base simulator and test track 4 Low III Fixed-base simulator and test track 4 Low
IV Test track 2 High
V On-road - Low to high
20 6.2. Data collection
five distinct driver models, ranging from simple to more complex. The models presented inPapers I-IVfollowed the same progression: while the driver models fromPapers I-III
were simply statistical models (i.e., linear mixed-effect models and cumulative link mixed models) or deterministic models (Paper II), the model in Paper IV is more complex. Benefiting from the knowledge acquired inPapers I-III, it may predict driver behaviour with higher fidelity than simpler models.
According to their 2025 roadmap (Euro NCAP 2018), Euro NCAP seeks to implement more simulations in their assessment protocols. The study presented inPaper Vevaluates the extent to which the driver model influences the outcome of such simulations, while
Papers I-IVaimed at providing driver models that could be used in crossing scenarios with pedestrians and cyclists. Note thatPapers I-IVfocused on crossing scenarios with pedestrians and cyclists; however, because a significant amount of NDD was available for rear-end scenarios (i.e., car-following scenarios that turned into rear-end crashes),Paper Vpresented rear-end scenarios as a use case.
6.2
Data collection
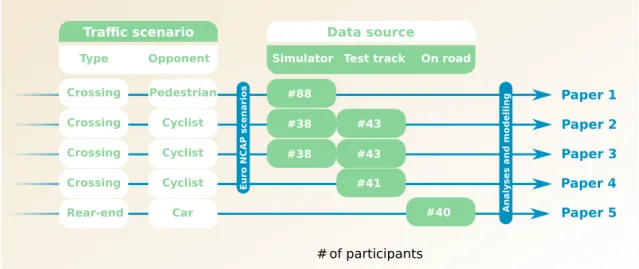
Except for the driving data from the SHRP2 naturalistic driving study, all the other data were collected during the Ph.D. project (Figure 6.1). Test protocols were designed to address the objectives of the project, test environments were set up according to the protocols, and participants naïve to the experiments were recruited.
Figure 6.1: Driving scenarios and data sources for the studies presented in this Ph.D. thesis
6.2.1
Participants
Simulator experiments
Two driving simulator experiments were carried out using a fixed-base simulator located at SAFER (Vehicle and Traffic Safety Centre at Chalmers University of Technology,
Chapter 6. Methods 21
Gothenburg). The participants answered an advertisement shared through SAFER’s mailing list, through fliers that were distributed in public places (supermarkets, parking lots, etc.), and on social media (Facebook and Reddit). The recruitment criteria were that the participants should be over 25 years old and hold a valid driving licence. In the first experiment (data forPaper I), 107 persons signed up, 94 participated in the experiment, and the data from 88 of them were retained for the analyses. In the second experiment (data forPapers II-III), 47 persons signed up and participated in the experiment, and data from 38 were retained for the analyses.
Test-track experiment
The test-track experiment followed the same experimental protocol and recruitment criteria as the second simulator experiment (see next sub-section). All the participants were Autoliv employees, recruited through an internal mailing list. Forty-four persons participated, data from 43 of those were retained for the analyses ofPapers II-III, and data from 41 were used inPaper IV.
6.2.2
Experimental protocols
Pedestrian crossing scenario
The main motivation behind the pedestrian crossing scenario experiment was to estimate the effect of multiple factors on driver behaviour when approaching a crossing pedestrian. Seven factors (see Table 6.2) that were shown to be relevant in pedestrian crossing scenarios were chosen from the literature. Additionally, the levels of the factors were chosen to ensure that the Euro NCAP’s pedestrian crossing scenarios were included. Because a full factorial design would result in 128 different combinations of those factors (with 2 levels each), a fractional factorial design was used to reduce the number of trials to 32 (using a 27−2 resolution V fractional factorial design (Box et al. 2005)). This design has the
advantage of reducing the time and resources needed for the experiment while retaining the ability to study the main effects and the 2-way interactions of the factors. However, higher-level interactions cannot be evaluated due to the reduced number of trials.
Each participant went through 39 trials: 32 trials corresponding to the fractional factorial design, three trials reproducing trials analysed in previous studies (for comparison), and one trial that was reproduced four times at fixed time intervals to study longitudinal changes in driver behaviour.
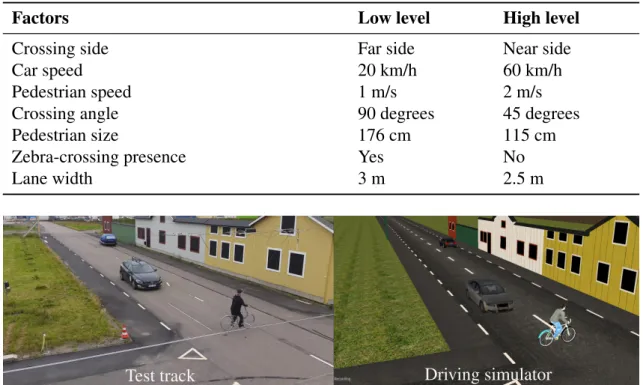
Cyclist crossing scenario
For the cyclist crossing scenario, the experimental protocol was carried out both in a fixed-base driving simulator and on a test track (more details about the setups are in the next section). To compare driver behaviour in both environments, they were modelled to be as similar as possible (see Figure 6.2) to provide the participants with the same driving experience regardless of the test environment.
This test scenario was also based on the Euro NCAP scenario CBNA-50, in which a cyclist crosses the vehicle path and, if no action is taken, the vehicle will collide with
22 6.2. Data collection
Table 6.2: Factors studied reported inPaper I
Factors Low level High level
Crossing side Far side Near side
Car speed 20 km/h 60 km/h
Pedestrian speed 1 m/s 2 m/s
Crossing angle 90 degrees 45 degrees
Pedestrian size 176 cm 115 cm
Zebra-crossing presence Yes No
Lane width 3 m 2.5 m
Test track Driving simulator
Figure 6.2: Images displaying the physical environment from the test-track experiment and the driving simulator experiment.
the cyclist with a 50 % overlap. In the Euro NCAP test protocol, the car speeds increase from 20 to 60 km/h and the cyclist becomes visible around 4 s before the car reaches the potential collision point (Euro NCAP 2019). In the Ph.D. project’s experimental protocol, three variables were controlled: 1) the instructed car speed, set to 30 or 50 km/h; 2) the cyclist speed, set to 10 or 20 km/h; and 3) the encroachment sequence, controlled so either the cyclist would pass before the car, the car would collide with the cyclist with a 50 % overlap, or the car would pass before the cyclist. Note that the encroachment sequence was not dynamically controlled; it was only respected if the conditions on the other variables were fulfilled (i.e., constant speeds and no avoidance manoeuvres).
A full factorial design was used, resulting in 12 trials. Of those 12 trials, four were reproduced, except that the cyclist would come to a full stop before entering the car’s travel path. Additionally, four trials in which no cyclist would cross were added to limit driver expectancy. Finally, in the simulator experiment, an extra trial was added at the very end of the experiment, in which the drivers would find themselves in a critical crossing scenario (the cyclist would be visible around 1.5 s before the car would reach the intersection point).
6.2.3
Test environment setups
Driving simulator setups
The two driving simulator setups were similar, using the same hardware except for the display: a Hitachi CP X1 LCD video projector (1024x768 resolution) for the first
exper-Chapter 6. Methods 23
iment and three Samsung 40” LED-TV screens (1920x1080 resolution) for the second experiment. The latter enabled a larger field of view (see Figure 6.3).
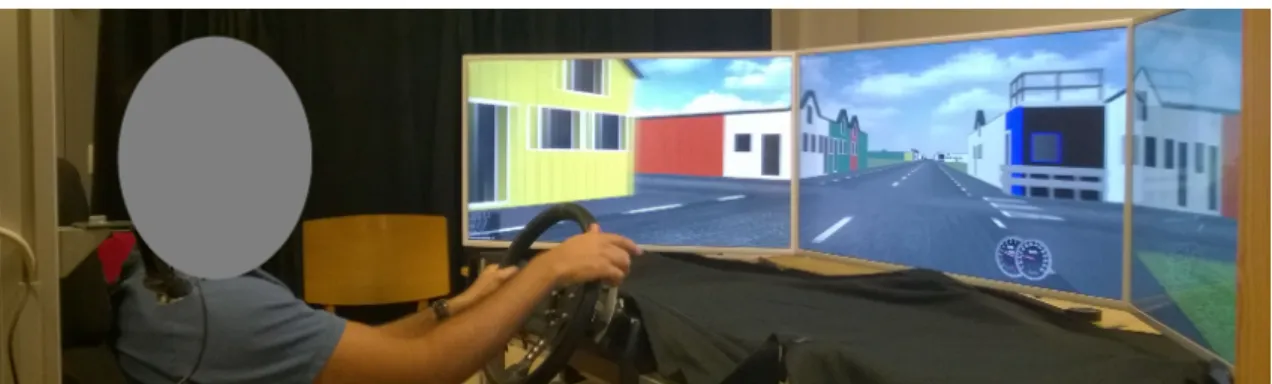
Figure 6.3: Setup of the second fixed-base driving simulator used in this thesis work.
Only open-source software was used for setting up the simulators. OpenDS, a driving simulator program based on jMonkeyEngine, was modified to record data from all the road users and MakeHuman and Blender were used to design and animate the 3D models, respectively. The position and speed of the road users were collected, as well as the positions of the participant controls (pedals and steering wheel). For the second driving simulator setup, the 3D models simulated the environment of the test-track setup as closely as possible to provide similar visual input to the participants, independent of the test environments (i.e., simulator or test track).
Test-track setup
The data collection took place on the Carson City test track owned by Autoliv (see Figure 6.4), in Vårgårda, Sweden. All tests occurred in daylight on dry asphalt. The bicycle was constructed of light plastic and foam, and a lightweight dummy represented the cyclist. The bicycle and dummy were attached to cables which were pulled forward to obtain the desired position and velocity. The bicycle frame was linked to the track in the road to keep the bicycle vertical during the experiment. The data logger used was a VBOX 3 RTK (Racelogic Ltd.1, Buckingham, UK) equipped with a D-GPS RTK, recording at 100
Hz. The collected data provided information on vehicle position, speed, and acceleration. Two wire potentiometers were used to measure the gas and brake pedal positions. The analogue output signals from the potentiometers were sampled using the VBOX system.
6.2.4
Naturalistic driving data
In a project called SAFER Glances (Victor et al. 2015), in which the author took part, 46 rear-end crashes were extracted and analysed. The same crash dataset was used inPaper V; 12 crashes were dismissed due to low data quality or missing data. The speeds of the leading vehicle and the following vehicle (i.e., the instrumented vehicle) were used as well as the relative speed, the relative acceleration, and the distance between the two vehicles.
1http://www.racelogic.co.uk/_downloads/vbox/Datasheets/Data_Loggers/
24 6.3. Driver behaviour modelling
cyclist dummy
ego car
obstruction
pulley and cable system
Figure 6.4: Autoliv’s "Carson city" test track used to collect driving data in cyclist crossing scenarios.
Additional variables were extracted after manual annotation of the forward video (method described by Victor et al. (2015)): 1) the optical angleθformed by the left and right sides of the leading vehicle from the driver’s perspective, 2)θ˙(i.e., the derivative of theta), and 3) τ (the ratio θ/θ˙). These optically derived variables were used by most of the driver models implemented in thePaper V.
6.3
Driver behaviour modelling
As mentioned in the introduction of this Chapter, driver behaviour has been modelled to different degrees in all five papers (Papers I-V). Except for the model presented in
Paper IV, the modelling methods used are simple statistical or deterministic methods (Figure 6.5).
The computational model inPaper IV was partly built on the deterministic model developed forPaper II, in which the time when drivers initiated their braking regulation (i.e., brake onset) could be expressed as a function of the bicycle appearance time (i.e.,
T T Avis). As hypothesized inPaper II’s discussion section, the mechanism behind the
deterministic model might be explained by the accumulation of cues providing evidence of the need for braking. In Paper IV, the cue used to describe the need for braking, longitudinal looming, is related toT T A(mathematical demonstration by Morando (2019)). The choice of looming was motivated by a substantial number of studies showing a relation between the need for braking and the looming cue (initially theorised by Lee (1976) and further analysed by Markkula, Engström, et al. (2016) and Victor et al. (2015), among others). Additionally, the looming cue was used in the Markkula, Boer, et al. (2018)’s modelling framework to predict braking regulation (Svärd et al. 2017; Markkula 2015).
Chapter 6. Methods 25
Figure 6.5: Modelling tools
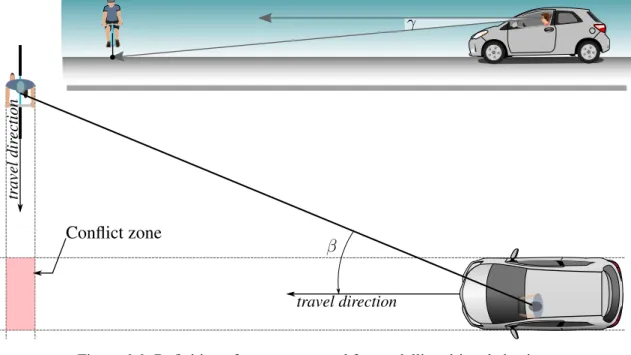
Note that the looming cue in those studies differs from the longitudinal looming cue, which is defined as the ratio of the angleγ(see Figure 6.6) to its derivative (Fajen 2013).
Paper IV’s model did not include just one cue describing the need for braking; it also included a variable describing when it was safe to pass, the predicted post-encroachment time (P ETproj)—defined as the predicted time between the moment one road user leaves
the conflict zone (see Figure 6.6) and the other one enters it. While this variable is not a cue that drivers directly perceive, it is closely related to a cue that they can perceive: bearing angle (β, see Figure 6.6). A model proposed by Cutting et al. (1995), the constant bearing angle model (i.e.,β˙ = 0), describes how humans may be intercepting (or avoiding) moving objects. In order to move safely, humans may try to maintain aβdifferent from zero (i.e., so that the obstacle passes either before or after the moving human). A more recent model (Fajen 2013) extended that one to account for the obstacles’ widths. The variableP ETproj is itself an extension of the constant bearing angle model’s accounting
for obstacle width. P ETprojaccounts not only for obstacle’s length and width but also for
the driven car’s dimensions. In fact,P ETproj is related to the bearing angle derivative:
whenP ETproj is close to zero the bearing angle derivative is also close to zero. When
P ETprojis equal to zero, the car is on a collision course with the obstacle if the road users’
speeds are kept constant. WhileP ETproj is certainly not a cue that drivers perceive, it
can be seen as a metric that accounts for multiple perceptible cues, including the bearing angle, the visual angles from the obstacle’s extremities to the drivers’ eyes, and the drivers’ knowledge of their own vehicle dimensions.
26 6.3. Driver behaviour modelling β tr avel dir ection travel direction γ Conflict zone
Chapter 7
Summary of papers
The studies presented in the papers were organised to address the objectives of the thesis (Section 1.2). Devising a driver model requires that enough data on driver behaviour are available. If it is not the case, driver behaviour studies (i.e., analyses of driver behaviour) should be undertaken to provide the necessary data for the modelling. The new knowledge gathered by such studies needs to be disseminated, in particular (since it is one of the objectives of the present thesis) to ISS assessment programmes such as Euro NCAP to improve their existing test protocols. The driver models may be either used in ISSs’ threat-assessment algorithm, or in virtual simulations such as counterfactual simulations for ISSs’ safety benefit evaluation.
The first and second objectives of the Ph.D. work were addressed by thePapers I-IV, the third objective by the Papers I-III, and the fourth objective by the Paper V. The publications are summarized in the next section.
The contributions of the author to the five papers were as follows:
Paper I - The author took part in designing the experimental protocol. He modified OpenDS to match the study’s requirements, ran most of the analyses, prepared the results, and participated in the paper writing.
Papers II-IV - The author played a major role in the design and implementation of the experimental protocol in the driving simulator and the test-track experiments. He conducted the analyses and prepared the results. He was the main author.
Paper V - The author participated in the analyses by acquiring, filtering, and post-processing the naturalistic driving data. The author assisted the main author, Jonas Bärgman, with the implementation of the counterfactual simulation in MATLAB, as well as, with writing the paper.
Ethical statement:
All the participants who took part in the experiments were volunteers. The volunteers’ involvement followed Swedish ethical guidelines. Before starting each experiment, the participants were informed how the experiment would unfold, what was expected from them, and that they could stop the experiment at any time without providing any reason. They then signed a consent form. All the collected data were anonymized. All the experiments were designed to ensure the participants would not be harmed, physically or psychologically.
Chapter 7. Summary of papers 29
Paper I — How do Drivers Negotiate Intersections with
Pedestrians? Fractional Factorial Design in an Open-source
Driving Simulator
Introduction
ISSs still need improvement to intervene at the right time; a compromise has to be found between degrading driver acceptance of the system (by intervening too early) and degrading the system’s safety benefits (by intervening too late). However, the influence of factors such as lane width or pedestrian speed on the intervention timing of ISS for pedestrian crash avoidance is still unknown.
Aim
The aim of the paper was to quantify the influence of seven factors (crossing side, car speed, pedestrian speed, crossing angle, pedestrian size, zebra-crossing presence, and lane width) on the driver response process in a driving simulator study.
Method
Ninety-four volunteers participated in the study and drove through an intersection in a fixed-base driving simulator. A fractional factorial design was used to reduce the total number of trials while keeping the ability to study the main effects of the studied factors. Several parameters describing the driver response process were calculated.
Results
Results of linear mixed-effect models show that the driver response process was based mainly on pedestrian time-to-arrival and appearance time. The other factors did not have a significant influence. Some longitudinal effects were present; more experienced drivers were more susceptible to changing their approach strategy to minimize driving effort than less experienced drivers were.
Discussion
A greater understanding of the effect of pedestrian’s appearance time and time-to-arrival on driver behaviour will facilitate the design of more precise and acceptable activation timings for FCW systems. The fractional factorial design was helpful in reducing the number of trials while retaining the ability to study the factors’ main effects. However, this design did not allow in-depth analyses (i.e., analyses of a higher level of factor interactions). In the future, this study may guide the design and evaluation of FCW (perhaps with counterfactual analyses), by highlighting which factors deserve further investigation.
Chapter 7. Summary of papers 31
Paper II — Modelling how drivers respond to cyclists
cross-ing their path at intersections: How do test-track and
driv-ing simulator experiments compare?
Introduction
Cyclist fatalities in the European Union are a great concern. Most are due to crashes between motorized vehicles and cyclists at unsignalised intersections. One countermeasure that has been introduced to reduce the number of crashes is ISS. In order to assist drivers without becoming a source of annoyance, these safety systems require a good understanding of driver behaviour to intervene at the appropriate time.
Aim
This study was undertaken to quantify the effects of several factors (including car speed, pedestrian speed, encroachment sequence, and appearance time) on the driver response process when approaching a crossing cyclist. The results could be used to inform the design of test scenarios for assessment programmes such as Euro NCAP.
Method
The influences of car speed and cyclist speed on the driver response process were assessed for three different crossing configurations. The same experimental protocol was tested in a fixed-base driving simulator and on a test track. A virtual model of the test track was used in the driving simulator to keep the experimental protocol as consistent as possible.
Results
Results show that car and bicycle speeds did not directly influence the response process, and neither did crossing configuration—although the configuration did influence the strategy chosen by the drivers to approach the intersection. Bicycle appearance time (which depends on car speed, bicycle speed, and crossing configuration) had the most significant effect on the driver response process. Dissimilarities between the test-track and driving-simulator studies were found: 1) the participants did not follow the same strategy when it came to releasing the gas pedal, and 2) the braking profiles were drastically different. However, there were also interesting similarities: for example, drivers followed the same strategy to initiate braking.
Discussion
These findings suggest that cyclist appearance time should be integrated into the threat-assessment algorithms of ISS, since it is such a predominant factor in the driver response process. Additionally, the findings suggest that it is acceptable for an FCW to be issued before an AEB. It is, therefore, suggested that Euro NCAP consider utilising FCW in cyclist crossing interactions as part of their test protocol.
Chapter 7. Summary of papers 33
Paper III — Modelling discomfort: How do drivers feel
when cyclists cross their path?
Introduction
Many on-road cyclist fatalities occur when the cyclist crosses a vehicle’s path. Although ISSs address these interactions, their driver behaviour models may not be optimal in terms of driver acceptance. Incorporating explicit estimates of driver discomfort might improve acceptance.
Aim
The main aim of the study was to devise a computational model that predicts the degree of discomfort experienced by drivers when cyclists cross their travel path. Ideally, the model would be used to quantify the discomfort experienced by drivers and adapt the systems’ intervention timing accordingly.
Method
The data collected and presented inPaper IIwere used to analyse the effects of controlled variables (car speed, bicycle speed, and bicycle-car configuration), and a visual cue (the car’s time-to-arrival at the intersection when the bicycle appears;T T Avis) on self-reported
discomfort (on a 7-step scale). Cumulative link mixed models (CLMM) were used to quantify the level of discomfort experienced, depending on the variables of interest. The prediction performance of the CLMMs was estimated using the leave-one-out cross-validation method.
Results
In both experimental environments (i.e., test track and simulator), the controlled variables were shown to significantly influence discomfort. T T Aviswas shown to have a significant
effect on discomfort as well: the closer to zero T T Avis was (i.e., the more critical the
situation), the more likely it was that the driver reported great discomfort. The prediction accuracies of the CLMM with all three controlled variables and the CLMM with the visual cue only were similar; the exact discomfort score was predicted with an average accuracy between40 and 50%, but the average accuracy rose to between 80and 85% when the discomfort score was predicted with a tolerance of±1.
Discussion
The models successfully predicted the level of discomfort experienced by the drivers. The visual cue,T T Avis, appears to be an important cue that drives discomfort, which can be
related to the main result ofPaper II: whenT T Aviswas smaller, the braking reaction time
was shorter. This observation can be related to previous literature by suggesting that the more discomfort the drivers experience, the faster they try to get back into their comfort
34
zones. It is therefore suggested that the proposed model be included in decision-making algorithms of ISS to improve driver acceptance.
Chapter 7. Summary of papers 35
Paper IV — A computational driver model to predict driver
control at unsignalised intersections.
Introduction
Crash statistics show that cyclists are still vulnerable on roads, and that the number of cyclist casualties has been stable over the last few years. Crossing scenarios are a complex traffic situation in which cyclists are at high risk, but few ISSs address it at all. A computational driver behaviour model predicting drivers’ braking behaviour in this traffic scenario is required to improve ISSs’ threat-assessment algorithms.
Aim
The aim of this study was to to address this lack of appropriate models by proposing a predictive computational model for crossing scenarios. The study also sought to determine the principal cues that have a direct influence on drivers’ braking behaviour.
Method
The proposed model was implemented using a biofidelic human sensorimotor-control modelling framework based on the evidence accumulation principle. Two visual cues were used: 1) optical longitudinal looming (τ) and 2) projected post-encroachment time between the bicycle and the car (P ETproj). The first was used as an excitatory cue (i.e., eliciting
the need for braking), and the second was used as an inhibitory cue (i.e., repressing this need). The model was optimised using data from the test-track experiment presented in
Paper II. The prediction performances of the model were evaluated by comparing the simulated driver-control process with the observed control behaviour for each trial, using a leave-one-out cross-validation method.
Results
The cross-validation process showed that the model was able to predict a braking deflection signal similar to the observed one. Moreover, the model’s braking control prediction reproduced kinematics that were also similar to the observations.
Discussion
As shown by the veracity of the model predictions, the choice of cues was judicious—even though the implementation may be limited by the assumptions made (e.g., fully attentive driver or decelerating with brake pedal only). The use of this model in ISS implementations may help to increase its driver acceptance, either by advancing or delaying the intervention appropriately or by adapting the intervention effect (e.g., by increasing braking force).
Chapter 7. Summary of papers 37
Paper V — Counterfactual simulations applied to SHRP2
crashes: The effect of driver behaviour models on safety
benefit estimations of intelligent safety systems
Introduction
Counterfactual simulations are a recently developed methodology, used primarily to eval-uate the safety benefits of ISSs before the systems’ introduction on the market. The simulations implement models from the joint driver-vehicle-environment system. However, so far, the inclusion of realistic driver models in counterfactual simulations has been limited. In the literature, most applications of counterfactual simulations use a simple driver model based on statistical distributions which does not consider the possibility that the urgency or the kinematics of the situation may affect driver responses.
Aim
The aims of the paper were, firstly, to demonstrate the importance of the choice of driver model when evaluating two specific ISSs (FCW and AEB systems). Secondly, the paper shows how to perform sensitivity analyses on the settings of driver