Conservation Reserve Program:
Environmental Benefits Update
LeRoy Hansen
This paper presents the methodology, assumptions, and data used to generate regional and na-tional environmental benefit estimates of the USDA’s Conservation Reserve Program (CRP). It’s assumed that, without the program, production and conservation practices on CRP lands would be the same as those used on surrounding lands. When range and forest lands are (are not) included as land-use options, 54 (71) percent of the CRP land would be in crop produc-tion—which is consistent with past analyses. Soil erosion would be 222 to 248 million tons per year—about 11 percent—higher than the current level. Benefits are estimated by applying environmental benefit models, estimated in previous analyses, to the CRP’s estimated effect on erosion and wildlife habitat. Nationally, the CRP is estimated to provide $1.3 billion in an-nual benefits, which represents 75 to 80 percent of the program’s cost. In seven of the 10 USDA Farm Production Regions, the CRP’s environmental benefits exceed costs. Thus, real-locating acreage to these regions could increase net program benefits. However, because many benefits could not be estimated, one cannot conclude that regional and national benefits do not exceed costs.
Key Words:environmental benefits, Conservation Reserve Program, soil conservation, water quality benefits, wildlife benefits, soil productivity
Long-term retirement of cropland under the Con-servation Reserve Program (CRP) provides many environmental benefits, while protecting the na-tion’s ability to produce food and fiber. Among other things, the CRP increases soil productivity, improves water quality, enhances the health of wildlife ecosystems, increases wetland resources, and sequesters carbon. The CRP is the USDA’s largest conservation program. As of August 2006, 36.3 million acres were enrolled in the CRP at an annual cost of $1.7 billion (U.S. Department of Agriculture 2006).
When established by the Food Security Act of 1985, the primary purpose of the CRP was to re-move highly erodible cropland from production. An important secondary objective of the program was to help stabilize farm incomes at a time when
the sector was weathering its worst economic downturn since the Great Depression. Over time, the environmental goals have become more im-portant.
Measures of the CRP’s environmental benefits could aid two policy decisions. First, with each Farm Bill, the question is raised whether the envi-ronmental and income benefits of the CRP justify federal costs. And second, as the program is im-plemented, measures of the environmental bene-fits could be used to improve the CRP contract selection process because they provide insight into which contracts are likely to provide the greatest benefits relative to cost. This paper pro-vides regional and national estimates of the CRP’s environmental benefits and describes the supporting methodology, assumptions, and data. The paper begins by considering how farmers might use CRP lands if the program were elimi-nated and how the land uses would affect erosion and wildlife habitat. To explore the sensitivity of the results to assumptions on farmers’ behavior, the CRP’s environmental benefits are estimated under four different land-use scenarios. Further-more, unlike past research, this analysis recog-nizes that the erosion potential of CRP and non-_________________________________________
LeRoy Hansen is Environmental Economist at the Economic Research Service, U.S. Department of Agriculture, in Washington, D.C. The author would like to thank Alexander Barbarika of the USDA Farm Services Agency, Shawn Bucholtz, Daniel Hellerstein, Ruben Lubow-ski, Marc Ribaudo, and Kathryn Lipton of the USDA Economic Re-search Service, two anonymous reviewers, and the journal’s editors, Lori Lynch and Wesley Musser, for their comments and suggestions. The views expressed are the author’s and do not necessarily reflect those of the U.S. Department of Agriculture or the Economic Research Service.
Agricultural and Resource Economics Review 36/2 (October 2007) 267–280
CRP lands might differ. To estimate benefits, avail-able environmental benefit models are applied to the CRP’s estimated effect on erosion and wild-life habitat.
Prior Research
A variety of methods have been used to estimate the CRP’s impacts on land uses, though not all have attempted to value the environmental bene-fits. Some studies relied on land-use and survey data to predict how farmers might use CRP lands in the program’s absence. Other studies used mod-els of the agricultural sector, thus incorporating price effects to predict changes in land uses. Studies that have used land-use and survey data have taken three approaches. The first approach, commonly used in CRP benefit assessments, as-sumes that, without the program, farmers would use CRP lands as they did prior to the program’s implementation (Ribaudo 1989, Ribaudo et al. 1989, Feather, Hellerstein, and Hansen 1999). Un-der this scenario, approximately 93 percent of the CRP lands return to field-crop and hay produc-tion as contracts expire.
The second approach used survey data on land-owners’ intended use of CRP lands, if the pro-gram was no longer an option. Osborn, Schnepf, Keim (1994) and Dodson et al. (1994) estimate that 63 percent of the acreage leaving the CRP would return to crop production, 23 percent would retain its cover for hay and forage (e.g., pasture and range), and nearly 10 percent would be kept in grass and tree cover for production of forest products and to maintain wildlife habitat.
The third approach uses data on lands that left the CRP between 1992 and 1997 to predict the probability that a field leaving the CRP would be used in crop production. Independent variables include the characteristics of the field, surround-ing land uses, and net returns to various land-use options. With 2,800 observations representing 3.6 million acres and assuming no changes in prices, Roberts and Lubowski (2006) estimate that 58 per-cent of the CRP acreage would return to crop pro-duction, at least in the short run, if the CRP were terminated.
Agricultural-sector models, such as the Food and Agricultural Policy Simulator model (FAP-SIM), have been used to assess the CRP’s im-pacts on agricultural production, prices, incomes,
program payments, and land use. Young and Os-born (1990) estimated a slippage rate of 20 per-cent—that is, for every 100 acres of cropland that enters the CRP, the subsequent commodity price increases bring 20 acres of hay, pasture, range, or forest lands into crop production.
When land leaves the CRP, one might expect to see reverse slippage. Research has generated es-timates of slippage rates but no eses-timates of re-verse slippage rates. However, for a perspective on the effects of reverse slippage, one could as-sume that reverse slippage equals 100 minus the slippage rate. Most prior research has estimated slippage rates of 20 to 50 percent (Love and Fos-ter 1990, Leathers and Harrington 2000). Thus one might assume that reverse slippage rates range from 50 to 80 percent.
Ribaudo (1989) and Ribaudo et al. (1989) esti-mated the environmental benefits by assuming that, without the program, erosion on CRP lands would have remained at pre-program levels. Both analyses were done before the program was fully implemented. The two studies estimated the pre-sent value of the expected lifetime benefits, as-suming that 45 million acres were enrolled be-tween 1985 and 1990 and that the program was not extended. Based on nine different soil conser-vation benefits (freshwater fishing, water storage, navigation, flooding, roadside ditch maintenance, irrigation ditch maintenance, municipal water treatment, municipal and industrial water use, and steam power cooling), Ribaudo (1989) estimated the CRP’s lifetime benefits to be $3.5 to $4.0 bil-lion (2000 dollars). Ribaudo et al. (1989) added productivity, wildlife habitat, and air quality bene-fits, and estimated the CRP’s lifetime benefit to be $9.6 billion.
Feather, Hellerstein, and Hansen (1999) also assume that, if no longer in the CRP, erosion rates would return to pre-program levels. The annual CRP benefits, with 34 million acres enrolled, were estimated to be approximately $464 million per year—$428 million in wildlife-viewing and pheasant-hunting benefits and $36 million in freshwater recreation. Feather, Hellerstein, and Hansen (1999) did not include the soil erosion impacts of Ribaudo et al. (1989).
Sullivan et al. (2004) estimated annual CRP benefits of approximately $1.3 billion. Unlike past research, their analysis attempts to account for greater use of conservation practices by assuming
that farmers will use the same practices on land leaving the CRP as on surrounding croplands. Thus, they set water and wind erosion rates on highly erodible lands (HEL) and non-HEL lands leaving the CRP equal to the average rates on the surrounding HEL and non-HEL farmlands.1 This
approach implicitly assumes that HEL (non-HEL) CRP lands have the same inherent erodibility as the surrounding HEL (non-HEL) lands. However, there is the possibility that farmers enroll their most erodible HEL and non-HEL lands (Claassen et al. 2001). If this is so, then the inherent erodi-bility of the HEL (non-HEL) CRP lands will be greater than the inherent erodibility of the HEL (non-HEL) non-CRP lands, and Sullivan et al. (2004) will have underestimated the CRP’s effect on erosion—an issue that is evaluated here.
Model
The modeling framework applied in this analysis is similar to Sullivan et al. (2004) in that it at-tempts to account for the increased use of conser-vation practices. This analysis extends Sullivan et al. (2004) in two ways. First, this analysis tests the sensitivity of the benefit estimates to assump-tions on post-CRP land use. And second, as dis-cussed above, this analysis relaxes the assumption that the inherent erodibility of HEL (non-HEL) CRP land equals that of HEL (HEL) non-CRP land.
The Soil Erosion Model
The rate of erosion on a parcel of land is depend-ent on the cropping and conservation practices and inherent erodibility of the soil (Reynard et al. 1994). Cropping and conservation farming prac-tices (FP) are controlled by the farmer. To esti-mate erosion rates on lands that leave the CRP, this analysis predicts the farming practices that farmers will use on HEL and non-HEL lands. En-vironmental factors (EF)—soil type, field slope, and climate—determine the inherent erodibility of lands and are included in the CRP data.
Assuming that HEL (non-HEL) lands that leave the CRP are used the same way as surrounding
1
Highly erodible lands are defined as lands with an erosion potential that is greater or equal to 8 tons per acre per year. Non-HEL has an erosion potential that is less than 8 tons per acre per year.
HEL (non-HEL) farmlands, the probability of ob-serving farming practice i in region r, Pi,r, is
(1) , , , 1 i r i r N i r i w P w = =
∑
,
where wi,r is the number of HEL (non-HEL) acres
in practice i in region r, and N is the set of all farming practices on other HEL (non-HEL) lands in r. Note that all equations are estimated twice for each region, once using observations on HEL lands and again using observations on non-HEL lands. To simplify the discussion, references to the HEL and non-HEL versions of the equations are dropped.
The probable post-CRP erosion rate on field j in region r, Exp_ratej,r, is (2) , , , 1 , 1 * ( , ) _ N i r i r j r j r N i i r i w f FP EF Exp rate w = = =
∑
∑
,,
where f(FPi,r, EFj,r) is the estimated erosion rate
on field j in region r when practice i is used and the environmental factors are EFj,r.2
When estimating sheet and rill erosion, f(FPi,r,
EFj,r) is the universal soil loss equation (USLE)
(Reynard et al. 1994). The FP variables are C (cropping management) and P (erosion control practices). The EF variables are R (rainfall), LN (slope length), and K (soil erodibility). Substitut-ing the USLE for f(FPi,r, EFj,r), equation (2)
becomes (3) Exp_ratej,r , , , , , , 1 , 1 , , , * * * * * * * * * , N i r i r i r j r j r j r N i i r i r r j r j r j r w C P LN R K w C P LN R K = − = =
∑
∑
where Cr Pr* is the acre-weighted average of C*P on non-CRP lands in region r. The expected increase in water erosion in region r due to the elimination of the CRP (Ewatr) is
2 The data used in the analysis are a random sample of points on
agri-cultural lands. Thus, the reference to “field” is, conceptually, a refer-ence to a point-level observation. The observed “practice” refers to both the observed conservation and cropping practices.
(4) , , , 1 * *J * * * , r r r j r j r j r j r j Ewat C P acres LN R K = =
∑
,where acresj,r is the number of acres represented
by field j in region r. From equation (4), one can see that, by assuming that the average erosion rates on post-CRP lands equal those on surround-ing non-CRP lands, Sullivan et al. (2004) implic-itly assume that, for each region r, the acre-weighted averages of LNj,r, Rj,r, and Kj,r of CRP
lands equal their acre-weighted averages on non-CRP lands.
Unfortunately, the wind erosion equation (WEQ) is not a continuous function (Woodruff and Sid-daway 1965). Thus, the effects of farming prac-tices cannot be averaged and applied in a manner similar to equation (3). Instead, falling back on the approach used by Sullivan et al. (2004), the average wind erosion rate on post-CRP lands in region r(Exp_wind_rater) is assumed to equal the
acre-weighted average wind erosion rate on the region’s non-CRP farmland. The expected post-CRP wind erosion in region r (Ewindr) is
(5) , 1 _ _ * Jr r r j
Ewind Exp wind rate acres
=
=
∑
j r.) With estimates of the CRP’s impacts on ero-sion, the benefit function gk,r, and data on current
levels of erosion, the value of erosion’s impact on k (Benk,r) is (6) Benk,r , , ( , , , ( , ), k r r r r r k r r r
g Owat Owind Ewat Ewind g Owat Owind
= −
where Owatr and Owindr are the observed levels
of water and wind erosion, respectively, in region r, and the k subscript is an identifier for the soil erosion benefit model. Benk,r can be summed across
regions to generate state, multi-state, or national estimates, and across the 15 soil conservation fit models to generate a more comprehensive bene-fit estimate (see box).
The Wildlife Model
Without the program, wildlife would lose CRP habitat to the cover provided by the subsequent use of the land. Changes in habitat quality can
change wildlife populations and thus the quality and quantity of environmental services. Two mod-els attempt to value the CRP’s effect on wildlife. Both use a “reduced form” approach where the habitat variables serve as proxies for the quality and quantity of environmental services. Coeffi-cients of the habitat variables embody both the functional relationship between habitat and envi-ronmental services, and envienvi-ronmental services and consumer surplus. The value of the CRP habitat in region r is the difference in the consumer sur-plus with and without the CRP:
(7) WBenw r, =CSCRPw r, −CSNCRPw r, ,
where WBenw,r is the consumer surplus provided
by the CRP lands in region r, CSCRPw,r is
con-sumer surplus associated with wildlife population w, given the habitat observed in r, and CSNCRPw,r
is the predicted level of consumer surplus without the CRP.
Data and Benefit Models
Data on land use and erosion come from the 1982 and 1997 National Resources Inventory (NRI). The NRI contains 800,000 statistically based sample points on U.S. non-federal range, crop, pasture, and forest lands (U.S. Department of Agriculture 2000). The NRI includes all variables in the USLE and estimates of WEQ. The NRI also includes the number of acres associated with each observation. The 1997 NRI observations on CRP lands provide the EF variables: R, K, and LS. Observations on HEL and non-HEL non-CRP lands from the 1997 NRI are used to estimate the expected farming practices for CRP lands by re-gion (more recent NRI data are not available). Observations from the 1982 NRI provide meas-ures of pre-CRP land uses and erosion rates. The location of each NRI observation is given by both the U.S. Geological Survey’s 8-digit hy-drologic unit watershed (HUC) and by county. In estimating the CRP’s impact on erosion, regions are defined as HUCs because soils and growing conditions in these geologic regions are thought to be similar. There are 2,111 HUCs within the 48 contiguous states.
The 15 soil conservation benefit models come from a variety of studies; all but two were derived using the replacement cost, averting expenditure,
BENEFIT MODELS CONSUMER/ PRODUCER SURPLUS
Reservoir services The public’s willingness to pay for less sediment and thus more services from
reservoirs due to a reduction in soil erosion.
Navigation The navigation industry’s willingness to pay to have less sediment affecting
shipping channels and harbors.
Water-based recreation People’s willingness to pay to view and recreate in cleaner fresh water.
Municipal water treatment Municipalities’ willingness to pay to have less sediment in water processed
for public consumption.
Dust-cleaning Households’ willingness to pay to have less cleaning due to a reduction in
wind erosion and wind-borne particulates.
Irrigated agriculture Farmers’ willingness to pay to reduce the adverse yield impacts of the salts
and minerals in irrigation waters that were dissolved from sediment.
Irrigation ditches and canals Agriculture’s willingness to pay to reduce the buildup of sediment and
aqua-tic plants in irrigation ditches and canals.
Soil productivity Farmers’ willingness to pay to reduce losses in soil productivity.
Marine fisheries The marine fishery industry’s willingness to pay to reduce sediment’s impact
on fish catch.
Freshwater fisheries The freshwater fishery industry’s willingness to pay to reduce sediment’s
im-pact on fish catch.
Marine recreational fishing The public’s willingness to pay for an improvement in fish catch-rates due to
reductions in erosion.
Municipal and industrial water use Municipalities’ and industries’ willingness to pay to reduce damages caused
by the salts and minerals in sediment.
Steam electric power plants Power producers’ willingness to pay to reduce plant growth on heat exchangers
caused by nutrients in suspended sediment.
Flood damages The public’s willingness to pay to reduce damages associated with flooding.
Road drainage ditches State governments’ willingness to pay for a reduction in sediment
accumu-lation in ditches along rural roads and highways. Source: Hansen (2006).
and damage function approaches (Hansen 2006). The dust and water-based recreation models use the contingent valuation and travel cost methods, respectively.
Four benefit models embody nonlinear rela-tionships between benefits and soil conservation. Unfortunately, only one model and its supporting data—reservoir services—are available for direct applications. The other three—water-based rec-reation, municipal water treatment, and dust-cleaning—have been used in prior research. Di-viding the benefit estimates by the changes in ero-sion reported in these studies yields “average” marginal benefit estimates—in dollars per ton (Hansen 2006). The prior applications provide re-gional estimates of soil erosion changes and bene-fits. The remaining 11 soil conservation benefit models are linear with respect to erosion.
All benefit models vary across regions. Three models—reservoir services, water-based recrea-tion, and navigation—vary across HUCs. The re-maining models—municipal water treatment, fresh-water commercial fishing, marine fisheries, ma-rine recreational fishing, floods, drainage ditches, irrigation canals, municipal and industrial water use, steam-electric power plants, irrigated agri-culture, dust, and soil productivity–vary by USDA’s Farm Production Region (FPR).
The geographic resolution of the HUC-level models captures more variation in the marginal variation in soil conservation benefits. Regional sums of the HUC-level marginal benefit estimates range from zero to $11.70 per ton (Figure 1). Re-gional sums of the FPR-level water (wind) benefit coefficients range from $0.91 to $8.32 ($0.43 to $1.54) (Figure 2).
Figure 1. Per-Ton Benefits of Reductions in Water Erosion by Hydrologic Unit Watershed
Note: Benefits of reductions in water erosion are the sums of impacts on water-based recreation, navigation, and reservoir-related benefits (Hansen 2006).
The wildlife benefit models—wildlife-viewing and pheasant-hunting—are both estimated with multi-site travel cost models and thus are nonlin-ear, but the data supporting the models are not available (Feather, Hellerstein, and Hansen 1999, Hansen, Feather, and Shank 1999). However, ap-plications of the models provide regional esti-mates of changes in benefits for given changes in CRP acreages (Feather, Hellerstein, and Hansen 1999). Thus, linear approximations of the benefit functions are derived by dividing the reported benefit changes by the associated changes in CRP acreage. These benefit coefficients range from $0.58 to $55.43 per acre of CRP (Figure 3). Mod-els that capture other wildlife benefits, such as small game hunting (other than pheasant), water-fowl hunting, and protection of threatened and endangered species, are not available. Thus, the wildlife-related benefit estimate is likely to be conservative.
Results and Discussion
Most farmland is cropped, hayed, pastured, and used as rangeland and forestland. There are also a number of minor uses—to house and confine live-stock, park machinery, serve as roads, etc. His-tory suggests that CRP lands have been profitable in the more-intensive agricultural uses. Specifi-cally, because of eligibility requirements, land en-rolled in the CRP must have been in crop or hay production four out of the six previous years. Thus, the land is not likely to be left unused, but exactly how it might be used is not known. This analysis considers four land-use scenarios. Scenario 1 assumes that the CRP land will be used as it was prior to enrollment and that erosion rates will equal pre-CRP rates, as assumed in previous studies (Feather, Hellerstein, and Hansen 1999, Ri-baudo 1989, RiRi-baudo et al. 1989). This scenario is expected to over-estimate the CRP’s effect on
Figure 2. Per-Ton Benefits of Reductions in Water and Wind Erosion by USDA’s Farm Production Region
Note: Benefits of reductions in water erosion are the sums of impacts on municipal water treatment, freshwater fisheries, marine fisheries, marine recreational fishing, flood damage, road drainage ditches, irrigation ditches and canals, municipal and industrial water use, soil productivity, and steam-electric power plants. Benefits of reductions in wind erosion are the sums of impacts on dust-related cleaning costs and soil productivity benefits.
erosion because, first, it does not allow for in-creases in the use of conservation practices, and second, it does not account for reverse slippage. Scenario 2 assumes that the mix of uses of CRP lands will be the same as the crop-hay-pasture
Figure 3. Wildlife-Related Benefits of the CRP ($ per CRP acre)
Note: Wildlife benefits include wildlife-viewing and pheasant-hunting.
(chp) mix on surrounding lands.3 These common
uses of the more-productive agricultural land may provide a reasonable projection of land use. This scenario was used by Sullivan et al. (2004). Scenario 3 assumes that the mix of uses of CRP lands will be the same as the crop-hay-pasture-range-forest (chprf) mix on surrounding farmland. Erosion on rangeland and forestland—lands in permanent cover—tends to be lower than more-intensive land uses. This scenario provides a more conservative estimate of CRP’s effect on erosion than the chp scenario.
Scenario 4 assumes that all lands leaving the CRP are used as pasture. Although this scenario is not likely, it does provide a minimal-effect estimate.
3
Crop, hay, and pasture cover are defined by the NRI Land Cover/ Use Codes 1 through 180. Range and forest cover are defined by Codes 211 through 342.
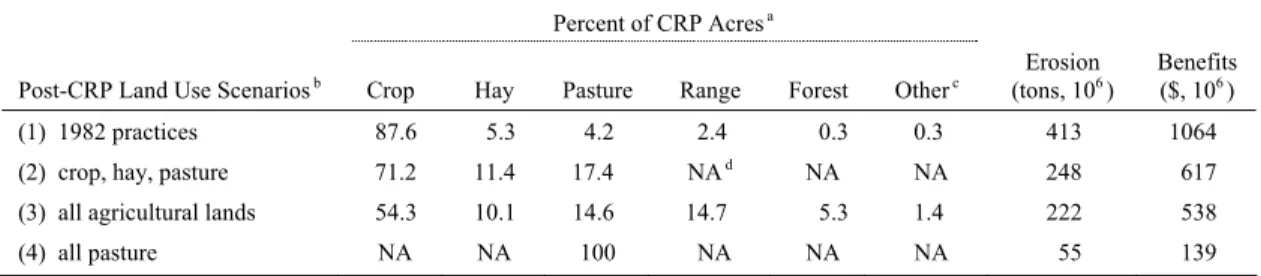
Table 1. Alternative Mixes of CRP Land Uses and Effects on Annual Erosion and Soil Conservation Benefits
Percent of CRP Acresa
Post-CRP Land Use Scenariosb Crop Hay Pasture Range Forest Otherc (tons, 10Erosion 6) Benefits($, 106)
(1) 1982 practices 87.6 5.3 4.2 2.4 0.3 0.3 413 1064
(2) crop, hay, pasture 71.2 11.4 17.4 NAd NA NA 248 617
(3) all agricultural lands 54.3 10.1 14.6 14.7 5.3 1.4 222 538
(4) all pasture NA NA 100 NA NA NA 55 139
a Rows may not sum to 100 because of rounding.
b Scenario (1) ¸ each CRP field will have the same crop and production practices as observed in 1982. Scenario (2) ¸ each CRP
field will have the same crop, hay, and pasture mix and production practices as what is observed on surrounding lands. Scenario (3) ¸ each CRP field will have the same crop, hay, pasture, range, and forest mix and production practices as what is observed on surrounding lands. Scenario (4) ¸ all CRP lands will be used as pasture.
c Includes feedlots, roadways, and other rural and marsh lands. d NA = not applicable—the land use is not an option in the scenario.
Under the first scenario, nearly 88 percent of the CRP lands return to crop production (Table 1). In the chp scenario, approximately 71 percent of the CRP acres return to crop production. In the chprf scenario, 54 percent of the CRP acres return to crop production. The predicted increases in crop acreages under the chp and chprf scenarios are
lower than CRP acreage in crop production in 1982 (Table 1)
consistent with the 58 percent increase predicted by Roberts and Lubowski (2006)
consistent with the 50 to 80 percent reverse slip-page rates suggested in prior research (Love and Foster 1990, Leathers and Harrington 2000)
consistent with the results of a 1993 survey that found that, if the CRP were not available, farmers would return 63 percent of their land to crop pro-duction (Osborn, Schnepf, and Keim 1994, Dod-son et al. 1994).
Impacts on Erosion
The results of the scenario analyses were used to estimate the program’s soil conservation benefits. Using equation (4), the CRP reduces annual water (sheet and rill) erosion under the chp and chprf scenarios by an estimated 100 million and 84.4 million tons, respectively. The program lessens total erosion by 248 and 222 million tons, or about 11 to 12 percent of the total 1997 farmland erosion (Table 2).4 Under the more conservative
4 SAS version 9.1.3 was used to generate all estimates.
chprf scenario, the CRP’s impact on erosion is 10 percent less than the chp scenario, even though field crop acreage is 24 percent lower.
To provide a perspective on the need to con-sider inherent erodibility, the CRP’s effect on water erosion is re-estimated by equating erosion rates on HEL (non-HEL) CRP lands to those of surrounding lands, as did Sullivan et al. (2004). Results show that the inherent erodibility of HEL (non-HEL) CRP lands is about the same as that of surrounding HEL (non-HEL) non-CRP lands. Un-der the chp and chprf scenarios, the CRP reduces water erosion by 98.6 million and 83.2 million tons, respectively, or about 1.5 percent.5 Equation
(5) is likely to provide reasonable (and perhaps conservative) estimates of the CRP’s impact on wind erosion.
The loss of the CRP would increase erosion by 413 million tons per year under scenario 1 and 55 million tons under scenario 4 (Table 1). It is in-teresting to note that the mid-point of these ex-treme estimates, 234 million tons, lies between the estimates of the chp and chprf scenarios.
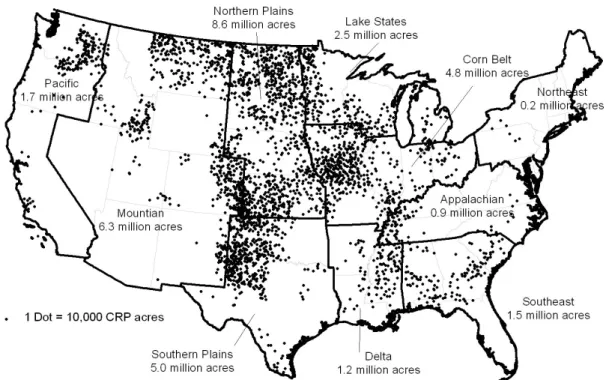
Approximately 80 percent of all erosion reduc-tions are in four of USDA’s ten Farm Production Regions—the Southern Plains, Northern Plains, Mountain, and Corn Belt regions (Table 2). These large reductions are driven primarily by the dis-tribution of the CRP acreage—about 75 percent of all CRP lands lie in these regions (Figure 4).
5 These estimates are similar to those of Sullivan et al. (2004) but,
Table 2. CRP Impacts on Erosion (million tons per year)
Erosion in 1997 Erosion Reductions Due to the CRPa
Farm Production Regionsb Wind Water Total Wind Water Total
Appalachia 0.4 120.6 121.0 0.00c 5.3–5.7 5.3–5.7 Corn Belt 24.2 371.4 395.6 1.0–1.1 31.2–31.8 32.1–32.9 Delta 0.00c 82.4 82.4 0.00 5.5–6.2 5.5–6.2 Lake 134.3 94.4 228.7 8.5–10.3 6.6–7.0 15.1–17.3 Mountain 196.3 62.4 258.7 38.2–39.2 6.2–9.6 44.4–48.8 Northern Plains 191.5 175.2 366.7 22.9–25.3 13.8–16.9 36.2–42.2 Northeast 0.2 48.4 48.6 0.00 0.5–0.6 0.5–0.6 Pacific 41.5 43.5 85.0 4.3–5.2 5.7–6.4 10.0–11.6 Southern Plains 267.8 109.5 377.3 62.8–66.3 4.4–8.7 67.2–75.0 Southeast 0.00 58.1 58.1 0.00 5.6–7.4 5.6–7.4 Total 856 1,165 2,022 137–147 84–100 222–248
a The values at the low (high) end of the ranges are based on the chprf (chp) scenario––that is, scenario 3 (2). b For a layout of the regions, see Figure 3.
c Estimates are less than 0.005.
Figure 4. Distribution of CRP Acres in 1997
Source: CRP contracts file.
Nearly one-third of the reduction in sheet and rill erosion—31–32 million tons—occurs in the Corn Belt, where annual precipitation and a high
concentration of row crop production leaves land vulnerable. The 14–17 million ton reduction in the Northern Plains is second to the Corn Belt,
not because of high sheet and rill erosion rates, but because the region has about 80 percent more CRP acreage.
Approximately 60 percent of the total reduction in erosion is due to the CRP’s effect on wind ero-sion (Table 2). Wind eroero-sion reductions are great-est in the Southern Plains and Mountain regions (63–66 and 38–39 million tons, respectively) (Ta-ble 2). These regions have dry, windy conditions and nearly one-third of all CRP acreage. The CRP appears to reduce erosion in these regions by about 120 million tons, or about 20 percent of their 1997 level, a substantially greater portion than in any other region.
Soil Conservation Benefits
Under scenarios 2 and 3, soil conservation bene-fits of the CRP are $616 and $538 million per year, or approximately $577 million (Tables 1 and 3).6
The single, highest-valued impact of the CRP’s reduction in soil erosion is on water-based recrea-tion (Table 3). At $141 million, the water-based recreation benefits are nearly one-third of the CRP’s estimated water quality benefits (Table 4). At $120 million, the second-highest valued impact of soil conservation is on soil productiv-ity. The productivity benefit estimate is based on the value of expected increase in yields and de-crease in production costs (Ribaudo 1989). On average, 60 percent of the CRP’s soil-productiv-ity benefit is due to expected increases in yields. The third highest valued impact of soil conser-vation—at $68 million—is on dust-cleaning costs (Table 3). Dust-cleaning is the only air quality benefit reported and is less than 8 percent of the total benefits of soil conservation (Table 4). Soil conservation benefits of the CRP are due largely to the water quality impacts. At approxi-mately $389 million per year, water quality fits are twice the productivity and air-quality bene-fits combined (Table 4).
The regional water-quality benefit estimates reflect both the change in erosion and the value of the improvements. For example, soil conservation benefits are highest in the Corn Belt, even though that region ranks fourth in terms of soil erosion
6
For ease of presentation through the remainder of this paper, the reported erosion benefit estimates are the mean-value estimates of sce-narios 2 and 3.
reduction. The Corn Belt benefits are high be-cause it has the greatest reduction in water ero-sion, which tends to be a high-value impact. Regional estimates of the CRP’s soil productiv-ity benefits range from $0.78 to $34 million per year (Table 4). Soil quality and growing condi-tions play a large role in determining productivity impacts. For example, although the CRP con-serves twice as much soil in the Southern Plains as in the Corn Belt, productivity benefits in the Corn Belt exceed those of the Southern Plains (Table 2).
Wildlife Benefits
The estimated wildlife-related benefits of the CRP are approximately $737 million per year (Table 4). This estimate represents the value peo-ple place on improved wildlife viewing and pheasant hunting. Because the subsequent use of CRP lands does not affect benefit estimates— given the models used in this analysis—the wild-life benefit estimates do not vary across the land-use scenarios.
Wildlife-viewing benefits, at $650 million per year, is the larger of the two. Wildlife-viewing
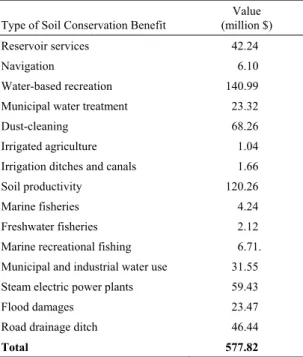
Table 3. CRP Benefits by Type
Type of Soil Conservation Benefit
Value (million $)
Reservoir services 42.24
Navigation 6.10
Water-based recreation 140.99
Municipal water treatment 23.32
Dust-cleaning 68.26
Irrigated agriculture 1.04
Irrigation ditches and canals 1.66
Soil productivity 120.26
Marine fisheries 4.24
Freshwater fisheries 2.12
Marine recreational fishing 6.71.
Municipal and industrial water use 31.55
Steam electric power plants 59.43
Flood damages 23.47
Road drainage ditch 46.44
Total 577.82
Note: Values are based on the benefit models and the average changes in soil erosion from scenarios 2 and 3. All values are reported in 2000 dollars.
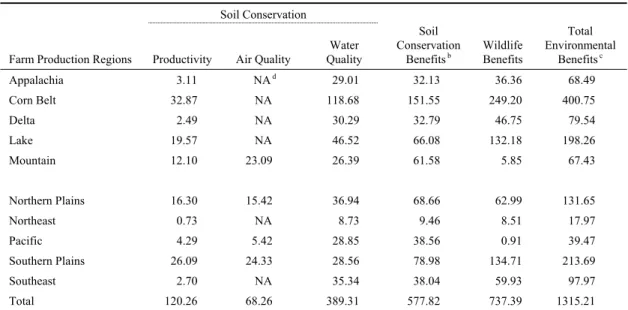
Table 4. Environmental Benefits of the CRP (million $ per yeara)
Soil Conservation
Farm Production Regions Productivity Air Quality
Water Quality
Soil Conservation
Benefitsb Wildlife Benefits
Total Environmental Benefitsc Appalachia 3.11 NAd 29.01 32.13 36.36 68.49 Corn Belt 32.87 NA 118.68 151.55 249.20 400.75 Delta 2.49 NA 30.29 32.79 46.75 79.54 Lake 19.57 NA 46.52 66.08 132.18 198.26 Mountain 12.10 23.09 26.39 61.58 5.85 67.43 Northern Plains 16.30 15.42 36.94 68.66 62.99 131.65 Northeast 0.73 NA 8.73 9.46 8.51 17.97 Pacific 4.29 5.42 28.85 38.56 0.91 39.47 Southern Plains 26.09 24.33 28.56 78.98 134.71 213.69 Southeast 2.70 NA 35.34 38.04 59.93 97.97 Total 120.26 68.26 389.31 577.82 737.39 1315.21
a All values are reported in 2000 dollars.
b Estimates are based on the average changes in soil erosion from scenarios 2 and 3.
c The estimates are totals from this analysis. Thus, many environmental benefits are not included. d NA = not available.
benefits are relatively high because wildlife is a positive part of many activities. Wildlife is neces-sary for some activities (i.e., bird watching, wild-life photography, etc.) and an important aspect of others (e.g., a drive through the country, picnick-ing, hikpicnick-ing, bicyclpicnick-ing, etc.).
At $87 million, the value of the improved pheasant hunting is about 12 percent of the esti-mated wildlife benefits. Unlike wildlife viewing, pheasant hunting is a single activity associated with one species and thus is not likely to affect as many people. Furthermore, in many states, pheas-ants are not a common game species. In others, pheasant populations are not constrained by a lack of suitable cover and are not affected by changes in CRP acreage. As a result, the pheasant-hunting model is applicable to lands in the Northern Plains, Corn Belt, and Lake regions, and in Montana (Han-sen, Feather, and Shank 1999).
The Southern Plains, Lake States, and Corn Belt regions account for approximately 70 percent of the CRP’s wildlife benefits. Although these regions have only 40 percent of the CRP acreage, benefits are high because the wildlife populations show a strong response to the CRP habitat and a large number of people live in the area and value the increased wildlife populations (Feather, Hel-lerstein, and Hansen 1999).
Total Benefits
The sum of the CRP’s soil conservation and wild-life benefit estimates, $1.32 billion per year (Ta-ble 4), is slightly higher than the $1.24 billion reported in Sullivan et al. (2004). The total bene-fit estimate is higher here because, first, it includes soil conservation’s benefit to irrigated agriculture, which was not included in the previous analysis, and second, the approaches used to estimate soil erosion changes differ.
Feather, Hellerstein, and Hansen (1999) esti-mated annual CRP benefits of $1.03 billion, in-cluding wildlife-related and water-based recrea-tion benefits. Their estimate is higher than the same set of benefits reported here, which is to be expected since they assumed that erosion would return to its 1982 level. Benefit estimates may also differ because their estimate is based on a projected distribution of CRP acreage, not the distribution observed in 1997.
Ribaudo (1989) and Ribaudo et al. (1989) esti-mated the CRP’s lifetime benefits, assuming the program was not reauthorized and 45 million acres were enrolled. They do not report their as-sumed enrollment pattern nor their mix of 10- and 15-year contracts. Their results are not compara-ble to the annual benefit estimates presented here.
CRP benefits in the Corn Belt are nearly twice those of the next highest region, the Southern Plains. Together, the Corn Belt, Lake, and South-ern Plains regions, which have about 35 percent of all CRP acreage, provide over 60 percent of the estimated environmental benefits. Although the Mountain and Northern Plains regions have 45 percent of the CRP acreage, they provide only 12 percent of the estimated benefits.
Annual CRP rental payments are usually be-tween $1.5 and $1.7 billion (U.S. Department of Agriculture 2006). The results of this analysis suggest that, while the estimated environmental benefits do not exceed costs, they are 75 to 85 percent of program costs—even though many environmental benefits have not been estimated. What’s more, the CRP also helps stabilize farm incomes and reduces the cost of other farm pro-grams (De La Torres Ugarre and Hellwinckel 2006).
The variation in per-acre environmental bene-fits reveals the importance of land selection (Fig-ure 5). In four regions (the Northeast, Lake, Ap-palachia, and Corn Belt), per-acre benefits are seven times the per-acre benefits in the Mountain region. A more comprehensive assessment of bene-fit estimates will change the size of the regional per-acre benefits and might change the regional variations.
Annual CRP rental rates also vary across re-gions, but less so than the estimated benefits (Fig-ure 5). Rental rates are lowest in the Northern Plains ($35) and highest in the Corn Belt ($67)— a pattern that is not inconsistent with the per-acre benefit estimates. As with benefits, the reported rental rates do not capture intra-regional varia-tions. For example, at the state level, per-acre rental rates are highest in Massachusetts, at $103, and lowest in Wyoming, at $27.
Results suggest that CRP enrollments in the Lake, Northeast, and Southeast regions, where per-acre benefits exceed costs by $25 to $40, are very beneficial (Figure 5). Conversely, results sug-gest that CRP enrollments in the Northern Plains and Mountain regions (regions with nearly half of all CRP acreage), where per-acre costs exceed the estimated benefits by $20 to $30, may not be an efficient allocation of funds. However, without a more comprehensive measure of benefits, one cannot conclude that CRP benefits do not exceed costs in any region.
Summary and Conclusions
This paper provides estimates of some of the en-vironmental benefits of the Conservation Reserve Program (CRP) and details the underlying meth-odology, assumptions, and data. The methodol-ogy improves upon the most recent work in two ways. First, this analysis tests the sensitivity of the benefit estimates to alternative assumptions on farmers’ use of CRP lands. And second, this analysis relaxes the assumption that CRP and non-CRP lands within the same region have the same inherent erodibility.
The result suggests but does not prove that the environmental benefits of the CRP exceed federal costs. Seventeen economic models, suitable to national agri-environmental policy analyses, are used to estimate the environmental benefits. Based on these models, the CRP provides over $1.3 billion per year in environmental benefits, which is 70 to 85 percent of the program’s cost. However, given the many environmental benefits that have not been estimated (additional erosion- and wildlife-related impacts, carbon sequestra-tion, effects of reductions in pesticides and nutri-ent loadings, etc.), results provide strong evidence that environmental benefits exceed program costs. Results also provide a perspective of the re-gional variation in program benefits and areas where contract benefits are likely to be greatest relative to cost. Total per-acre benefits are highest in the Corn Belt region, at $92, and lowest in the Mountain region, at $11. The per-acre benefit es-timates of the Northeast, Lake, Appalachia, and Corn Belt regions are seven times the Mountain region estimate. In a majority of the regions, per-acre benefits exceed costs; thus, increasing CRP acreage in these regions may be beneficial. How-ever, because not all CRP benefits have been measured, one cannot conclude that, in other re-gions, benefits do not justify cost.
A more comprehensive set of environmental benefit models and increases in the accuracy and geographic resolution of all benefit models will improve future agri-environmental policy analy-ses and could be used to improve the design of conservation programs. The $5.1 billion spent on USDA conservation programs in 2005 and its growth from $0.5 billion in 1985 suggests a strong and growing public interest in agriculture’s effect on the environment. As a result, the value
0 10 20 30 40 50 60 70 80 90 100 Appalachia Corn Belt Delta Lake Mountain Northern Plains Northeast Pacific Southern Plains Southeast $ per acre Benefits Rental rates
Figure 5. Average Annual Per-Acre CRP Rental Rates and Estimated Benefits
Note: Benefit estimates are derived from this analysis. The rental rates are from the August 2006 CRP summary data (U.S. De-partment of Agriculture 2006).
of environmental benefit models, suitable to na-tional analyses, is likely to increase over time. This research, to the extent possible, estimates the environmental benefits of the CRP. But any evaluation of the CRP should recognize that the program has additional benefits (i.e., reductions in loan deficiency payments, counter-cyclical pay-ments, and crop insurance) and costs (i.e., higher food prices) (De La Torre Ugarte and Hell-winckel 2006, Young and Osborn 1990) that are not considered here.
References
Claassen, R., L. Hansen, M. Peters, V. Breneman, M. Wein-berg, A. Cattaneo, P. Feather, D. Gadsby, D. Hellerstein, J. Hopkins, J. Johnston, M. Morehart, and M. Smith. 2001. “Agri-Environmental Policy at the Cross-Roads: Guideposts on a Changing Landscape.” Agricultural Economic Report (AER) No. 794, Economic Research Service, U.S. Depart-ment of Agriculture, Washington, D.C. Available at www. ers.usda.gov/publications/aer794/aer794.pdf.
De La Torre Ugarte, D., and C. Hellwinckel. 2006. “Analysis of the Economic Impacts on the Agricultural Sector of the Elimination of the Conservation Reserve Program.” Agri-cultural Policy Analysis Center, University of Tennessee,
Knoxville. Available at www.agpolicy.org/ppap/APAC-CRP-Report.pdf.
Dodson, C., R. McElroy, F. Gale, K. Hanson, and T. Carlin. 1994. “Gauging Economic Impacts as CRP Contracts Ex-pire.” In Agricultural Outlook (No. AO-211), Economic Research Service, U.S. Department of Agriculture, Wash-ington, D.C.
Feather, P., D. Hellerstein, and L. Hansen. 1999. “Economic Valuation of Environmental Benefits and the Targeting of Conservation Programs: The Case of the CRP.” Agricul-tural Economic Report (AER) No. 778, Economic Research Service, U.S. Department of Agriculture, Washington, D.C. Available at www.ers.usda.gov/publications/aer778/aer778. pdf.
Hansen, L. 2006. “Models of Soil Conservation Benefits: The Sum of Some of the Benefits.” In K. Moultner, ed., Western Regional Research Publication: W133 Benefits and Costs of Public Resource Policies. Available at www.ag.unr.edu/ moeltner/w1133_s_antonio/W1133%20San%20Antonio[-] %20Proceedings.pdf.
Hansen, L., P. Feather, and D. Shank. 1999. “Valuation of Agriculture’s Multi-Site Environmental Impacts.”
Agricul-tural and Resource Economics Review 28(2): 199–207.
Leathers, N., and L. Harrington. 2000. “Effectiveness of Con-servation Reserve Programs and Land ‘Slippage’ in South-western Kansas.” Professional Geographer 52(1): 83–93.
Love, H., and W. Foster. 1990. “Commodity Program Slip-page Rates for Corn and Wheat.” Western Journal of Agri-cultural Economics 15(2): 272–281.
Osborn, C., M. Schnepf, and R. Keim. 1994. Future Use of Conservation Reserve Program Acres: A National Survey
of Farm Owners and Operators. Soil and Water
Conserva-tion Society, Ankeny, Iowa.
Reynard, K., G. Foster, D. Yoder, and D. McCool. 1994. “RUSLE Revisited: Status, Questions, Answers, and the Future.” Journal of Soil and Water Conservation 49(3): 213–220.
Ribaudo, M. 1989. “Water Quality Benefits from the Conser-vation Reserve Program.” Agricultural Economic Report (AER) No. 606, Economic Research Service, U.S. Depart-ment of Agriculture, Washington, D.C.
Ribaudo, M., S. Piper, G. Schaible, L. Langner, and D. Co-lacicco. 1989. “CRP: What Economic Benefits?” Journal of Soil and Water Conservation 45(5): 421–424.
Roberts, M., and R. Lubowski. 2006. “Enduring Impacts of Land Retirement Policies: Evidence from the Conservation Reserve Program.” Land Economics 84(4) (forthcoming). Sullivan, P., D. Hellerstein, L. Hansen, R. Johansson, S.
Koenig, R. Lubowski, W. McBride, D. McGranahan, M. Roberts, S. Vogel, and S. Bucholtz. 2004. “The Conserva-tion Reserve Program: Economic ImplicaConserva-tions for Rural
America.” Agricultural Economic Report (AER) No. 834, Economic Research Service, U.S. Department of Agricul-ture, Washington, D.C. Available at www.ers.usda.gov/pub[-] lications/aer834/aer834.pdf.
U.S. Department of Agriculture. 2000. National Resources Inventory. Natural Resources Conservation Service (NRCS), U.S. Department of Agriculture, Washington, D.C. Avail-able at www.nhq.nrcs.usda.gov/NRI/1997/.
____. 2006. “Conservation Reserve Program: Enrollment Statistics and Program Summary—2005 Fiscal Year.” Farm Services Agency (FSA), U.S. Department of Agriculture, Washington, D.C. Available at www.fsa.usda.gov/Internet/ FSA_File/fy2005.pdf.
Woodruff, N.P., and F.H. Siddaway. 1965. “A Wind Erosion Equation.” Soil Science Society of America Proceedings 29(5): 602–608.
Young, C.E., and C.T. Osborn. 1990. “The Conservation Re-serve Program: An Economic Assessment.” Agricultural Economic Report (AER) No. 626, Economic Research Ser-vice, U.S. Department of Agriculture.