The RIM Professionals Australasia awarded the Research and Education Grant 2010/2011 to
Michelle Linton (Linked Training) and Kevin Dwyer (Change Factory) for their study of training,
change management strategy and techniques used when implementing an EDRMS, their impact
on uptake of the EDRMS and the level of recordkeeping maturity achieved. This report provides
a summary of a comprehensive survey of over 60 questions that took on average 35 minutes
to complete. It explores a wide range of elements in a wide range of projects uncovering some
surprises to achieving success.
Record management business units have embraced EDRMS software, but the capture of all records requires a model of devolved recordkeeping practiced by all staff in an organisation. Achieving the behavioural change required for adoption by all staff has proven difficult for the majority of organisations. Linked Training and Change Factory work directly with a diverse range of organisations implementing an EDRMS. We are undertaking a two year research project to bring clarity based on
industry data to what makes an EDRMS implementation successful. In particular we’ve focused on the non-software aspect of the projects; identifying the training and change elements that improve success.
This report provides a summary of the first stage of our research; discovery of the elements of success. The second stage will research exactly how these elements were utilised within successful projects and what are appropriate measures of success.
The survey was comprehensive. There were over 60 questions that took on average 35 minutes to complete. We felt it was important that we did not focus on elements we may have been able to predict as success factors, based on our experience. We explored other elements to discover if, in a wider range of projects than we had personally experienced, there were any hidden surprises to achieving success. This report does not provide the analysis of every question asked and is limited to the responses that improve success.
EDRMS SUCCESS
Experience the Difference
0% 5% 10% 15% 20% 25% 30% 35% 40% >20000 <20000 <10000 <5000 <1000 <500 <200 0% 5% 10% 15% 20% 25% Log istics M anufac tur ing Primar y I ndustr y Elec tr icit y, G as , W ater and W ast e S er vic es Educa tion and Training O ther Ser vic es Local G ov er nmen t Feder al/S ta te G ov er nmen t 0% 5% 10% 15% 20% 25% 30% Regional Capital City Other NZ NT ACT TAS WA QLD VIC NSW
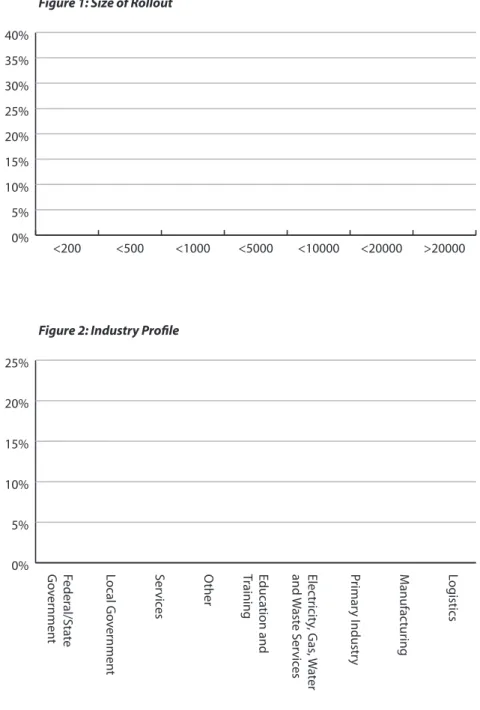
Figure 1: Size of Rollout
Figure 2: Industry Profile
Figure 3: Distribution of Respondents
The survey was distributed via RIM Professionals Australasia to members, through Linked Training and Change Factory own networks of RIM contacts, and via record management, EDRMS, and IT LinkedIn groups.
In order to complete all questions in the survey the respondent’s EDRMS had to have been implemented and end user training completed. Many projects do not reach implementation and these have not been included in the survey results, as the focus is on training and change elements. 107 organisations completed the survey.
DEMOGRAPHICS
Who are the organisations providing the data? Are they a true cross section of the industry? They certainly are. The majority of respondents were from organisations implementing an EDRMS to less than 500 staff. The weighting towards smaller organisations is due to those organisations being more likely to complete an implementation.
Organisations in Australia with over 500 EDRMS users are mainly State and Federal Government departments. Many have commenced, but not completed implementations. The delaying effect on a project of Departmental restructuring during political change is one of the many factors causing implementation to be incomplete in those organisations.
We asked respondents “In your view did your project fail in reaching its objectives: Yes or No?” 75% of respondents who had completed an implementation rated their EDRMS project a success.
Therefore 25% believed their project had failed. Our data analysis concentrates on those elements that increase a project’s success above the average of 75% or decreases it well below 75%.
75%
75% of respondents
who had completed an
implementation rated
their EDRMS project a
success.
PLANNING
Putting the right framework in place is the first step to success. There was very little surprise to discover a few simple facts:
Larger training & change budgets = greater success rates. These organisations will have engaged a higher level of expertise in the project team, and provided more resources in their training strategy. A previous history of EDRMS attempts = greater success rates Organisations do learn from past experience. This is an important message for records staff fatigued and negative in attitude due to previous project
failure; the follow-on attempt at an EDRMS rollout has a success rate of 83%, 8% above the average. Mature recordkeeping practices pre-implementation = greater success rates.
Those organisations with well-established practices in document management were more successful in converting to EDRMS. That’s not a surprise. The end user behaviour in regard to record responsibility, managing the life cycle of a record and using the language of record management will be established to some degree, and so increasing that knowledge and changing behaviour is not so difficult. 0% 10% 20% 30% 40% 50% 60% 70% 80% 90% 100% Project Success Included in Strategy Close Shar ed Dr iv e Independen t Ex ter nal C onsultan ts Pilot EDRMS Vendor Consultan ts Change Communica tions Training
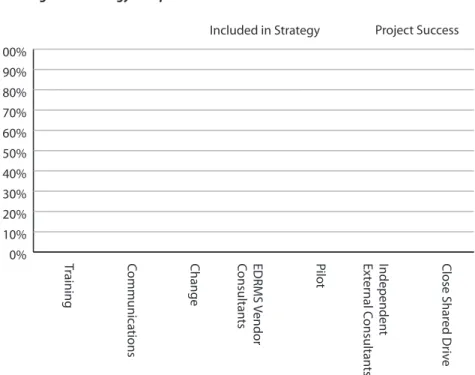
Figure 4: Strategy Components Effectiveness
The survey asked, “Did your project plan include …” the strategy components listed in Figure 4. The left bar displays the percentage of respondents who included that component in their overall strategy. The right bar displays the success rate of projects with that strategy component.
Intention to close the shared drive increased the success rate to 92.9%, a 24% increase over the average success rate, yet only 23.3% of projects planned to. Of the other elements, the inclusion of Change or Independent External Consultants increased the chance of success by 11% over the average rate.
In Figure 5, 6 and 7 we looked closely at the project team and skill set. We asked which roles were represented in the project team. One person may have covered multiple roles (e.g. act as both the project manager and record manager). The core roles identified were project manager, record manager and an IT person. Those projects where the IT person was a manager achieved a success rate of 82%, which can be attributed to having a more skilled person on the team, and a person who has more influence. Notably the addition of a change
manager and a business representative to the team improved success to 86%(15% increase) and 93% (24% increase) respectively. Yet these roles were poorly represented across the respondents. It particular it is disappointing to see that input from staff in the business units, which whilst often challenging to manage, does not require increased
budget by the organisation and yet was used by only 23% of responding organisations.. Building support from the business is an important part of the overall change process that can be developed from the project outset. Executive level managers led only 10% of projects, but their influence led to a success rate of 100%.
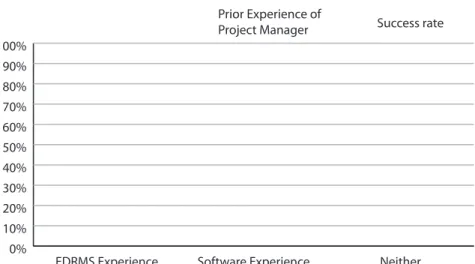
The impact on the prior experience of the project manager is one of the more significant findings of the survey. Typically organisations appointed project managers with EDRMS rollout experience or software rollout experience. They steered away from appointing project managers with no rollout experience. Those with EDRMS experience were highly successful (92% success rate), closely followed by those with no
experience (84.6%). Prior software roll-out experience was in fact a detriment to the project, having a success rate of only 50%; well below average.
Prior software roll-out
experience was in fact a
detriment to the project,
having a success rate of
only 50%; well below
average.
0% 10% 20% 30% 40% 50% 60% 70% 80% 90% 100% Success rate Who's the BossExecutive Manager Records Manager External Project Manager Internal Project Manager
Figure 6: Impact of Lead Position on Effectiveness
0% 10% 20% 30% 40% 50% 60% 70% 80% 90% 100% Success rate Prior Experience of Project Manager Neither Software Experience EDRMS Experience
Figure 7: Prior Rollout Experience of Project Manager
0% 10% 20% 30% 40% 50% 60% 70% 80% 90% 100% Project Success Team Composition Business Repr esen ta tiv e L&D/T raining M anager Change M anager EDRMS M anager IT M anager IT P erson Rec or d manager Projec t M anager
An EDRMS is different. Users can, and will, avoid using the EDRMS where possible as it does require them to learn a new approach to information storage. If the
project manager just expects to run an EDRMS project like any other software project then they are less likely to have also enhanced the configuration for Project managers with an IT rollout
background bring to the project bias of previous experience concerning: 1. Standard practice in implementation of software – typically in an IT project implementation would be limited to ensuring it is installed and operational on end users computers.
2. Options in using software - standard organisation wide software rollouts are systems like Microsoft Office, HR Systems (Ellipys) or Financial Systems (SAP). Once implemented end users have no choice but to use the software. After all you can’t apply for leave or access your pay advice anywhere but the new system. If an invoice is to be paid it must be in the SAP system. End users might complain bitterly, and frequently are very poor users of the software, but 100% of staff will be active users.
An EDRMS is different.
Users can, and will,
avoid using the EDRMS
where possible as it
does require them to
learn a new approach to
information storage.
their users, or planned an effective communications, change and training strategy, because the investment is not seen as necessary. Therefore this leads to a higher than average rate of failure. A person with no experience will be more open to learning from the team around them, and not fall into the misconception trap. They’ll expect the project to be tough and will be comprehensive in addressing all the elements that lead to failure.
Most importantly organisations need to re-evaluate the benefits of prior experience and include the beliefs that prior experience may bring with it. Some of them are obviously detrimental to EDRMS projects. They are not just software implementation.
0% 10% 20% 30% 40% 50% 60% 70% 80% 90% 100%
Disbelieve Success rate Believe Success rate
Necessary for Compliance Change Management is important Will reduce Risk Importance of RM Training Will improve Productivity
Figure 8: Impact of Sponsors Beliefs
0% 10% 20% 30% 40% 50% 60% 70% 80% 90% 100%
Disbelieve Success rate Believe Success rate
Have Authority to Implement Good
for Them They have Skills
& Knowledge Good for
Organisation Good Practices
will be Rewarded
Figure 9: Importance of Stakeholders Beliefs
ENGAGE
The beliefs that a sponsor holds about expected inputs and outputs of an EDRMS implementation has a strong correlation with project success. In all circumstances belief by sponsors correlates with higher than average project success, whilst disbelief
dramatically lowers project success rates. Notably, although compliance was cited as the most important reason for implementing an EDRMS solution (33.9% of respondents), sponsor’s belief in achieving this only correlated with marginally above average success rates(77%).
Sponsor’s beliefs in relation to productivity tell the most compelling story. A significant proportion of respondents (22%) believed that improving productivity was the most important reason for implementing an EDRMS.
When sponsors believed that an EDRMS will improve productivity too, success rates increased to 89%, an 18.7% increase. More important than that though is that those projects who had sponsors who disbelieved that productivity was important correlated with a success rate of ZERO.
Educating sponsors to believe that an EDRMS implementation will result in improved productivity for the business and reduce business risks has a significant effect on your chance of success and failure.
The belief that stakeholders have about the impact of an EDRMS rollout on themselves and the organisation also has a significant effect on the success of a project. All beliefs we measured
correlated with a higher than average success rate when they were held by the stakeholders, however, the belief that good recordkeeping practices will be rewarded has the largest impact with a 94% success rate, a 25% increase over the average.
Sponsors who
disbelieved that
productivity was
important correlated
with a success rate of
ZERO.
Communication
The importance of a well-planned Communication strategy was evident in the survey results. The success rate of organisations that did not have a communications strategy was a lowly 17%.
Just as important was the answer to the question “Did you have a defined Communications Goal?” Those respondents that answered ‘Yes’,
achieved a 90% success rate, whilst those who did not only achieved 39%.
We analysed the types of
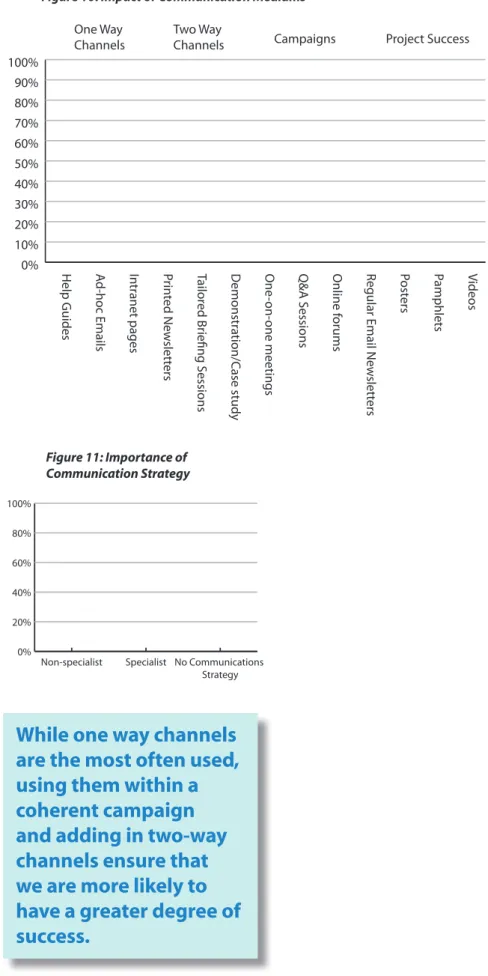
communications mediums used and their impact on success. Respondents typically used multiple means of communicating, which we’ve grouped into three different types of communication mediums:
One way channels. 1.
These were the most popular. They do not necessarily form part of a campaign. These channels include Help guides, ad-hoc emails intranet pages and printed newsletters. Whilst effective enough to support the average rate of success, they are not the most effective communication channels.
Two way channels. 2.
They include tailored briefing sessions, demonstrations and case studies, one-one meetings, Q&A sessions and on-line forums. While used by less than 50% of all rollouts this type of communication supports a significantly higher rate of success (81-100%).
Campaigns. 3.
Channels which are typically used in campaigns including regular email newsletters, posters, pamphlets and video. They are used in even less frequently and yet they too have a higher degree of success than one-way channels (82-100%).
The implications here are plain. While one way channels are the most often used, using them within a coherent campaign and adding in two-way channels ensure that we are more likely to have a greater degree of success.
0% 20% 40% 60% 80% 100% No Communications Strategy Specialist Non-specialist Figure 11: Importance of Communication Strategy 0% 10% 20% 30% 40% 50% 60% 70% 80% 90% 100% Project Success Campaigns One Way
Channels Two Way Channels
Videos
Pamphlets
Post
ers
Regular Email New
slett ers Online f orums Q&A S essions One -on-one meetings D emonstr ation/C ase study Tailor ed Br iefing S essions Prin ted New slett ers In tr anet pages Ad-hoc Emails Help Guides
Figure 10: Impact of Communication Mediums
While one way channels
are the most often used,
using them within a
coherent campaign
and adding in two-way
channels ensure that
we are more likely to
have a greater degree of
success.
TRAINING
Training delivery can be a large part of an EDRMS project budget, and stories abound of low impact training and budget blow outs from retraining. What impact does the structure, elements and quality of training have on EDRMS project success? And how can you increase the success of a project without major investment of dollars and time in more training? It turns out to be easier than expected.
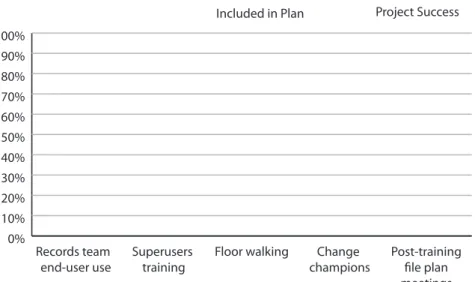
The first significant find was that segmentation of training was much more successful than non-segmented training. It was pleasing to see the majority of respondents used a segmented program where some participants received more advanced training, or training tailored to their business needs. It supports the theory that provision of the required level to meet immediate end user needs maximises retention of knowledge and transfer of skills to performance. We asked respondents which of the following training components (beyond face to face end user training) were included in their project plan:
• Training for the Records Management
team on end-user use?
• Extra training for Superusers? • Post-training floor walking? • Change champions responsible for
business process change?
• Post-training file plan meetings
between business unit and record team
Although the inclusion of each of these had a positive impact on the average success rate, the most popular training, providing the Records team with end user training, contributed least value to lifting the success rate. Records teams, in general, seem to have difficulty in truly comprehending the end user requirements, and there appears to be a reluctance to understand them.
Respondents that included the last 3 components clearly were rewarded with higher than average success rates (Figure 13). Each of the latter components involves a high level of engagement
with the business; they connect the generalised training that will have been received back to business unit use and needs.
The last component, post-training file plan meetings, is sadly under used, and yet the most effective. It is time consuming, but there are a couple of keys:
• Train and use Superusers to drive
and manage the file plans for their business unit, and
0% 10% 20% 30% 40% 50% 60% 70% 80% 90% 100% Project Success Included in Plan Post-training file plan meetings Change champions Floor walking Superusers training Records team end-user use
Figure 13: Components of a Training Plan
0% 20% 40% 60% 80% 100% Success Rate Training Delivery No Segmentation Segmentation
Figure 12: Segmentation of Training
• Develop a structured approach and
framework for file planning – an uncomplicated map that provides guidance, but enables business units to make decisions around their unique records.
Whilst floorwalking is generally a check on technical skills, file planning cements the recordkeeping knowledge and provides a quality assurance check when moving to a devolved model with an EDRMS.
We asked “Which of the following were included in your model of training for users?”
• Half day or less of classroom training
with hands-on use of the software.
• Full day or more of classroom training
with hands-on use of the software.
• Distribution of training manuals and/
or quick guides.
• Intranet resources (quick guides, help
cards, FAQ’s, forums),
• Face-to-face training that did not
involve hands-on use of the software package.
• ELearning training courses.
We know that 100% of the respondents used hands on classroom training, with only 23% delivering a full day of training. A full day of training is consumes both time and budget, but does provide a higher rate of success.
Take a look at the last four methods of delivery. These were all used in conjunction to the hands-on training. They were not the sole method of training. All of them lifted the success rate above average, with the presentation training having notably the lowest rate of the four. If we look at the other three, training manuals, intranet resources and eLearning, there is a common element. All three provided
0% 10% 20% 30% 40% 50% 60% 70% 80% 90% 100% Success Rate Training Inclusions eLearning Presentation training Intranet Resources Training manuals/ quick guides Full day hands-on training Half day hands-on training
Figure 14: End User Training Modes
0% 10% 20% 30% 40% 50% 60% 70% 80% 90% 100% Success rate No Training Experience No EDRMS Experience Training Experience EDRMS Experience
Figure 15: Impact of Prior Experience of Trainer
the end user with access to help and training at the point of need. If people have a problem they can find “how to” then and there. People who solve their own problems remember the actions better than when told. Their confidence increases and they become more independent users of a system. Providing 24/7 accessible additional training resources is an investment,
People who solve
their own problems
remember the actions
better than when
told. Their confidence
increases and they
become more
independent users of a
system.
but it’s a much more cost effective approach than full day training for most organisations and will give you the same success rate. The investment in these also has a long lifetime, whereas the full day of training is over and done with once the rollout is complete. At the very least you should be providing each end user with a quality training manual.
The simple message
is; trainers must have
previous training
delivery experience or
you place the project at
extreme risk of failure.
The survey revealed that choice of trainers is a critical element. 86% of organisations did use trainers who had previous training delivery experience. Those organisations that delivered their training with unskilled trainers were only 14%, and they put their project under great risk with a resounding failure rate of 86%.
When we look at the importance of EDRMS experience we can see that having experience has a greater impact on success than the training experience
did, lifting the success rate up to 86%, but a lack of EDRMS experience is not so completely detrimental to the project. It does however lower the success rate to 50%.
The simple message is; trainers must have previous training delivery experience or you place the project at extreme risk of failure. Adding EDRMS experience will increase your success rate, but only if they are experienced in delivery.
EMBED
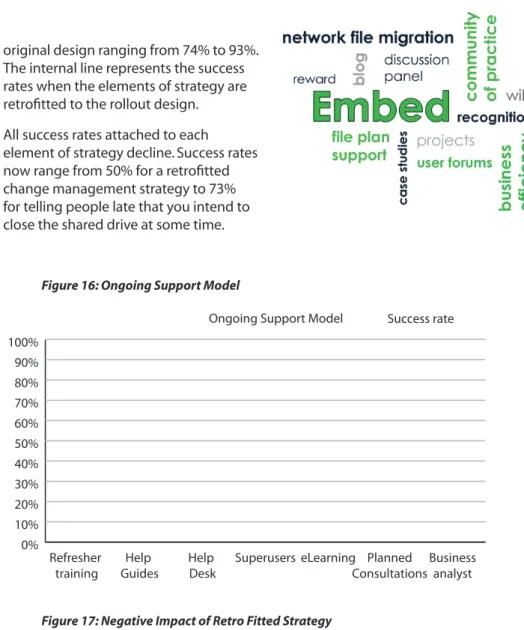
Respondents were asked in this survey what ongoing support they provided to help embed the use of the EDRMS in the way intended.
More than 60% of respondents used refresher training and/or help guides. Success rates for these organisations ranged from 79% to 83%.One could categorise these elements as offering a fixed set of services to the end user. The training is fixed as are the help guides. Consultations with end user groups and the provision of business analysts are at the other end of the scale offering tailored services for end users within a business unit. Although much less frequently used at 20% and 15% of respondents respectively, they are associated with much higher success rates of 92% and 90%.
This confirms other trends we have seen. The more the business is engaged; be it in planning before implementation, during implementation, or after implementation, the higher the success rate.
You may recall that some elements of strategy had a greater impact than others on the likelihood of success of the project. Elements such as closing the shared drive, having a formal change management strategy and using external consultants not tied to the vendor implied greater chances of project success.
What then, you may ask is the impact of introducing some of these strategic elements after the project has commenced implementation? Does it make a difference if you retro-fit strategy compared with organisations who had the strategies in their initial design? The external line of this spider web diagram shows the project success rate for each element if incorporated in the
0% 10% 20% 30% 40% 50% 60% 70% 80% 90% 100% Success rate Ongoing Support Model
Business analyst Planned Consultations eLearning Superusers Help Desk Help Guides Refresher training
Figure 16: Ongoing Support Model
10% 20% 30% 40% 50% 60% 70% 80% 90% 100% Success if Post Success if Prior A Formal Training Strategy External Consultants supplied by the Vendor A Formal Communication Strategy A Pilot Programme Closing Access to the Shared Drive External Consultants (independent of the system vendor) A Formal Change
Management Strategy
Figure 17: Negative Impact of Retro Fitted Strategy
original design ranging from 74% to 93%. The internal line represents the success rates when the elements of strategy are retrofitted to the rollout design. All success rates attached to each element of strategy decline. Success rates now range from 50% for a retrofitted change management strategy to 73% for telling people late that you intend to close the shared drive at some time.
MEASURE
The adage “What gets measured gets done” applies to EDRMS roll outs too. Eighty percent of organisations who measured their progress reported a successful project compared with sixty-four percent for those who did not. The measures used included the level of recordkeeping knowledge, the number of active users and the number of active creators. It did seem to matter too much what was measured, what was important was that something was measured. We suspect it is the signal of being serious about the outcome of the roll-out not just the completion of the roll-out that measuring sends is what drives the change in behaviours which drives the change in outcomes. We will follow up this point more closely when we come to the qualitative analysis of this study.
Figure 18: Impact of Measurement on Success
80%
success for those
who measure
64%
success for those
who don’t
KEY RESULTS
1. Experience makes a difference
Whether it be EDRMS roll experience for the Project Manager, previous rollout experience for the organisation, mature recordkeeping experience for the end users, or utilising trainers with EDRMS and training experience it is important to
recognise the impact of experience on your project. Even more important is the impact of a lack of experience. You can’t always acquire the preferred experience, but you can plan how to minimise the impact it will have on project success.
2. Disbelief foretells doom
It’s clear belief foretells success in both sponsors and stakeholders. Critically, when actual disbelief exists this can spell the death toll for a project. The change and training program must dispel disbelief in sponsors and stakeholders before a major rollout if the project is to achieve success.
5. Have purpose; design in detail
A project must have a clear purpose in every action taken. Know the outcomes you need to achieve through project team skillsets, communication, training, EDRMS benefits, and record keeping practice. Then create a detailed framework of training and change management to make to your EDRMS implementation an unmitigated success.
3. Success demands business involvement
At all points of a project rollout any initiatives that increase participation, engagement and communication between the business and the project team had a major positive effect of success rates. Involving business representatives in planning, working together on file plans, and listening to each other will increase success.
4. User options underpin success
One size does not fit all. Differentiated training that is segmented for user needs and provides access to different modes of learning, backed by a differentiated support model provides excellence in results.
KEVIN DWYER
Kevin Dwyer is a Change Management professional with more than 30 years experience in the planning, design and delivery of change management programs. Since the establishment of Change Factory in 2001 he has been involved in a diverse range of projects ranging from re-engineering processes to reduce risk to creating and revising performance management systems. He commenced working in EDRMS projects in 2009 as a partner in the REX project which was awarded the J.Eddis Linton Award for Excellence – Most Outstanding Group in 2010.
Kevin can be contacted on:
0408 508 490 or [email protected] www.ChangeFactory.com.au
MICHELLE LINTON
Michelle Linton is a Learning & Development Manager with 24 years’ experience in the planning, design and delivery of training programs. Michelle has developed and delivered innovative, outcome focused EDRMS training for over 30 government and private organisations since 2005. Michelle’s pragmatic approach to learning has been enthusiastically welcomed by the Industry. Linked Training is the training partner in the REX project which was awarded the J.Eddis Linton Award for Excellence – Most Outstanding Group in 2010.
Michelle can be contacted on:
02 8824 4877 or [email protected] www.LinkedTraining.com.au