Effect of Mode of Delivery on the Incidence
of Urinary Incontinence in Primiparous
Women
Sarah Hamilton Boyles,
MD,
MPH, Hong Li,
MSPH, Tomi Mori,
PhD,
Patricia Osterweil,
BS, and Jeanne-Marie Guise,
MD,
MPHOBJECTIVE: To estimate the effect of mode of delivery on the incidence of urinary incontinence in primiparous women.
METHODS: A population-based survey was mailed to all Oregon women who delivered a liveborn neonate in a 1-year period. Data were collected on urinary inconti-nence, childbirth experience, and other risk factors for incontinence at 3– 6 months postpartum. Univariable analyses were conducted using t tests and Wilcoxon rank-sum tests for continuous variables and 2
tests for categorical variables. Logistic regression analyses were used to estimate odds ratios and 95% confidence inter-vals for demographic and clinical risk factors.
RESULTS: A total of 15,787 women completed the sur-vey, for a response rate of 39%. Of these women, 5,599 were primiparous, completed the survey in the desired timeframe, submitted information on their urinary conti-nence, and did not have incontinence before pregnancy. A total of 955 (17.1%) reported leakage of urine. Women who had vaginal deliveries were more likely to have urinary incontinence than women who had cesarean deliveries (odds ratio 4.96 [95% confidence interval 3.82– 6.44],P<.001). This risk increased with assisted delivery and perineal laceration. No statistical difference in the incidence of urinary incontinence was found among
women who had elective cesarean deliveries (6.1%), women who had cesarean deliveries after laboring (5.7%), and women who had cesarean deliveries after laboring and pushing (6.4%).
CONCLUSION: Urinary incontinence is common in the immediate postpartum period after a woman’s first preg-nancy. Although vaginal delivery increases the risk of urinary incontinence, labor and pushing alone without vaginal delivery do not appear to increase this risk significantly.
(Obstet Gynecol 2009;113:134–41)
LEVEL OF EVIDENCE: II
I
t is well established that parity increases the risk of urinary incontinence in premenopausal women.1,2The first delivery has the largest effect on the conti-nence mechanism; subsequent deliveries have a mea-surable, but smaller, effect. Less well established is the effect of mode of delivery on postpartum urinary incontinence.
Both those women who have had only vaginal deliveries and those who have had only cesarean deliveries have a higher risk of urinary incontinence than do nulliparous women.3 When compared with
vaginal delivery, cesarean delivery is associated with a protective effect against urinary incontinence.3–10
Rortveit et al demonstrated that 35% of urinary incontinence among women who delivered vaginally would be prevented if cesarean deliveries were per-formed exclusively.3 This protection against urinary
incontinence appears to dissipate as a woman ages10
because parity and incontinence are not associated in women older than 65 years.2The benefit of a cesarean
delivery performed before labor compared with a cesarean delivery performed in the first or second stage of labor is not known. Previous work in this area is conflicting and limited by small sample size.3,5,11,12
The effect of assisted delivery on urinary incontinence
From the Providence Women and Children’s Health Research Center, Providence Health and Services, Portland, Oregon; and the Department of Public Health and Preventive Medicine, the Department of Obstetrics and Gynecology, and Medical Informatics and Clinical Epidemiology, Oregon Health & Science University, Portland, Oregon.
Supported by the Eunice Kennedy Shriver National Institute of Child Health and Human Development (R01 HD41139-04).
Corresponding author: Sarah Hamilton Boyles, MD, MPH, Providence Women and Children’s Health Research Center, 5600 NE Glisan, Suite A, Portland, OR 97213; e-mail: [email protected].
Financial Disclosure
The authors did not report any potential conflicts of interest.
© 2008 by The American College of Obstetricians and Gynecologists. Published by Lippincott Williams & Wilkins.
is similarly limited.5,12Secondary analyses of the trial
demonstrated that antenatal urinary incontinence, elevated body mass index (BMI), less education, and vaginal delivery were all risk factors for postpartum urinary incontinence.9
Our goal is to estimate the effect of mode of delivery on the incidence of postpartum urinary incontinence in primiparous women in the 3– 6 months after delivery.
MATERIALS AND METHODS
The Fecal Incontinence Postpartum Research Initia-tive is a population-based study of all women deliv-ering liveborn neonates in the 1-year period between October 2002 and September 2003 in the state of Oregon; the study has been described previously.13
Women were mailed a survey with the primary intent of assessing the incidence of fecal incontinence shortly after childbirth. The survey was to be com-pleted in the 3 to 6 months after delivery. Data were collected on urinary incontinence, childbirth experi-ence, and other demographic, medical, and lifestyle risk factors for incontinence. Women were asked whether they experienced “leakage of urine” in a list of medical conditions and whether this leakage oc-curred before pregnancy, during pregnancy, after pregnancy, or any combination of these categories. Women were asked how to best describe their deliv-ery. Options included, “cesarean after labor and pushing,” “cesarean after labor, never pushed,” and “cesarean, never labored.” Women also were asked whether they “had any repair of cuts or tears with this delivery” and whether the “cut or tear went through the anus.”
Approximately 40,000 women deliver babies in the state of Oregon each year. Eligible women were identified through Oregon state birth certificates. Women having abortions, stillbirths, or adoptions, out of state residents, and women for whom identifiers were missing were not eligible for the study. Surveys contained unique identifiers rather than personal identifiers to maintain anonymity. Institutional review board approval was obtained from both Oregon Health & Science University and the Department of Human Services, Health Services, Multnomah County, Oregon. Eligible individuals were sent study materials, including a cover letter, questionnaire, and self-addressed, stamped envelope. English-language packets were sent to all individuals, and those who indicated having Hispanic ethnicity on birth certifi-cates also were sent Spanish-language packets. The sequence of correspondence involved: 1) initial mail questionnaire packet sent, 2) a “tickler” sent 7–10
days after the questionnaire packet as a reminder/ thank you note, and 3) a second mail questionnaire packet sent 7–14 days after the tickler to those who had not yet responded. All women were instructed to complete the enclosed two-page, 30-question survey. No compensation was provided. The questionnaire was designed using Teleform 8.2 (Cardiff Software Inc., Vista, CA). Results were read electronically and then verified by a reviewer before analysis.
Only primiparous women were included in this analysis. Women were excluded if they did not complete the urinary incontinence questions, if the survey was returned outside of the desired timeframe, and if they experienced urinary incontinence before their pregnancies. The data were analyzed using SAS 9.1(SAS Institute Inc., Cary, NC). The incidence of urinary incontinence was calculated as a percentage of all respondents who indicated inability to control symptoms of urinary incontinence in the postpartum period.
Continuous variables were tested for normality using a Kolmogorov-Smirnov test. Push time had a skewed distribution and was modeled as a categorical variable based on its quartile distribution. Univariable analyses were performed byt test or Wilcoxon rank test (continuous variables) and2test or simple
logis-tic regression (categorical variables). Multivariable analyses were stratified by the type of delivery be-cause of the differences in the vaginal and cesarean populations. Independent predictors of postpartum urinary incontinence were identified by a stepwise multivariable logistic regression analysis. Adjusted odds ratios (ORs) and 95% confidence intervals (CIs) for having urinary incontinence after the first child-birth were based on the maximum-likelihood method of multiple logistic regression. Missing variables in the analysis were 6% or less. Data on fecal incontinence are presented elsewhere.14
RESULTS
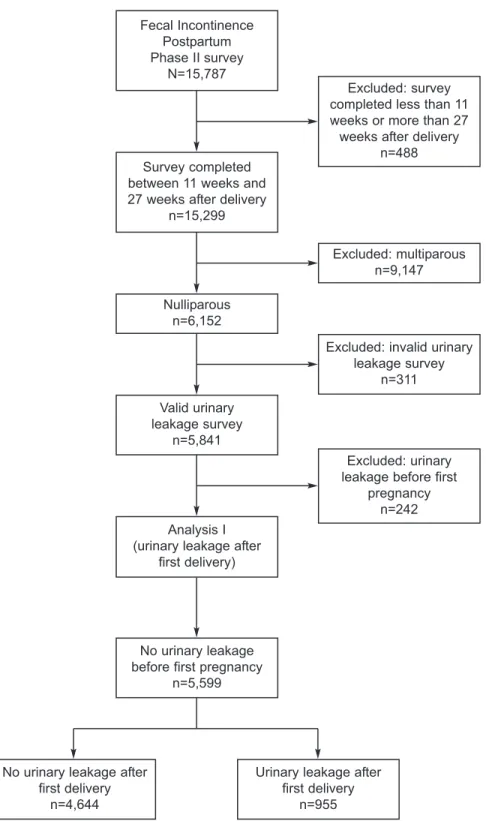
A total of 15,787 women completed the survey, for a response rate of 39%. Of these women, 5,841 were primiparous, completed the survey in the desired timeframe, and submitted information on their uri-nary continence. Two hundred forty-two women were excluded because they reported urinary incon-tinence before pregnancy. The final analysis set in-cluded 5,599 women (Fig. 1). The average interval between delivery and completion of the survey was 4.4 months (range 3– 6 months) for all women.
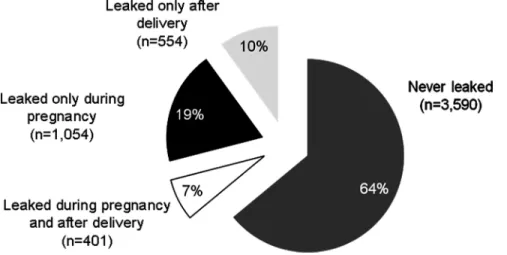
The distribution of urinary incontinence in this population is shown in Figure 2. Of the women who experienced urinary incontinence during pregnancy,
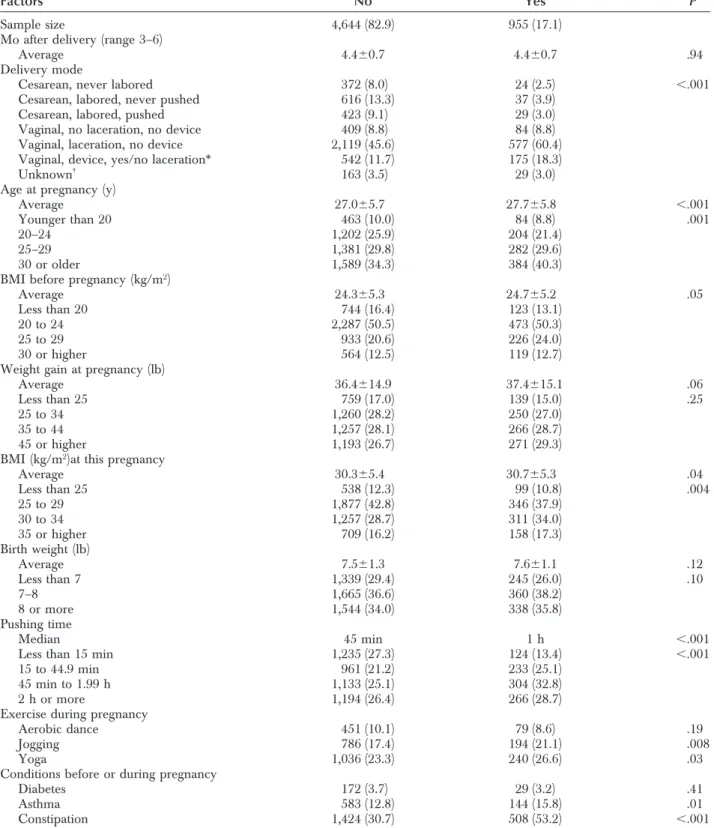
72.4% had symptom resolution after delivery. Women who leaked urine in the postpartum period were more likely to have delivered vaginally than women who never leaked or leaked only during pregnancy (Fig. 3). Overall demographics are pre-sented in Table 1. The cesarean delivery rate of this
population was 27.6%; 7.1% of these women did not experience labor. Nine hundred fifty-five women (17.1%) reported leakage of urine 3– 6 months after first delivery. Women who leaked urine after delivery were more likely to be older (average 27.7 years compared with 27 years,P⬍.001) and heavier (BMI Fecal Incontinence
Postpartum Phase II survey
N=15,787
Excluded: survey completed less than 11 weeks or more than 27 weeks after delivery
n=488 Survey completed
between 11 weeks and 27 weeks after delivery
n=15,299 Nulliparous n=6,152 Excluded: multiparous n=9,147 Valid urinary leakage survey n=5,841
Excluded: invalid urinary leakage survey
n=311
Analysis I (urinary leakage after
first delivery)
No urinary leakage before first pregnancy
n=5,599
Excluded: urinary leakage before first
pregnancy n=242
No urinary leakage after first delivery
n=4,644
Urinary leakage after first delivery
n=955
Fig. 1. Flow chart of analysis of urinary leakage after first delivery. Hamilton Boyles. Labor and Pushing Do Not Affect UI Risk. Obstet Gynecol 2009.
30 or higher, 51.3% compared with 44.9%, P⫽.004 [BMI is calculated as weight (kg)/[height (m)]2) prior
to pregnancy. They experienced a longer second stage of labor (pushed for 45 minutes or longer, 61.5% compared with 51.5%,P⬍.001). These women were also more active during pregnancy and were more likely to have jogged and participated in yoga. An active history of asthma and constipation occurred more frequently in women who leaked urine after delivery.
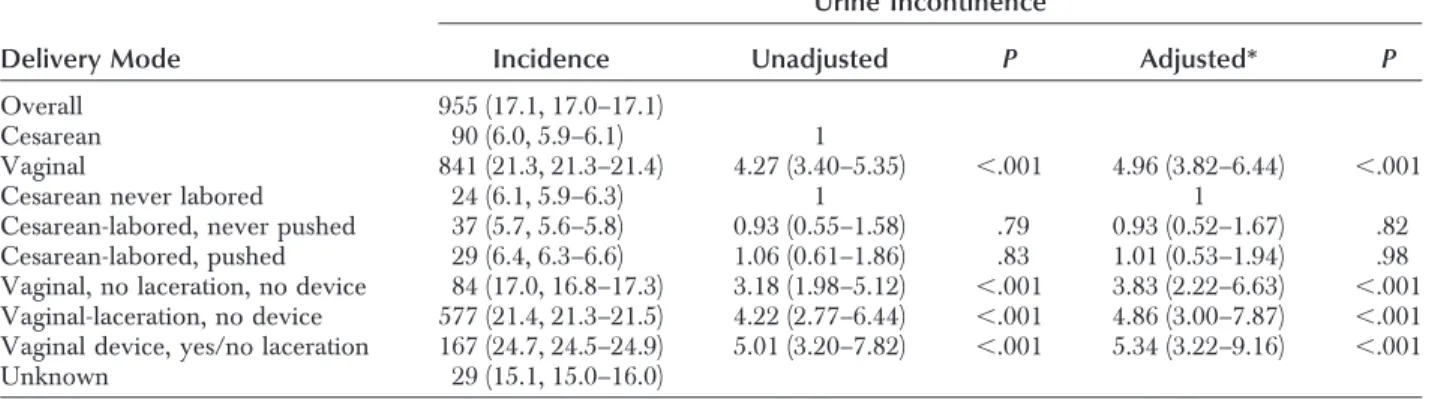
The incidence of urinary incontinence was 6% in women who delivered by cesarean and 21.3% in women who delivered vaginally. Women who had vaginal deliveries were more likely to have urinary incontinence than were women who had any type of cesarean delivery (OR 4.27 [95% CI 3.40 –5.35], P⬍.001). The risk of urinary incontinence in women who delivered vaginally without perineal laceration or the use of vacuum or forceps was 3.18 (95% CI 1.98 –5.12,P⬍.001). This risk increased with perineal
laceration (OR 4.22 [95% CI 2.77– 6.44],P⬍.001) and assisted delivery (OR 5.01 [95% CI 3.20 –7.82], P⬍.001 [see Table 2]). No statistical difference in the incidence of urinary incontinence was found among women who had elective cesarean deliveries (6.1%), women who had cesarean deliveries after laboring (5.7%), and women who had cesarean deliveries after laboring and pushing (6.4%). This study had 80% power to detect a 5.5% difference in the incidence of urinary incontinence among the cesarean delivery groups. These risks all remained significant after adjusting for other potential predictors of urinary incontinence.
Women who had cesarean deliveries were signif-icantly older, heavier, less active, and had larger neonates than women who delivered vaginally. After adjusting for independent predictors of postpartum urinary incontinence, maternal age of 30 years or older, maternal BMI at time of delivery of 30 or higher, birth weight of 8 or more pounds, jogging Fig. 2. Distribution of urinary in-continence among participants. Hamilton Boyles. Labor and Pushing Do Not Affect UI Risk. Obstet Gynecol 2009.
Fig. 3. Delivery mode and urinary incontinence.
Hamilton Boyles. Labor and Pushing Do Not Affect UI Risk. Obstet Gynecol 2009.
Table 1. Characteristics of Study Cohort
Urine Incontinence
Factors No Yes P
Sample size 4,644 (82.9) 955 (17.1) Mo after delivery (range 3–6)
Average 4.4⫾0.7 4.4⫾0.7 .94
Delivery mode
Cesarean, never labored 372 (8.0) 24 (2.5) ⬍.001 Cesarean, labored, never pushed 616 (13.3) 37 (3.9)
Cesarean, labored, pushed 423 (9.1) 29 (3.0) Vaginal, no laceration, no device 409 (8.8) 84 (8.8) Vaginal, laceration, no device 2,119 (45.6) 577 (60.4) Vaginal, device, yes/no laceration* 542 (11.7) 175 (18.3) Unknown†
163 (3.5) 29 (3.0) Age at pregnancy (y)
Average 27.0⫾5.7 27.7⫾5.8 ⬍.001 Younger than 20 463 (10.0) 84 (8.8) .001 20–24 1,202 (25.9) 204 (21.4)
25–29 1,381 (29.8) 282 (29.6) 30 or older 1,589 (34.3) 384 (40.3) BMI before pregnancy (kg/m2)
Average 24.3⫾5.3 24.7⫾5.2 .05 Less than 20 744 (16.4) 123 (13.1)
20 to 24 2,287 (50.5) 473 (50.3) 25 to 29 933 (20.6) 226 (24.0) 30 or higher 564 (12.5) 119 (12.7) Weight gain at pregnancy (lb)
Average 36.4⫾14.9 37.4⫾15.1 .06 Less than 25 759 (17.0) 139 (15.0) .25 25 to 34 1,260 (28.2) 250 (27.0)
35 to 44 1,257 (28.1) 266 (28.7) 45 or higher 1,193 (26.7) 271 (29.3) BMI (kg/m2)at this pregnancy
Average 30.3⫾5.4 30.7⫾5.3 .04 Less than 25 538 (12.3) 99 (10.8) .004 25 to 29 1,877 (42.8) 346 (37.9) 30 to 34 1,257 (28.7) 311 (34.0) 35 or higher 709 (16.2) 158 (17.3) Birth weight (lb) Average 7.5⫾1.3 7.6⫾1.1 .12 Less than 7 1,339 (29.4) 245 (26.0) .10 7–8 1,665 (36.6) 360 (38.2) 8 or more 1,544 (34.0) 338 (35.8) Pushing time Median 45 min 1 h ⬍.001
Less than 15 min 1,235 (27.3) 124 (13.4) ⬍.001 15 to 44.9 min 961 (21.2) 233 (25.1)
45 min to 1.99 h 1,133 (25.1) 304 (32.8) 2 h or more 1,194 (26.4) 266 (28.7) Exercise during pregnancy
Aerobic dance 451 (10.1) 79 (8.6) .19 Jogging 786 (17.4) 194 (21.1) .008 Yoga 1,036 (23.3) 240 (26.6) .03 Conditions before or during pregnancy
Diabetes 172 (3.7) 29 (3.2) .41
Asthma 583 (12.8) 144 (15.8) .01 Constipation 1,424 (30.7) 508 (53.2) ⬍.001 BMI, body mass index.
*Forty-one participants had device without laceration.
†One hundred fifty-six participants (2.8%) without delivery information and 36 participants who had vaginal delivery with unknown
during pregnancy, and active constipation were inde-pendently associated with postpartum urinary incon-tinence in women who delivered vaginally. For women who delivered by cesarean, maternal BMI of 30 or higher and active constipation were indepen-dently associated with postpartum urinary inconti-nence (Table 3).
DISCUSSION
The risk of urinary incontinence in the 3– 6 months after a primiparous delivery is greater in women who deliver vaginally than in women who deliver by cesarean, regardless of whether the cesarean was performed before, during, or after labor. Labor and pushing alone, without vaginal delivery, do not seem
to elevate the risk of urinary incontinence. Assisted delivery and perineal laceration add to the risk of urinary incontinence.
This study confirms previous work that demon-strated the short-term protective effect of cesarean delivery.3,5,8,9 It adds to the existing literature by
demonstrating that an elective cesarean delivery be-fore labor, a cesarean delivery after labor, and a cesarean delivery after labor and pushing provide similar risks of postpartum urinary incontinence. This result is clinically significant. Most primigravid women with cephalic fetuses who deliver via cesarean initially attempt to deliver vaginally. These women will be reassured to know that their risk of urinary incontinence is no greater than that associated with an
Table 2. Delivery Mode and Urine Incontinence
Urine Incontinence
Delivery Mode Incidence Unadjusted P Adjusted* P
Overall 955 (17.1, 17.0–17.1)
Cesarean 90 (6.0, 5.9–6.1) 1
Vaginal 841 (21.3, 21.3–21.4) 4.27 (3.40–5.35) ⬍.001 4.96 (3.82–6.44) ⬍.001 Cesarean never labored 24 (6.1, 5.9–6.3) 1 1
Cesarean-labored, never pushed 37 (5.7, 5.6–5.8) 0.93 (0.55–1.58) .79 0.93 (0.52–1.67) .82 Cesarean-labored, pushed 29 (6.4, 6.3–6.6) 1.06 (0.61–1.86) .83 1.01 (0.53–1.94) .98 Vaginal, no laceration, no device 84 (17.0, 16.8–17.3) 3.18 (1.98–5.12) ⬍.001 3.83 (2.22–6.63) ⬍.001 Vaginal-laceration, no device 577 (21.4, 21.3–21.5) 4.22 (2.77–6.44) ⬍.001 4.86 (3.00–7.87) ⬍.001 Vaginal device, yes/no laceration 167 (24.7, 24.5–24.9) 5.01 (3.20–7.82) ⬍.001 5.34 (3.22–9.16) ⬍.001 Unknown 29 (15.1, 15.0–16.0)
Data are n (%, 95% confidence interval) or odds ratio (95% confidence interval) unless otherwise specified. * Adjusted for potential predictors of urinary incontinence (P⬍.05) in Table 1 and birth weight.
Table 3. Factors Associated with Urinary Incontinence
Vaginal Cesarean
Predictor Unadjusted Adjusted Unadjusted Adjusted
Demographics
Age 30 y or older 1.54* (1.32–1.81) 1.48* (1.24–1.75) 1.16 (0.75–1.77)
BMI (kg/m2) 30 or higher 1.44* (1.23–1.68) 1.52* (1.28–1.79) 1.83†(1.14–2.94) 1.88†(1.17–3.01)
Labor/delivery experience
Birth weight 8 lb or heavier 1.29†(1.10–1.52) 1.22‡(1.03–1.45) 0.84 (0.53–1.35)
Pushed 2 h or longer 1.06 (0.90–1.26) 1.01 (0.59–1.73) Device use 1.23‡(1.02–1.48) NA
Laceration/tear 1.36‡(1.07–1.73) NA
Exercise during pregnancy
Jogging 1.23‡(1.02–1.49) 1.32* (1.08–1.62) 0.86 (0.46–1.60)
Yoga 1.22‡(1.02–1.46) 1.09 (0.66–1.79)
Condition before delivery
Asthma 1.29‡(1.04–1.60) 1.41 (0.80–2.48)
Constipation 2.65‡(2.27–3.10) 2.53* (2.15–2.99) 2.41* (1.57–3.71) 2.35* (1.51–3.65)
BMI, body mass index, NA, not applicable. Data are odds ratio (95% confidence interval). *P⬍.001.
†P⬍.05. ‡P⬍.01.
elective cesarean delivery before labor. Women who labor before a scheduled cesarean will be similarly reassured to learn that their risk of urinary inconti-nence remains stable. These data are reassuring and contribute to the data on short-term outcomes, but they do not address long-term outcomes as recom-mended by the National Institutes of Health State-of-the-Science Statement on Cesarean Delivery on Mater-nal Request (http://consensus.nih.gov/2006/Cesarean Statement_Final053106.pdf).
This work also highlights the biologic mechanism by which parity may affect the continence mecha-nism. The majority of the negative effect on the continence mechanism seems to occur during the distal descent of the fetus through the vagina. Al-though we do not know the fetal station at the time of cesarean delivery in this study, fetal engagement, descent into the proximal vagina, and pushing do not seem to affect the continence mechanism appreciably. This distal descent may affect the continence mecha-nism through nerve injury, connective tissue damage, or muscle injury. Lien et al described nerve stretch during vaginal delivery.15It is possible that the strain
placed on the nerve is damaging only when the fetal head is low enough to deliver vaginally and the nerves are stretched to this extent. Alternately, it may be that the muscular attachments to the pelvic side walls are most likely to shear when the head delivers. Finally, the negative effect may be second-ary to hypoxic muscle injury due to mechanical compression of the urethra by the fetal head. Future research is needed to look at these mechanisms and to determine how they contribute to the damage to the continence mechanism and whether fetal de-scent to a specific level leads to increased urinary incontinence.
Several modifiable risk factors for urinary incon-tinence after delivery were identified. These risk factors include asthma, constipation, and maternal BMI higher than 30. Constipation posed a risk com-parable to that associated with vaginal delivery. It is prudent to address these factors by minimizing con-stipation, optimizing asthma control, and maintaining a healthy maternal weight before proceeding with surgical interventions to minimize the risk of urinary incontinence. The Childbirth and Pelvic Symptoms study also found elevated BMI to be a risk factor, as well as antenatal incontinence and less education.9
We did not find antenatal urinary incontinence to be a risk factor; this difference may result from our decision to exclude women with urinary inconti-nence before pregnancy. The 2007 National Insti-tutes of Health State-of-the-Science Conference
Statement on the Prevention of Fecal and Urinary Incontinence in Adults states that urinary inconti-nence may be “prevented by lifestyle changes, such as weight loss and exercise” (http://consensus.nih. gov/2007/2007IncontinenceSOS030main.htm). The prenatal period may be the optimal intervention point for providing education on minimizing urinary inconti-nence through lifestyle change in women.
This study has several limitations. The follow-up was short, and the results cannot be extrapolated to more than 6 months after delivery. Our response rate was lower than desired, and this may lead to nonre-sponse bias. We did not attempt to define the type of urinary incontinence or ascertain the severity. Our questionnaire was completed in the postpartum pe-riod and relied on maternal recall. Previous research-ers have shown that, although maternal recall is not perfect,16 the accuracy of maternal recall seems to
depend on the questions asked,17when the questions
are asked,18and the demographic composition of the
population.16,19 Preliminary validation work by our
group on this questionnaire found that women have excellent short-term recall about their delivery events.20 In this study, when maternal recall was
compared with delivery records, 100% of women accurately recalled whether they had a cesarean, forceps, or vaginal delivery, 100% correctly recalled a tear or laceration that required repair, and 100% recalled their child’s birth weight within 10% of the recorded value.
Results from this population-based study reveal that vaginal delivery is associated with a higher risk of urinary incontinence than cesarean delivery. Labor did not affect the protective effect of cesar-ean delivery. Modifiable risk factors for urinary incontinence, such as obtaining an ideal body weight and reducing constipation, were identified and hold promise as potential preventive measures for postpar-tum urinary incontinence. The information from this study provides important information for clinicians, patients, and policymakers regarding childbirth and incontinence.
REFERENCES
1. MacLennan AH, Taylor AW, Wilson DH, Wilson D. The prevalence of pelvic floor disorders and their relationship to gender, age, parity and mode of delivery. BJOG 2000;107: 1460–70.
2. Rortveit G, Hannestad YS, Daltveit AK, Hunskaar S. Age- and type-dependent effects of parity on urinary incontinence: the Norwegian EPINCONT study. Obstet Gynecol 2001;98: 1004–10.
3. Rortveit G, Daltveit AK, Hannestad YS, Hunskaar S; Norwe-gian EPINCONT Study. Urinary incontinence after vaginal delivery or cesarean section. N Engl J Med 2003;348:900–7. 4. Handa VL, Harvey L, Fox HE, Kjerulff KH. Parity and route
of delivery: does cesarean delivery reduce bladder symptoms later in life? Am J Obstet Gynecol 2004;191:463–9.
5. Farrell SA, Allen VM, Baskett TF. Parturition and urinary incontinence in primiparas. Obstet Gynecol 2001;97:350–6. 6. Fritel X, Fauconnier A, Levet C, Benifla JL. Stress urinary
incontinence 4 years after the first delivery: a retrospective cohort survey. Acta Obstet Gynecol Scand 2004;83:941–5. 7. Persson J, Wolner-Hanssen P, Rydhstroem H. Obstetric risk
factors for stress urinary incontinence: a population-based study. Obstet Gynecol 2000;96:440–5.
8. Altman D, Ekstrom A, Forsgren C, Nordenstam J, Zetterstrom J. Symptoms of anal and urinary incontinence following cesarean section or spontaneous vaginal delivery. Am J Obstet Gynecol 2007;197:512.e1–7.
9. Burgio KL, Borello-France D, Richter HE, Fitzgerald MP, Whitehead W, Handa VL, et al. Risk factors for fecal and urinary incontinence after childbirth: the childbirth and pelvic symptoms study. Am J Gastroenterol 2007;102:1998–2004. 10. Connolly TJ, Litman HJ, Tennstedt SL, Link CL, McKinlay JB.
The effect of mode of delivery, parity, and birth weight on risk of urinary incontinence. Int Urogynecol J Pelvic Floor Dys-funct 2007;18:1033–42.
11. Schytt E, Lindmark G, Waldenstrom U. Symptoms of stress incontinence 1 year after childbirth: prevalence and predictors in a national Swedish sample. Acta Obstet Gynecol Scand 2004;83:928–36.
12. Wilson PD, Herbison RM, Herbison GP. Obstetric practice and the prevalence of urinary incontinence three months after delivery. Br J Obstet Gynecol 1996;103:154–61.
13. Guise JM, Morris C, Osterweil P, Li H, Rosenberg D, Greenlick M. Incidence of fecal incontinence after childbirth. Obstet Gynecol 2007;109:281–8.
14. Guise JM, Boyles SH, Osterweil P, Li H, Eden KB, Mori M. Does cesarean protect against fecal incontinence in primipa-rous women? Int Urogynecol J Pelvic Floor Dysfunct 2008;Oct 24 [Epub ahead of print].
15. Lien KC, Mooney B, DeLancey JO, Ashton-Miller JA. Levator ani muscle stretch induced by simulated vaginal birth. Obstet Gynecol 2004;103:31–40.
16. Elkadry E, Kenton K, White P, Creech S, Brubaker L. Do mothers remember key events during labor? Am J Obstet Gynecol 2003;189:195–200.
17. Sou SC, Chen WJ, Hsieh WS, Jeng SF. Severe obstetric complications and birth characteristics in preterm or term delivery were accurately recalled by mothers. J Clin Epidemiol 2006;59:429–35.
18. Waldenstrom U. Women’s memory of childbirth at two months and one year after the birth. Birth 2003;30:248–54. 19. Tate AR, Dezateux C, Cole TJ, Davidson L; Millennium
Cohort Study Child Health Group. Factors affecting a mother’s recall of her baby’s birth weight. Int J Epidemiol 2005;34: 688–95.
20. Hall W, McCracken K, Osterweil P, Guise JM. Frequency and predictors for postpartum fecal incontinence. Am J Obstet Gynecol 2003;188:1205–7.