AUTHOR(S):
TITLE:
YEAR:
Publisher citation:
OpenAIR citation:
Publisher copyright statement:
OpenAIR takedown statement:
This publication is made freely available under ________ open access.
This is the ___________________ version of proceedings originally published by _____________________________
and presented at ________________________________________________________________________________
(ISBN __________________; eISBN __________________; ISSN __________).
This publication is distributed under a CC ____________ license. ____________________________________________________
Section 6 of the “Repository policy for OpenAIR @ RGU” (available from
http://www.rgu.ac.uk/staff-and-current-students/library/library-policies/repository-policies
) provides guidance on the criteria under which RGU will
consider withdrawing material from OpenAIR. If you believe that this item is subject to any of these criteria, or for
any other reason should not be held on OpenAIR, then please contact
[email protected]
with the details of
the item and the nature of your complaint.
GREEN
VUTTIPITTAYAMONGKOL, P., ELYAN, E., PETROVSKI, A. and JAYNE, C.
Overlap-based undersampling for improving imbalanced data classification.
2018
VUTTIPITTAYAMONGKOL, P., ELYAN, E., PETROVSKI, A. and JAYNE, C. 2018. Overlap-based undersampling for improving imbalanced data classification. In Yin, H., Camacho, D., Novais, P. and Tallón-Ballesteros, A. (eds.) Intelligent data engineering and automated learning: proceedings of the 19th International intelligent data engineering and automated learning conference (IDEAL 2018), 21-23 November 2018, Madrid, Spain. Lecture notes in computer science, 11341. Cham: Springer [online], pages 689-697. Available from: https://doi.org/10.1007/978-3-030-03493-1_72
VUTTIPITTAYAMONGKOL, P., ELYAN, E., PETROVSKI, A. and JAYNE, C. 2018. Overlap-based undersampling for improving imbalanced data classification. In Yin, H., Camacho, D., Novais, P. and Tallón-Ballesteros, A. (eds.) Intelligent data engineering and automated learning: proceedings of the 19th International intelligent data engineering and automated learning conference (IDEAL 2018), 21-23 November 2018, Madrid, Spain. Lecture notes in computer science, 11341. Cham: Springer, pages 689-697. Held on OpenAIR [online]. Available from: https://openair.rgu.ac.uk/
AUTHOR ACCEPTED
SPRINGER19th International intelligent data engineering and automated learning conference (IDEAL 2018), 21-23 November 2018, Madrid, Spain
9783030034924 9783030034931 0302-9743
BY-NC 4.0
https://creativecommons.org/licenses/by-nc/4.0
https://mirrors.creativecommons.org/presskit/buttons/88x31/png/by-nc.png[10/10/2017 09:37:50]
OpenAIR at RGUDigitally signed by OpenAIR at RGU Date: 2019.02.08 09:08:21 Z
Imbalanced Data Classification
Pattaramon Vuttipittayamongkol1, Eyad Elyan1, Andrei Petrovski1, and
Chrisina Jayne2
1 Robert Gordon University, UK
{p.vuttipittayamongkol,e.elyan,a.petrovski}@rgu.ac.uk
2 Oxford Brookes University, UK
Abstract. Classification of imbalanced data remains an important field in machine learning. Several methods have been proposed to address the class imbalance problem including data resampling, adaptive learn-ing and cost adjustlearn-ing algorithms. Data resampllearn-ing methods are widely used due to their simplicity and flexibility. Most existing resampling tech-niques aim at rebalancing class distribution. However, class imbalance is not the only factor that impacts the performance of the learning algo-rithm. Class overlap has proved to have a higher impact on the classifi-cation of imbalanced datasets than the dominance of the negative class. In this paper, we propose a new undersampling method that eliminates negative instances from the overlapping region and hence improves the visibility of the minority instances. Testing and evaluating the proposed method using 36 public imbalanced datasets showed statistically signifi-cant improvements in classification performance.
Keywords: Undersampling·Overlap·Imbalanced Data·Classification
·Fuzzy C-means·Resampling
1
Introduction
In classification, sufficient data with balanced class distribution often results in more accurate models. However, in many real-world scenarios, datasets contain relatively few samples that belong to the class of interest,e.g.in fraud detection, where there are considerably more instances representing legitimate transactions. Such data form is so called imbalanced datasets. In a binary imbalanced dataset, the class with more instances is referred to as the majority or negative class whereas the rare class is regarded asthe minority or positive class.
Generally, available learning algorithms are not designed to handle classifi-cation of datasets with skewed distributions. Without appropriate adjustments, the minority class tend to be overlooked, and hence are likely to be misclassified. In addition, imbalanced datasets also often suffer from class overlap [6], which proved to have a higher impact on classification than class imbalance [3, 7, 9, 15]. Methods for handling imbalanced datasets can be grouped into two main cat-egories: data-level and algorithm-level [11, 16]. Algorithm-level methods mostly
2 P. Vuttipittayamongkol et al.
involve modifying existing learning algorithms to account for class imbalance [9, 13, 14]. Data-level methods typically reconstruct the original dataset into a more class-balanced version. This is often achieved by means of resampling, which includes undersampling and oversampling. Undersampling reduces in-stances in the majority class; in contrast, oversampling increases inin-stances in the minority class. The advantages of data-level methods over algorithm-level ones are that no deep understandings of the learning algorithm are required [2] and it is flexible to any learning algorithm.
Among undersampling techniques,k-meanshas been widely utilised in recent literature [2, 10–12]. By applying k-means, the majority class is divided into clusters before undersampling is performed resulting in a more balanced and diversified class distribution of the data. However, these approaches as well as most existing undersampling methods only aim at data rebalancing and neglect the overlap issue, which may need a closer attention.
It has been suggested that class imbalance on it own may not affect classifier’s performance. Japkowicz et. al [8] and Denil et al.[3] demonstrated that when sufficient training data was available, any extent of imbalance did not hinder classification. On the other hand, class overlap has been reported to cause more deteriorations than class imbalance [3, 15].
In this paper, we propose a new undersampling framework that reduces the dominance of the majority class instances and more importantly removes them from the overlapping region. For convenience, we refer to ourOverlap-Based Un-dersampling method as OBU. The method incorporates a soft clustering algo-rithm to determine overlapped instances. We hypothesise that an instance with uncertain membership degrees assigned by the soft clustering algorithm is likely to be in the overlapping region. Then, using the proposed OBU, overlapped negative instances can be potentially removed. Subsequently, the visibility of the minority class to the learner will be improved leading to better classifica-tion without the need of data rebalancing. Extensive experiments on 36 public datasets showed significant improvements in classification over the baseline while in most cases, higher results against the state-of-the-art’s were achieved. OBU is demonstrated with a well known soft clustering algorithm, Fuzzy C-means (FCM); however, it is worth noting that any existing soft clustering algorithm can be applied. Therefore, the overlap-based undersampling method is a general framework for handling class overlap in imbalanced dataset classification.
2
Methods
2.1 Fuzzy C-means Algorithm
Fuzzy c-means [1] is one of the most commonly-used soft clustering algorithms. Unlike hard clustering, soft clustering algorithms allow each data instance to be a member of many clusters with membership degrees between 0 and 1. FCM follows similar clustering procedure to k-means, a well-known hard clustering algorithm except that FCM’s objective function involves two additional parameters, which are the membership degree and the fuzziness degree.
In this paper, the main FCM parameter which is the C value (number of clusters) was set to equal 2 as it serves the propose of differentiating between the characteristics of the two classes in binary datasets.
2.2 The Proposed Overlap-Based Undersampling Algorithm
Unlike other clustering-based undersampling methods, our proposed framework uses membership degrees obtained from the clustering process to facilitate the elimination of negative instances from the overlapping region. Given an imbal-anced training set D that is made of positive class (Dpos) and negative class (Dneg), a soft clustering is then applied to give each instance a negative mem-bership degree md. In this paper, we use FCM as the soft clustering algorithm; however, OBU is a framework that can be adapted to use other soft cluster-ing techniques. All indecisive negative instances whose membership degrees are vague are considered as part of the overlapping region. These instances are then removed from the training set D. The resulting undersampled training set will include the remaining negative instancesd’s inDnegOBU along with the positive
instances inDpos.
Since binary datasets are used in this paper, when applying soft clustering, the number of clusters is set to 2 to differentiate between the positive and neg-ative classes. Thus, each instance is assigned with 2 membership degrees. These are the degrees of being in cluster 1 and cluster 2, which sum up to 1. By default, the higher membership degree determines the predicted cluster of the instance. Thus, it can be said that a negative instance has been clustered to the correct class if the resulting negative membership degree is 0.5 or higher. On the other hand, it is considered misclustered when the negative membership degree is less than 0.5. In OBU, all misclustered negative instances are removed from the training set. In addition, to allow flexibility and avoid excessive eliminations, an elimination threshold α−cut is introduced. The α−cut is set such that any negative instance whose md is below the α−cut is removed from the training set. Finally, a fuzzy setDnegOBU is expressed as
DnegOBU ={d∈Dneg |md ≥α−cut} (1)
In this paper, theα−cutvalues between 0.3 to 0.5 were empirically experimented to achieve the global α−cut that optimised the overall results. This will be discussed in the next section.
2.3 Selection Process
In our framework, when two clusters are created, they may not be readily matched with the two prior class labels. For linearly separable problems, this can be resolved by simply finding the dominant class of the cluster. However, in a complex dataset where both imbalance and overlap exist, an alternative and principled approach to perform this matching process is needed.
4 P. Vuttipittayamongkol et al.
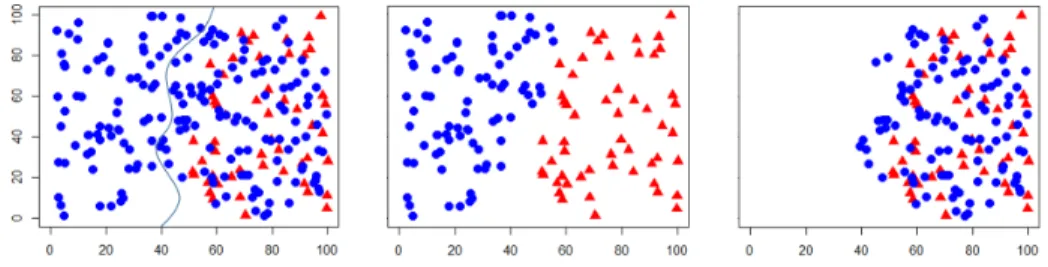
Fig.1 shows a complex scenario where the data is both imbalanced (minor-ity:majority = 3:10) and highly overlapped as an example. The negative and positive classes are presented with blue circle and red triangle, respectively. Per-forming FCM clustering on the data resulted in two clusters showed in the left diagram. The between-class border was roughly sketched with the grey line. There are 80 and 100 negative instances in the left and the right clusters, re-spectively. With OBU, the 100 negative instances in right cluster are supposed to be eliminated. Note that these are the majority of the negative class. Thus, a criterion to eliminate a smaller number of negative instances cannot be applied as a selection process of OBU. It is also worth pointing out that judging from the positive class is not valid for all cases either.
Fig. 1.Original data with the cluster boundary from FCM clustering (left), correctly undersampled data (middle), incorrectly undersampled data (right)
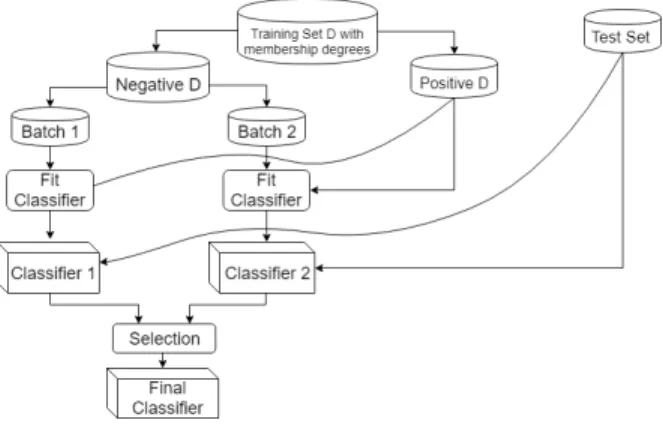
In imbalanced and overlapping domains, besides this example, there are various problematic cases that prevent the clustering labels to be matched correctly with the actual labels. Therefore, our proposed framework has been adapted to handle such ambiguous scenarios (Fig.2). To achieve this, negative instances in both clusters (batch 1 and 2) are considered for elimination, one at a time. One batch remains in the training set while the other is eliminated. As a result, two classification models are obtained. Since the positive class should be more visible in the overlapping region after applying OBU, the model obtained from the correctly undersampled case is expected to yield higher positive class accuracy. The selection is performed at this stage and the other model is discarded.
3
Experiment
3.1 SetupThree different experiments were carried out to evaluate our proposed method. First, the datasets were classified after applying OBU. Second, we compared our results with the baseline which was simply classifying the datasets using Random Forests with no undersampling. Finally, we reproduced one of the state-of-the-art methods [10], and compared it with our proposed technique .
Random Forest (RF) was chosen as the baseline as it proved to be amongst the top performing traditional machine learning algorithms [4, 5]. For all three experiments, the default parameter settings for RF incaret package inR were
Fig. 2.Overlap-based undersampling framework
used (500 trees, and √nfeatures at each split, where nis the total number of features in the dataset). In the first experiment,α−cutwas set to 0.45 based on empirical results over a range of α−cut values (0.3, 0.36, 0.42, 0.45, and 0.5). The full code for reproducing is available onGitHub3.
The partitioning ratio of the training and testing sets is 80:20, and the 10-fold cross-validation technique was adopted across the three experiments.
3.2 Datasets
In all experiments, 36 frequently used datasets in class-imbalance classification were selected. These datasets are obtained from UCI and KEEL repositories. Showed in Table 1, these datasets vary in terms of size (129 to 5472 instances), imbalance ratio (1.87 to 129.44), and number of features (3 to 19). These vari-ations allowed the proposed technique to be tested for its robustness under dif-ferent situations.
3.3 Evaluation Metrics
The evaluation metrics used in the experiments were sensitivity and balance ac-curacy. Sensitivity is the true positive rate (TPR). It receives the most attention in imbalanced data classification since the positive class is of higher concern. Higher sensitivity is desired; however, high sensitivity by itself is not sufficient to assess a classifier. An overall classification performance is also needed.
Balance accuracy is a measure of the overall performance. Showed in Eq. (2), balance accuracy is the average of the TPR and the true negative rate (TNR). It is preferable to the traditional accuracy, which neglects the fact that the cardinality of the positive class is relatively very small in imbalanced domains.
Balance accuracy= T P R+T N R
2 (2)
3
6 P. Vuttipittayamongkol et al.
4
Results and Discussion
4.1 ResultsAs can be seen in Table 1, the proposed OBU produced the most favourable re-sults among the different experiments and outperformed the recently proposed undersampling technique,k-means clustering-based undersampling, which proved to give comparable results with state-of-the-art methods [10]. Wilcoxon signed rank tests indicate that by employing our approach, the classification improve-ments over the baseline were statistically significant as detailed below.
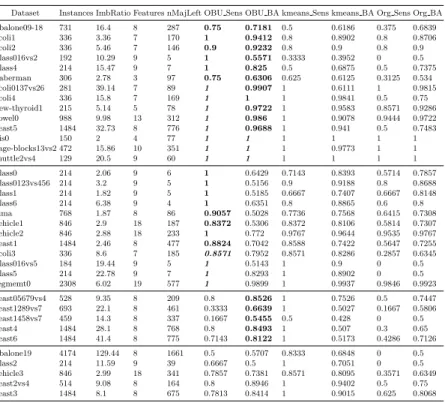
Table 1.Comparative results
Dataset Instances ImbRatio Features nMajLeft OBU Sens OBU BA kmeans Sens kmeans BA Org Sens Org BA Abalone09-18 731 16.4 8 287 0.75 0.7181 0.5 0.6186 0.375 0.6839 Ecoli1 336 3.36 7 170 1 0.9412 0.8 0.8902 0.8 0.8706 Ecoli2 336 5.46 7 146 0.9 0.9232 0.8 0.9 0.8 0.9 Glass016vs2 192 10.29 9 5 1 0.5571 0.3333 0.3952 0 0.5 Glass4 214 15.47 9 7 1 0.825 0.5 0.6875 0.5 0.7375 Haberman 306 2.78 3 97 0.75 0.6306 0.625 0.6125 0.3125 0.534 Ecoli0137vs26 281 39.14 7 89 1 0.9907 1 0.6111 1 0.9815 Ecoli4 336 15.8 7 169 1 1 1 0.9841 0.5 0.75 New-thyroid1 215 5.14 5 78 1 0.9722 1 0.9583 0.8571 0.9286 Vowel0 988 9.98 13 312 1 0.986 1 0.9078 0.9444 0.9722 Yeast5 1484 32.73 8 776 1 0.9688 1 0.941 0.5 0.7483 Iris0 150 2 4 77 1 1 1 1 1 1 Page-blocks13vs2 472 15.86 10 351 1 1 1 0.9773 1 1 Shuttle2vs4 129 20.5 9 60 1 1 1 1 1 1 Glass0 214 2.06 9 6 1 0.6429 0.7143 0.8393 0.5714 0.7857 Glass0123vs456 214 3.2 9 5 1 0.5156 0.9 0.9188 0.8 0.8688 Glass1 214 1.82 9 5 1 0.5185 0.6667 0.7407 0.6667 0.8148 Glass6 214 6.38 9 4 1 0.6351 0.8 0.8865 0.6 0.8 Pima 768 1.87 8 86 0.9057 0.5028 0.7736 0.7568 0.6415 0.7308 Vehicle1 846 2.9 18 187 0.8372 0.5306 0.8372 0.8106 0.5814 0.7307 Vehicle2 846 2.88 18 233 1 0.772 0.9767 0.9644 0.9535 0.9767 Yeast1 1484 2.46 8 477 0.8824 0.7042 0.8588 0.7422 0.5647 0.7255 Ecoli3 336 8.6 7 185 0.8571 0.7952 0.8571 0.8286 0.2857 0.6345 Glass016vs5 184 19.44 9 5 1 0.5143 1 0.9 0 0.5 Glass5 214 22.78 9 7 1 0.8293 1 0.8902 0 0.5 Segmemt0 2308 6.02 19 577 1 0.9899 1 0.9937 0.9846 0.9923 Yeast05679vs4 528 9.35 8 209 0.8 0.8526 1 0.7526 0.5 0.7447 Yeast1289vs7 693 22.1 8 461 0.3333 0.6639 1 0.5027 0.1667 0.5806 Yeast1458vs7 459 14.3 8 337 0.1667 0.5455 0.5 0.428 0 0.5 Yeast4 1484 28.1 8 768 0.8 0.8493 1 0.507 0.3 0.65 Yeast6 1484 41.4 8 775 0.7143 0.8122 1 0.5173 0.4286 0.7126 Abalone19 4174 129.44 8 1661 0.5 0.5707 0.8333 0.6848 0 0.5 Glass2 214 11.59 9 39 0.6667 0.5 1 0.7051 0 0.5 Vehicle3 846 2.99 18 341 0.7857 0.7381 0.8571 0.8095 0.3571 0.6349 Yeast2vs4 514 9.08 8 164 0.8 0.8946 1 0.9402 0.5 0.75 Yeast3 1484 8.1 8 675 0.7813 0.8414 1 0.9015 0.625 0.8068
The overlap-based undersampling method produced the best results across 26 and 23 datasets in terms of sensitivity and balance accuracy, respectively. It is also shown that on 14 of these datasets, OBU won in both metrics, which far outnumbered the k-means based technique. These results are highlighted in Table 1 as bold indicating that our method is winning and initalic indicating that our method is winning over one method and having similar (tie) performance to the other. However, it should be noted that most of these ties occurred with the sensitivity value of 100%. In other words, these datasets are imbalanced yet already linearly separable and do not need to be resampled. The results suggest that our method improved the classification on most of the datasets. At the same time, it was unlikely to hurt the classification performance on a
linearly separable dataset, where the classification accuracy was already at the maximum. This could be attributed to the fact that OBU only undersamples negative instances in the overlapping region.
To further assess the significance of the improvements using our proposed framework, one-tailed Wilcoxon signed rank tests were carried out. The resulting p-values for OBU paired with the baseline and k-means undersampling on the sensitivity were 1.16×10⁻⁶ and 0.473, and of balance accuracy were 0.108 and
0.271, respectively. These results suggest that at the significance level of 0.05, our method led to statistically significant improvements over the baseline on sensitivity while the other pairs had insufficient evidence to conclude.
4.2 Discussion
By applying the proposed undersampling framework, it was possible to remove negative instances from the overlapping region, where misclassification often occurs. This made positive instances more visible to the learner, and as a result, the sensitivity values of most datasets were improved.
Table 1 presents 4 groups of the results based on the classification improve-ments obtained with OBU. The first group is the datasets that OBU produced winning results in both sensitivity and balance accuracy. The second group has wining sensitivity values but not balance accuracy. This must have occurred due to the tradeoff between the accuracy of the positive and the negative classes in the overlapping region, and thus can be slightly adjusted for a more compromised result. In the third group, OBU produced the best results in balance accuracy, but not the sensitivity. This implies that more undersampling can be applied to further eliminate the overlapped negative instances. For the last group, our approach outperformed the baseline but not the k-means based undersampling method. Our assumption is that the variation in the results is due to the inher-ent data characteristics. Also, it should be noted that these results are based on a global empirical setting of the α−cut value. In other words, fine-tuning this value for individual datasets could potentially improve the results further.
Unlike common undersampling methods, our framework minimises informa-tion loss by undersampling from the overlapping region only, which also results in maximising the visibility of the positive instances. This is evident by higher sen-sitivity and balance accuracy obtained in most datasets as the tradeoff between lower negative accuracy and higher positive accuracy has been compromised.
5
Conclusions and Future Work
In this paper, a new overlap-based undersampling framework was proposed. By removing negative instances from the overlapping region, an exceptional im-provement in the minority class accuracy with a relatively small trade-off of the TNR was achieved, resulting in a significant improvement in sensitivity. This technique has proved to enhance the classification of well-known imbal-anced datasets and outperformed the state-of-the-art method in most of the
8 P. Vuttipittayamongkol et al.
demonstrated cases. These results can be attributed to several advantages of our method over other common undersampling techniques. These include: first, the amount of undersampling done by OBU is proportional to the overlap degree; second, OBU is unlikely to eliminate instances outside the overlapping region, which minimises information loss. For a future direction, we are experiment-ing to further improve this undersamplexperiment-ing framework, especially in the selection process and an adaptiveα−cutapproach.
References
1. Bezdek, J.C., Ehrlich, R., Full, W.: Fcm: The fuzzy c-means clustering algorithm.
Computers & Geosciences10(2-3), 191–203 (1984)
2. Branco, P., Torgo, L., Ribeiro, R.P.: A survey of predictive modeling on imbalanced
domains. ACM Computing Surveys (CSUR)49(2), 31 (2016)
3. Denil, M., Trappenberg, T.: Overlap versus imbalance. In: Canadian Conference on Artificial Intelligence. pp. 220–231. Springer (2010)
4. Elyan, E., Gaber, M.M.: A fine-grained random forests using class decomposition:
an application to medical diagnosis. Neural computing and applications 27(8),
2279–2288 (2016)
5. Elyan, E., Gaber, M.M.: A genetic algorithm approach to optimising random
forests applied to class engineered data. Information sciences384, 220–234 (2017)
6. Galar, M., Fernandez, A., Barrenechea, E., Bustince, H., Herrera, F.: A review on ensembles for the class imbalance problem: bagging-, boosting-, and hybrid-based approaches. IEEE Transactions on Systems, Man, and Cybernetics, Part C
(Applications and Reviews)42(4), 463–484 (2012)
7. Garc´ıa, V., Mollineda, R.A., S´anchez, J.S.: On the k-nn performance in a
chal-lenging scenario of imbalance and overlapping. Pattern Analysis and Applications
11(3-4), 269–280 (2008)
8. Japkowicz, N., Stephen, S.: The class imbalance problem: A systematic study.
Intelligent data analysis6(5), 429–449 (2002)
9. Lee, H.K., Kim, S.B.: An overlap-sensitive margin classifier for imbalanced and overlapping data. Expert Systems with Applications (2018)
10. Lin, W.C., Tsai, C.F., Hu, Y.H., Jhang, J.S.: Clustering-based undersampling in
class-imbalanced data. Information Sciences409, 17–26 (2017)
11. Ng, W.W., Hu, J., Yeung, D.S., Yin, S., Roli, F.: Diversified sensitivity-based undersampling for imbalance classification problems. IEEE transactions on
cyber-netics45(11), 2402–2412 (2015)
12. Ofek, N., Rokach, L., Stern, R., Shabtai, A.: Fast-cbus: A fast clustering-based un-dersampling method for addressing the class imbalance problem. Neurocomputing
243, 88–102 (2017)
13. Oh, S.H.: Error back-propagation algorithm for classification of imbalanced data.
Neurocomputing74(6), 1058–1061 (2011)
14. Song, J., Lu, X., Wu, X.: An improved adaboost algorithm for unbalanced classi-fication data. In: Fuzzy Systems and Knowledge Discovery, 2009. FSKD’09. Sixth International Conference on. vol. 1, pp. 109–113. IEEE (2009)
15. Visa, S., Ralescu, A.: Learning imbalanced and overlapping classes using fuzzy sets. In: Proceedings of the ICML. vol. 3 (2003)
16. Yen, S.J., Lee, Y.S.: Cluster-based under-sampling approaches for imbalanced data