www.economicmodeling.com
WESTAF Creative Occupation Cluster
Audit
Introduction
Recently the “creative economy” concept has become very meaningful in the national economic development scene. Yet there is no consensus on the best way to measure a region’s creative economy, nor is there agreement on what specific types of benefits it provides for a region. In some cases, “creative economy” is used to describe individuals who create, build, and produce art. But other definitions can encompass as much as 30 percent of a region’s workforce and include a vast quantity of occupations—not only artists but scientists, managers, lawyers, and sales people. The creative occupations included in the Creative Vitality Index (CVI) falls into the first category of definitions because it focuses solely upon the “arts-related creative economy.” The theory behind the CVI is that strong regional creative economies are simulative for individual, societal, and economic progress. The Western States Art Federation (WESTAF) and its associates have used a unique methodology to identify 36 CVI occupations that form the creative economy of a region. This arts-related occupational cluster signifies a critical step toward understanding creative economy. Yet some questions still exist as to whether the occupations in this cluster truly represent the structure of the creative economy, and how this cluster relates to creative workers in other industries.
This analysis is an audit of the existing occupations within the arts-related occupational cluster. EMSI sought to answer the following three questions in this analysis:
1) Which occupations not currently in the cluster could be included?
2) Which occupations currently in the cluster do not fit within the structure?
3) What other occupations outside of the cluster share the same skills, and is there a geographic correlation between the CVI creative cluster and non-artistic creative workers?
Methodology
EMSI recognized the distinct purposes of the CVI when developing an auditing
methodology. Therefore when analyzing occupations to add or drop from the list, EMSI considered only those that are involved in the production and/or distribution of art. EMSI followed in the CVI committee’s footsteps in defining art in the broad sense. In economic terms EMSI defined art as any product or service that is primarily designed to affect human emotion. This definition encompasses both not-for-profit and for-profit artistic expression. When searching for “non-artistic creative occupations” EMSI did not require that the workers are involved in the production or distribution of art, but rather focused solely on their
capacity for creative and original thinking.
The primary data sources used in this analysis were EMSI’s own proprietary database of industry and occupational employment information and the Employment and Training
www.economicmodeling.com
Administration’s “O*NET” occupational network database. EMSI’s database contains employment data, projections, and educational crosswalk information on all of the Standard Occupational Codes (SOC). The O*NET system complements EMSI’s data nicely as it utilizes the SOC system to determine the knowledge, skills, and abilities that are most critical for individuals to succeed in each occupation. O*NET quantifies knowledge, skills, and abilities in over 750 categories. Collectively these categories are called “competencies.” Each occupation receives two scores for each competency category—the first is called “importance” and the second is called “level.” Both are measured on a scale from 1-100. The level score indicates how skilled the individuals who work in that occupation need to be in order to succeed. The importance score indicates how important it is for that person to have that particular skill level. In most cases these scores are very closely matched. Exceptions occur with occupations that have competency areas that are ranked as “very important” yet the worker only has a moderate skill level. On the other hand, exceptions also occur when a worker is very skilled in a particular category, but this skill is not as vital as some other skills that they might have—in which case their importance level is noticeably lower than the skill level.
Initially, EMSI used a national staffing pattern to narrow the list of all occupations to only those that exist in arts-producing industries. All of the core CVI occupations and roughly 100 more showed up on this list. The next step was to study the O*NET scores of these
occupations to determine which ones outside of the CVI cluster share the same skills and abilities. Three competencies were selected. A description of what is being measured in each of these competencies is provided below.
Competency Description
Fine Arts Knowledge
“Knowledge of the theory and techniques required to compose, produce, and perform works of music, dance, visual arts, drama, and sculpture.”
Thinking Creatively “Developing, designing, or creating new applications, ideas, relationships, systems, or products, including artistic contributions”
Originality “The ability to come up with unusual or clever ideas about a given
topic or situation, or to develop creative ways to solve a problem.”
The “originality” and “thinking creatively” categories are very similar but have two
characteristic differences. The originality category has the distinct requirements of “problem solving” and coming up with ideas, while on the other hand, the thinking creatively category is not as focused on “problem solving” and is more concerned with production of
applications, products, and art. Within the arts-producing industry, some workers solve problems, and some workers develop art. By including both of these measurements EMSI hoped to capture the strengths of individuals throughout the whole arts-producing spectrum. Therefore, in order to be considered a creative occupation EMSI had two requirements: 1) that the occupation normally works within an arts-producing industry, and 2) that the occupation have a high score in the O*NET competencies of “thinking creatively” and “knowledge of fine arts.”
www.economicmodeling.com
Results
Review of Current Occupations
The first analysis conducted by EMSI was a simple review of the existing CVI occupations relative to the rest of the occupational field. The point of this analysis was to determine if the arts-related occupations were truly both “creative” and artistic. Table one displays the average scores of the occupations in each of the identified competency fields. Separate rows are included for the full field, the primary occupations, and the secondary occupations. These figures indicate that while WESTAF and its associates did not incorporate O*NET into their analysis, they did an excellent job of approximating the arts-related creative workforce. Table 1: O*NET Scores for Key Competencies
Thinking Creatively Originality Fine Arts Occupational
Group
Importance Skill Importance Skill Importance Skill Full CVI 82 72 66 53 48 46 Primary CVI 88 77 71 56 56 55 Secondary CVI 73 64 58 48 35 32 All other
occupations 53 49 41 37 6 3
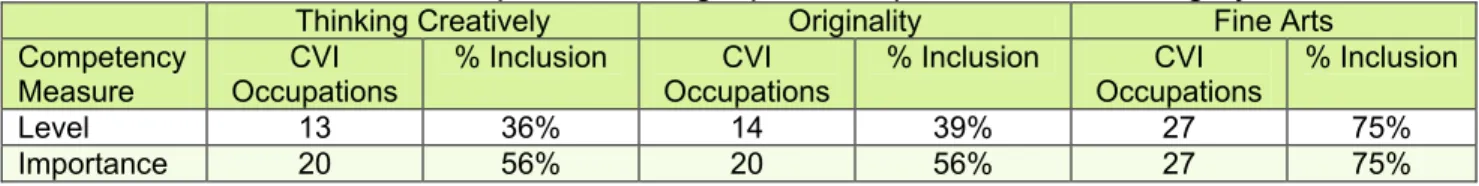
The second measure of the accuracy of the CVI that EMSI conducted was determining how many occupations from the CVI list show up in the list of the top 50 highest-ranked
occupations for each category. One should expect well under 100% occurrence on each of these data sets. As mentioned earlier, there are key differences between each competency category, which is why all three of them have all been included in this analysis. Table 2 contains the results according to this methodology.
Table 2: Occurrence of CVI occupations among top 50 occupations in each category
Thinking Creatively Originality Fine Arts Competency Measure CVI Occupations % Inclusion CVI Occupations % Inclusion CVI Occupations % Inclusion Level 13 36% 14 39% 27 75% Importance 20 56% 20 56% 27 75%
There is a strong presence of CVI occupations within each of these categories. This analysis attests to the fact that CVI occupations have a much higher-than-average level of fine arts knowledge compared to the rest of the workforce. This analysis also leads to the conclusion that the CVI occupations each have roughly the same level of competence and importance in thinking creatively and originality. Lastly, and most interestingly, this table indicates that the CVI occupations have a higher importance level for thinking creatively and originality than skill levels. This means that there are a number of occupations outside of the CVI cluster that have a higher skill level in creativity and originality, but the level of skill that the CVI cluster occupations do have is more critical to their success than those outside the cluster. Likewise, the occupations that beat out the CVI occupations in creativity skill rankings are highly skilled in other categories that are more important to their success than creativity.
www.economicmodeling.com
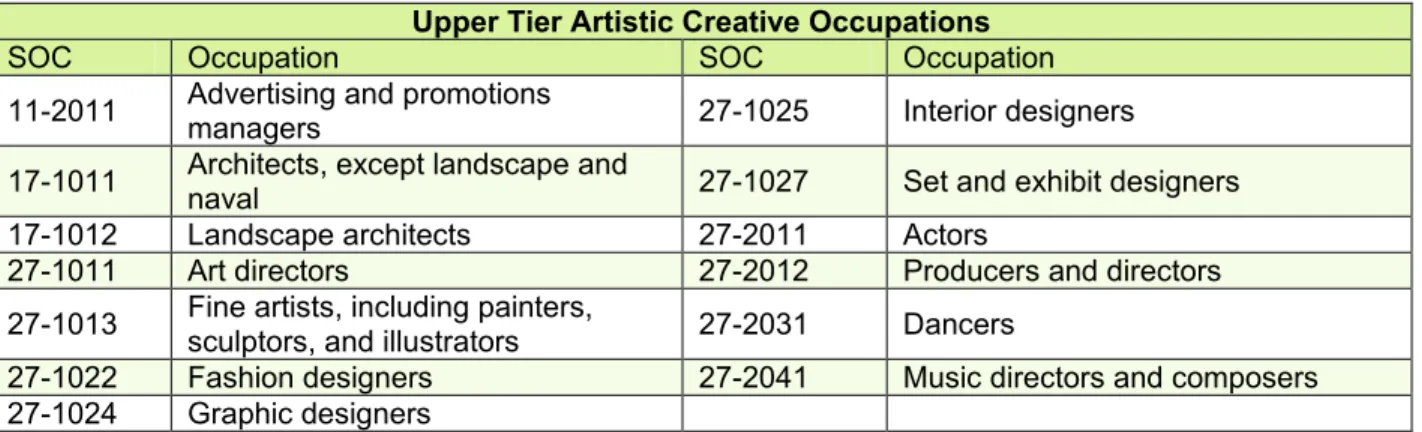
Lastly, as an indication of which occupations in the cluster that are among the upper-tier skill-wise, Table 3 contains a list of which CVI occupations fall within the top 50 for all three categories.
Table 3: Occupations that appear in top 50 for thinking creatively, originality, and knowledge of fine arts
Upper Tier Artistic Creative Occupations
SOC Occupation SOC Occupation 11-2011 Advertising and promotions managers 27-1025 Interior designers 17-1011 Architects, except landscape and
naval 27-1027 Set and exhibit designers 17-1012 Landscape architects 27-2011 Actors
27-1011 Art directors 27-2012 Producers and directors 27-1013 Fine artists, including painters,
sculptors, and illustrators 27-2031 Dancers
27-1022 Fashion designers 27-2041 Music directors and composers 27-1024 Graphic designers
Occupations that could be added
EMSI used three criteria for selecting occupations to add to the list of creative occupations. First and foremost, they must interact and work in the same industries as the existing creative occupations. Since the CVI is particularly focused on measuring the benefits of an arts “culture” it would not make sense to add occupations that are not included in the same network. Secondly, they must have high O*NET scores in the three O*NET categories. EMSI identified five occupations that fit these requirements. The Importance column was considered more heavily in this analysis because, as has been noted, this measurement is a more representative of the arts cluster than the skill score.
Table 4: Possible Occupations to add to the CVI
Thinking Creatively Originality Fine Arts Occupational
Group
Importance Skill Importance Skill Importance Skill Craft Artists 93 86 69 54 73 74 Broadcast New Analysts 93 75 69 50 19 22 Architectural Drafters 73 68 55 51 17 17 Advertising Sales Agents 71 65 66 50 8 0 Curators 85 77 69 54 50 58 Makeup Artists, Theatrical and Performance 91 77 60 52 63 61 Merchandise Displayers and Window Trimmers 71 64 56 46 30 25 CVI Average 82 72 66 53 48 46
www.economicmodeling.com
Occupations that could be subtracted
The following list displays the occupations that could potentially be dropped from the CVI list because of poor scores in thinking creatively, fine arts, or both. Originality was not
considered in this analysis because a number of key occupations within the cluster have only average scores in this category.
Table 5: Possible occupations to drop from the CVI
Thinking Creatively Fine Arts Occupational Group Importance Skill Importance Skill Librarians 55 49 18 19 Broadcast Technicians 56 51 23 22 Technical Writers 68 64 8 0 Public Relations Managers 83 65 9 0 Public Relations Specialists 91 76 8 0 CVI Average 82 72 48 46
Librarians and Broadcast Technicians are the lowest-scoring CVI occupations in thinking creatively, importance, and skill. Technical Writers, Public Relations managers, and Public relations specialists require virtually no knowledge of fine arts, which indicates that they may not belong among the CVI occupations.
Other creative occupations
As was noted throughout the analysis, there are some occupations that maintain very high scores in thinking creatively and originality that are not associated with arts-producing industries. Though it would not make sense to add these occupations to the CVI cluster, this fact is still worth noting. If there is a link between the arts-related creative class and the remaining creative class, it would benefit WESTAF to recognize it because it would make the CVI even more significant for the economic health of a region. EMSI identified roughly 44 non-artistic creative occupations. The full list is included in the appendix and some of the highlights are listed in Table 6.
www.economicmodeling.com
Table 6: Non-artistic Creative Occupations
Thinking Creatively Originality Fine Arts Occupational Group Importance Level Importance Level Importance Level Astronomers 93 95 66 59 2 0 Mathematicians 94 94 69 71 1 0 Physicists 94 91 78 79 1 0 Postsecondary Teachers 83 79 53 51 22 20 Sociologists 85 81 53 55 4 0 Clergy 84 80 66 66 3 0 Computer and Information Systems Managers 86 85 66 61 1 0 Engineers- Various 79 77 61 57 8 6 Computers & Technology- Various 78 80 56 53 4 2 Scientists- Various 83 81 61 60 5 2 CVI Average 82 72 66 53 48 46
There is a strong presence of Engineers, Scientists, and Computer and Technology workers in this group, which is why their numbers have been averaged and placed on this list. The scores of the creative leaders within these sectors match up well with the artistic cluster in both thinking creatively and originality. Not surprisingly they lag behind in knowledge of fine arts. The remaining workers are of all different types, including social services, education, and business.
Geographic Concentration
One final question is whether a geographic correlation exists between the arts-producing creative class and the non-arts-producing creative class. Though it would take a thorough spatial-clustering analysis to determine this, EMSI has conducted a crude GIS analysis of areas to give some idea of this relationship.
Figuring out the connection between these two clusters would be tremendously useful in the world of economic development. Currently, there is a debate occurring among creative economy theorists on whether or not artist culture has any effect on the overall ingenuity of the workforce. And if it does, are artists making the existing population more innovative or are they just drawing in other creative minds from elsewhere? Some thinkers such as Robert Putnam and Robert Cushing have noticed an odd geographic correlation between artistic individuals, or “Bohemians” as they are sometimes called, and successful high-tech and business industries. The Bohemian class typically consists of many of the same occupations included in the CVI, such as artists, musicians, actors, dancers, etc. Therefore, it is worth investigating whether or not certain highly-artistic areas have a similarly high concentration of other creative individuals. We could also expect a high geographic correlation due to the fact that the Bohemian class is not synonymous with the CVI occupational cluster. The occupations included in the list of secondary creative occupations make the overall list as a diverse cluster that includes people who produce art primarily for its cultural significance and people who create artistic renderings primarily for profit. People from the second list are more likely to locate in places with economic opportunity and a thriving industrial base,
www.economicmodeling.com
which makes it more likely that the CVI creative occupations will be geographically associated with other successful creative people.
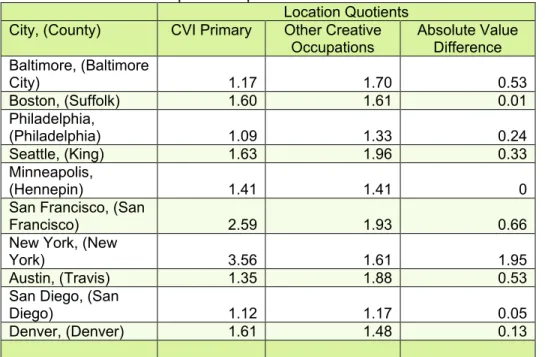
This spatial analysis utilizes location quotients to display the concentration of employment within each of the listed cities. Location quotients measure the relative concentration of the class of workers compared to the national average. To arrive at this number, EMSI divides the number of creative workers by the total number of jobs in the region, performs the same process at the national level, and then divides the solution of the first formula by the solution of the second formula. Location quotient scores of above 1.00 indicate a
higher-than-average concentration, while scores above 1.50 indicate a very high concentration. The final column in Table 7 shows the absolute value difference between the two location quotients to give an indication of how closely they are related.
Table 7: Creative Occupations Spatial Correlation1
Location Quotients City, (County) CVI Primary Other Creative
Occupations Absolute Value Difference Baltimore, (Baltimore City) 1.17 1.70 0.53 Boston, (Suffolk) 1.60 1.61 0.01 Philadelphia, (Philadelphia) 1.09 1.33 0.24 Seattle, (King) 1.63 1.96 0.33 Minneapolis, (Hennepin) 1.41 1.41 0 San Francisco, (San
Francisco) 2.59 1.93 0.66 New York, (New
York) 3.56 1.61 1.95 Austin, (Travis) 1.35 1.88 0.53 San Diego, (San
Diego) 1.12 1.17 0.05 Denver, (Denver) 1.61 1.48 0.13
The results of Table 7 provide several answers. First, each of these cities has a higher-than-average presence of both creative and non-creative workers. Second, there seems to be a strong correlation between the two measurements. The preliminary conclusion of this
rudimentary analysis therefore is that non-artistic and artistic creative workers tend to cluster together geographically. Whether the relationship is causal remains unknown. In other words, at this point we do not know if the high concentration of one cluster leads to a higher concentration of the other cluster, or even if their concentrations in the same regions are related to one another.
1Selected cities were adapted from American Style magazine’s article on “Top 25 Art Destinations: From Sea to Shining Sea.”
June 2007,
http://www.americanstyle.com/ME2/dirmod.asp?sid=&type=gen&mod=Core+Pages&gid=D4BC7638393C45F5B69956570EB9 4649
www.economicmodeling.com
In conclusion, WESTAF and its associated creators of the CVI index can take pride in the list of creative occupations that they developed because it is inclusive of almost all of the arts-related, creative occupations. For future studies EMSI has developed a list of seven occupations that can be added to this list and five that can be taken away. Additionally, EMSI developed a list of forty-four non-artistic creative occupations that can be included in future analyses to determine if there is a spatial and cultural correlation between the two clusters.
www.economicmodeling.com
WESTAF Creative Industry Cluster Audit
Introduction
EMSI’s analysis of artistic creative occupations relied on determining the knowledge, skills, and abilities of each occupation. This analysis came down to determining the occupations that have exceptional to strong creative attributes and work in creative industries. In comparison, analysis of the creative industry clusters is simpler because industry classifications are based on the ultimate output of the industry rather than the skills and work activities of the employees. Therefore, to determine the most artistic creative industries we only need to isolate the industries whose missions are to provide art to consumers. After looking at the CVI industry cluster, EMSI determined that WESTAF and its associates have pinpointed most of the industries that are critical to the proliferation of art, although a few more could potentially be added to the mix.
The current CVI industry cluster is concentrated heavily on the sales of retail businesses. This serves as a good metric of the overall demand for artistic products from each region but this method has two notable weaknesses. First, since the method is focused on sales, it only gives a partial indication of the supply of local art, while not clearly portraying the local demand. Second, since the method is focused primarily on retail industries, the sales contributions of certain artistic services industries are not included. Since the CVI is
principally about quantifying well-rooted artistic cultures, the supply and demand of all types of artistic industries should be taken into consideration.
Method and Metrics
For a more balanced analysis EMSI recommends the use of three metrics: one that signifies regional supply and two that signify regional demand. As before, EMSI recommends the use of sales data when analyzing supply. EMSI’s data are resultant of an input-output model, which is a tool used by economists to determine how specific changes in the economic landscape will affect the rest of a local economy. Sales data provide a reasonable estimate of the annual revenue of each industry. The data include both regional and export sales, which make it an excellent measurement for supply on a broad scale. The problem with this figure is that it contains both local and exported sales. Therefore, any area that exports a large portion of their artistic goods and services will be favored in the CVI over an area that has a high demand but lacks significant supply.
The figures that EMSI recommends for calculating regional demand are further offspring of input-output modeling. These figures are called absorption and consumption. Absorption indicates how much of the regional sales of each industry are being retained locally.
Absorption provides more insight into whether the industry is primarily serving a local or non-local market. Retail absorption numbers are normally higher in areas that have less
populated “retail sheds,” or geographic areas to draw consumers from. In other words, retail stores normally exist in central locations that are convenient for the largest portion of the store’s market to reach. Rural areas normally have fewer specialized stores and more general stores, and urban areas have more specialized stores because there are more
www.economicmodeling.com
people to purchase the specialized goods in more populated areas. On its own, the retail absorption figure will not indicate much other than the population of the region, but when combined with consumption it can be very telling.
Consumption is a measure of how much is spent on each industry, locally or otherwise, by individuals in a region. The consumption figure builds on our understanding of regional demand by adding in a measure of how much consumers are spending not just in the region but out of the region as well. When this figure is included we can begin to see the demand for artistic items and services, regardless of whether the industries that disseminate them are nearby. If these data were analyzed closely one would find that populations in certain areas spend an unusually high amount of their personal income on artistic products, and other populations choose to spend their money on other items. In some cases consumption follows closely with regional sales by industry, and in other cases it does not. If an area also happens to have a fairly significant cluster of artistic employment it could rightly be called an artistic creative region, regardless of the sales of artistic items in the region.
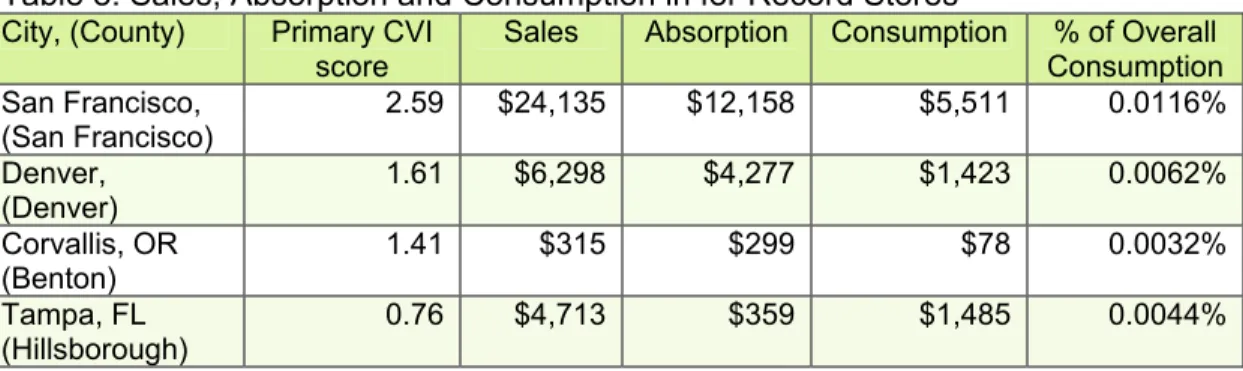
To illustrate the above concepts Table 8 contains the sales, absorption, and consumption figures for record stores in several counties in the U.S. Two of the regions, San Francisco and Denver, are from our creative artistic geography index and the other two, Benton County, Oregon and Hillsborough County, Florida, are not.
Table 8: Sales, Absorption and Consumption in for Record Stores
City, (County) Primary CVI score
Sales Absorption Consumption % of Overall Consumption San Francisco, (San Francisco) 2.59 $24,135 $12,158 $5,511 0.0116% Denver, (Denver) 1.61 $6,298 $4,277 $1,423 0.0062% Corvallis, OR (Benton) 1.41 $315 $299 $78 0.0032% Tampa, FL (Hillsborough) 0.76 $4,713 $359 $1,485 0.0044%
As expected, the sales numbers are higher for those cities with larger populations and the absorption numbers become proportionally higher as the population of the city decreases. The key indicator of demand here is the final column, % of Overall Consumption. This percentage displays which portion of the residents’ total spending goes towards record stores. This figure seems to mirror the concentration of artistic workers except when comparing Tampa and Corvallis. The percent of overall consumption figure is higher for Tampa than it is for Corvallis, Oregon, even though Corvallis has a higher concentration of artistic workers. This provides some evidence for the theory that higher concentration of artistic employment is not always positively correlated with regional demand for artistic goods. Further analysis needs done to fully understand the relationships between these figures, but the preliminary analysis demonstrates that this would be a worthwhile endeavor.
www.economicmodeling.com
Industries for Further Analysis
As mentioned in the introduction, the current CVI heavily favors retail-arts industries while under-representing service-arts industries. The outcome of this is that areas with stronger performing-arts clusters will be overlooked, while a bias is granted towards regions with a stronger retail-arts cluster. To capture both sides of this industry we must recognize that there are two types of arts proliferating industries: those that sell goods, and those that sell services. Retail industries typically sell artistic goods at either a physical or virtual hub—this includes items such as books, sculptures, MP3s, etc. Then there are industries that sell a service or experience that is consumed at the performance location—this includes services such as ballets, museums, concerts, etc. The current CVI highlights retail-arts industries fairly well, although a few more could potentially be added to this mixture. However, the area most under-represented in the current CVI is the service-arts industries.
Retail-arts Industries
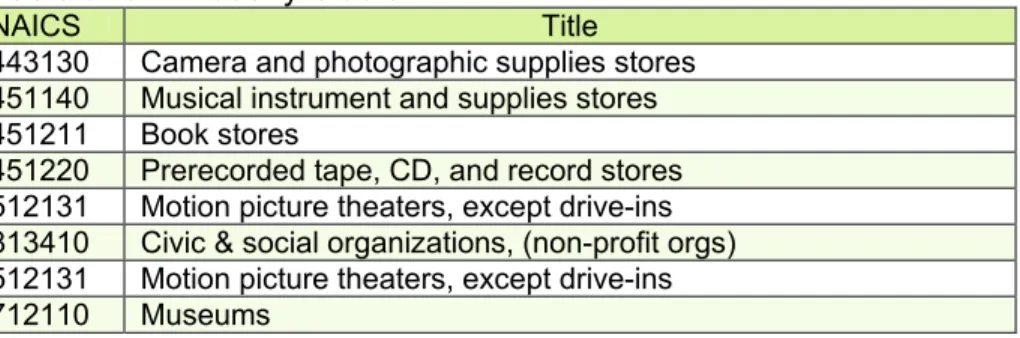
The CVI calculates the sales and income of eight different industries. These industries are listed in Table 9.
Table 9: CVI Industry Cluster
NAICS Title 443130 Camera and photographic supplies stores 451140 Musical instrument and supplies stores 451211 Book stores
451220 Prerecorded tape, CD, and record stores 512131 Motion picture theaters, except drive-ins 813410 Civic & social organizations, (non-profit orgs) 512131 Motion picture theaters, except drive-ins 712110 Museums
There are several retail-arts industries that promote art to the same degree as those listed above. A list of these industries is included in Table 10. A quick look at regional and national sales data for these industries shows that there can be vast differences in the sales of the proposed industries from place to place. These two industries are unique, in that more than the other retail-arts industries they tend to cluster in areas of high artistic creativity. In regions like San Francisco and New York, retail sales in these two industries surpass sales in all of the current CVI industries. However, in regions with a more moderate arts culture, the sales are more comparable with the other retail industries.
Table 10: Proposed Retail-arts Additions to the CVI
NAICS Title
711410 Independent artists, writers, and performers 453920 Art dealers
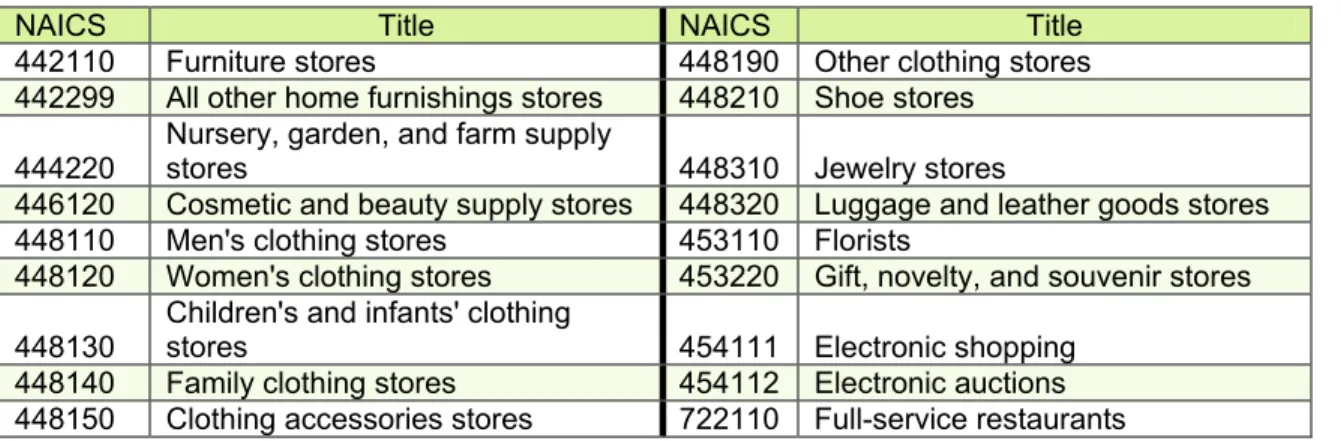
There are a number of other industries that certainly do sell artistic products, but their content is too intermixed with other types of consumer products to be classified as artistic. Industries in this group include such things as furniture stores, restaurants, and clothing stores. If there were a way to break out the artistic retail component of these industries it
www.economicmodeling.com
would be a legitimate component of the CVI, but if the types of products sold at these establishments cannot be differentiated, they should not be included. A full list of such industries is included in Table 11.
Table 11: Partial Retail-arts Industries
NAICS Title NAICS Title 442110 Furniture stores 448190 Other clothing stores 442299 All other home furnishings stores 448210 Shoe stores
444220
Nursery, garden, and farm supply
stores 448310 Jewelry stores
446120 Cosmetic and beauty supply stores 448320 Luggage and leather goods stores 448110 Men's clothing stores 453110 Florists
448120 Women's clothing stores 453220 Gift, novelty, and souvenir stores 448130
Children's and infants' clothing
stores 454111 Electronic shopping 448140 Family clothing stores 454112 Electronic auctions 448150 Clothing accessories stores 722110 Full-service restaurants
Service-arts Industries
Service-arts industries comprise those establishments that produce an artistic experience and not durable products. With the exception of museums and theaters, all of the retail industries listed in Tables 10 and 11 aim at selling tangible products that the consumer is intended to enjoy away from the site where they were purchased. Industries in the service-arts category do occasionally produce tangible materials in the form of souvenirs. However, they primarily produce a service that is enjoyed at the performance establishment. As with the proposed retail-arts additions listed in Table 10, these industries tend to cluster in areas of higher artistic creativity. Therefore, one would expect sales to be much higher in these industries at artistic hubs and much less in moderately-artistic areas.
Table 12: Proposed Service-arts Additions to the CVI
NAICS Title 711110 Theater companies and dinner theaters 711120 Dance companies
711130 Musical groups and artists 711190 Other performing arts companies
Just as with the Retail-arts industries, there are some other industries that owe a portion of their sales to arts. These Industries are listed in Table 13.
Table 13: Partial Service-arts Industries
NAICS Title 711310 Promoters with facilities
711320 Promoters without facilities
711410 Agents and managers for public figures
These industries work with those primary arts-producing individuals but also with other individuals. The first two industries comprise establishments engaged in organizing and
www.economicmodeling.com
managing live events, such as concerts, dances, festivals, and sporting events. The second industry comprises those individuals who represent and manage artists, athletes, and public figures. If there were a way to separate artistic and non-artistic sales in these industries they could be utilized in the CVI, but if not they would only skew the analysis.
Intermediary-arts Industries
Besides the direct retail and service industries, there is a third class of artistic industries that produce intermediary goods and services. These commodities are typically sold to another industry before they are sold to the ultimate consumer. This would include most of the professional and technical services that work in creative fields, such as architecture and design businesses. A list of these industries is provided in Table 14.
Table 14: Intermediary Service-arts Industries
NAICS Title 541310 Architectural services
541410 Interior design services 541420 Industrial design services 541430 Graphic design services
541490 Other specialized design services 541810 Advertising agencies
541820 Public relations agencies
Questions for further analysis
The use of sales data in determining the strength of creative economy has its limitations. Certain regions, particularly those with more discretionary income, can have a large appetite for artistic retail goods such as music, art and books, even if these products are not
produced locally. Therefore, focusing too much upon retail sales could cause the CVI to favor more wealthy areas, not necessarily more artistic areas. Additionally, focusing too much on retail sales could skew the results to favor those artistic businesses and individuals that have an available market outlet, or who sell their products for a higher price, neither of which necessarily indicates a greater presence of artistic culture. There may be other measurements that are more indicative of regional creative economy, but in EMSI’s brief analysis we were unable to find any that were as accurate as employment and the various permutations of sales data.
www.economicmodeling.com
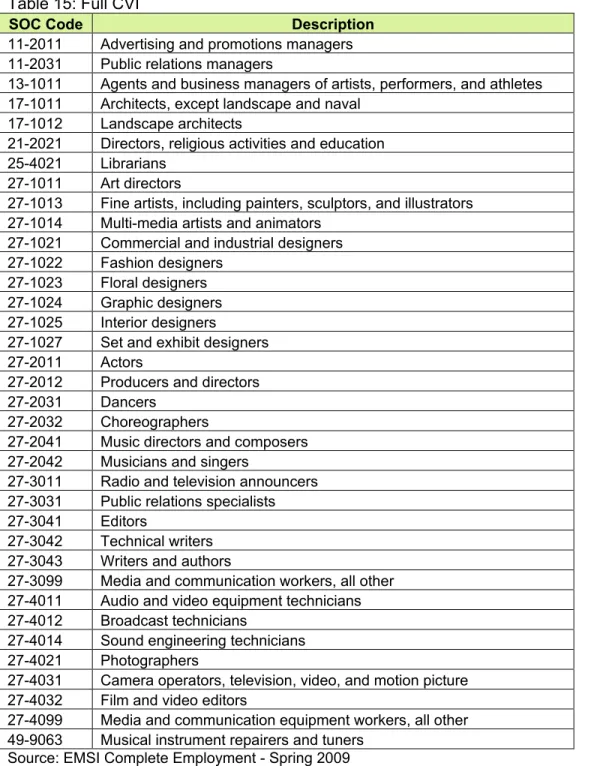
Appendix: CVI occupations
Table 15: Full CVI
SOC Code Description
11-2011 Advertising and promotions managers 11-2031 Public relations managers
13-1011 Agents and business managers of artists, performers, and athletes 17-1011 Architects, except landscape and naval
17-1012 Landscape architects
21-2021 Directors, religious activities and education 25-4021 Librarians
27-1011 Art directors
27-1013 Fine artists, including painters, sculptors, and illustrators 27-1014 Multi-media artists and animators
27-1021 Commercial and industrial designers 27-1022 Fashion designers
27-1023 Floral designers 27-1024 Graphic designers 27-1025 Interior designers
27-1027 Set and exhibit designers 27-2011 Actors
27-2012 Producers and directors 27-2031 Dancers
27-2032 Choreographers
27-2041 Music directors and composers 27-2042 Musicians and singers
27-3011 Radio and television announcers 27-3031 Public relations specialists 27-3041 Editors
27-3042 Technical writers 27-3043 Writers and authors
27-3099 Media and communication workers, all other 27-4011 Audio and video equipment technicians 27-4012 Broadcast technicians
27-4014 Sound engineering technicians 27-4021 Photographers
27-4031 Camera operators, television, video, and motion picture 27-4032 Film and video editors
27-4099 Media and communication equipment workers, all other 49-9063 Musical instrument repairers and tuners
www.economicmodeling.com
Table 16: Primary CVI
SOC
Code Description
17-1011 Architects, except landscape and naval 17-1012 Landscape architects
27-1011 Art directors 27-1013
Fine artists, including painters, sculptors, and illustrators
27-1014 Multi-media artists and animators 27-1021 Commercial and industrial designers 27-1022 Fashion designers
27-1023 Floral designers 27-1024 Graphic designers 27-1025 Interior designers
27-1027 Set and exhibit designers 27-2011 Actors
27-2012 Producers and directors 27-2031 Dancers
27-2032 Choreographers
27-2041 Music directors and composers 27-2042 Musicians and singers
27-3011 Radio and television announcers 27-3041 Editors
27-3042 Technical writers 27-3043 Writers and authors 27-4021 Photographers
Table 17: Secondary CVI
SOC
Code Description
11-2011 Advertising and promotions managers 11-2031 Public relations managers
13-1011
Agents and business managers of artists, performers, and athletes
21-2021 Directors, religious activities and education 25-4021 Librarians
27-3031 Public relations specialists
27-3099 Media and communication workers, all other 27-4011 Audio and video equipment technicians 27-4012 Broadcast technicians
27-4014 Sound engineering technicians
27-4031 Camera operators, television, video, and motion picture 27-4032 Film and video editors
27-4099 Media and communication equipment workers, all other 49-9063 Musical instrument repairers and tuners