AssetGen Connect
IT Inventory, Space and Connectivity Management
Automated Visio™ diagramming reduces workload and errors
Find any device and it’s connectivity (LAN/WAN/SAN/Power) quickly
Reduce cost and risk of implementing infrastructure changes
What is AssetGen Connect?
AssetGen Connect is designed to manage the physical aspects of IT infrastructure and can support data centres, networks, cabling, office buildings, etc. It combines hardware inventory with positioning and connectivity so the location of any hardware component can be easily found, as well as dependencies and single points of failure. AssetGen Connect also automates the production of Visio diagrams of floor plans, racks, networks and architecture views. It complements other information sources such as monitoring tools and workflow systems and trusted sources such as recovery documents, maintenance spreadsheets, etc.
The diagram on the right shows how we combine physical change updates with existing data and produce multiple outputs. A new server install may result in changes to
1. Inventory listings
2. Rack and floor plan capacity 3. Rack layout diagrams 4. Patch panel connections 5. Network switch connections 6. Power strip connections 7. Network diagrams 8. Storage diagrams 9. Domain diagrams 10. Capacity reports 11. Change audit trails
With AssetGen Connect this one action would support all changes to all these different documentation types – with consistency in data and formatting. The only way to easily maintain complex technical infrastructure documentation that can be trusted!
Desktop and Server Versions
Different versions and licencing options are available to suit many different infrastructure documentation requirements.
Desktop Version
Internal teams – network, server, power
Small and medium IT environments
Auditing and inventory projects
Local infrastructure responsibility
Handover or commissioning documentation
Infrastructure transformation projects
Server Version – Client and web interfaces Data centres, campus and office environments
NOC (Network Operations Centre) or Operations bridge
Deployment planning and MAC (moves, adds, changes)
Outsourcing and out-tasking where formal change documents are required
The server version includes the Connect Web Interface so multiple users (with sufficient rights) can view and update changes to the infrastructure. Licence options are covered at the end of this datasheet.
Physical Changes
Location and position
Resource reservation for projects Physical connectivity
Audits and manual data gathering Adds, moves and changes
AssetGen Connect Visio Visio Excel Visio AssetGen Outputs Capacity management – space, power, connectivity
Inventory extracts Custom reporting Physical plans Floor and rack diagrams
Topology diagrams Networks, power, storage Architecture diagrams SPOF, Resilience Change impact analysis – impact, risk, auditing
Updates Outputs Updates References Word Trusted sources Discovery systems Monitoring tools Service desk CMDB
Spreadsheets– risk, contracts Recovery plans
Project handover
Excel Visio
dB
Desktop Version Multi-User Server Version
Connect Professional Connect Web Application PC MS SQL Database Visio MS SQL Database Connect Professional Visio PC Windows Server PC Web Browser
AssetGen Connect
Finding Equipment and Connectivity Quickly
Key to AssetGen Connect is the ability to find equipment and understand connectivity. This screenshot of a network switch shows the location (Rack 01-01) and the end point network connections in one click.
Complex hardware devices such as blade systems, core network switches and Unix systems can be documented within AssetGen for build management. Connectivity options include single path analysis, end to end connections (as above) and full device connectivity with all paths and cable labels. As well as making it easy to find equipment, we can make it simple to check data and power connectivity using the different reporting formats.
Importing and Exporting Infrastructure Data
We have made it easy to populate and update infrastructure data within AssetGen Connect to cope with occasional and local data updates, as well as automated feeds. All changes to equipment attributes have the date and user details modified automatically. Any changes in data are entered into audit logs for internal controls, as well as guarding against data errors from automated sources.
Infrastructure data can be filtered and exported on a regular or ad hoc basis for project and
operational reporting. For instance.
Rack space by production, test, DR
Billing for power used by customers
Network ports used by customer
Actual and planned rack allocation
Disaster recovery coverage
Project build lists
Network capacity by zone, business unit
Export settings can be saved for management reporting as templates – giving great flexibility in use. There is an Search location,
type, status, label, attributes, etc
MRU (most recently used) list
by user login
Ports colour coded for connection status and faults
Advanced planning / change
impact features Visio diagram
creation and maintenance
Equipment naming, position,
status
Equipment attribute viewing
and updating
Recovery plans, photos, trusted
documents
Business and software change
impact
Audit trail of all changes to device
End point connections from
device ports
Click on device or port to see more
detail Equipment
selected ordered by rack position
AssetGen Connect Spreadsheets
Discovery & Audit
Monitoring Systems
Asset Systems
Service Desk
Spreadsheet Outputs
Rack Capacity Equipment Inventory Equipment Connectivity Equipment Port Utilisation
AssetGen Connect
Automated Visio Floor Plans and Rack Diagramming
Let us draw Visio rack diagrams for you! Select one or multiple racks, hit run – done. Adding a new piece of equipment to a rack, then producing an updated Visio rack diagram will take around 15 seconds. The screenshot below shows that you have many options for creating rack and floor plan diagrams for project and operational needs.
To make maximum use of Visio data graphics features for capacity dashboards we embed details such as the power and current used within racks, making it easy to spot overloads and risks.
Visio floor plan with data graphics for capacity, power feed and function Rack diagram with IP addresses
Whether you want to produce a diagram quickly as part of a project change, or maintain large numbers of physical infrastructure diagrams AssetGen Connect will save 100s or 1000s of man hours. These Visio diagrams can be saved onto an intranet portal with the shape data and web hyperlinks back to the server version preserved.
Draw a Visio diagram using the
current settings
Filter racks by customer, function,
zone, row, etc. Calculations
capacity of power, current, cost
Create new diagram or update an existing one
Add shape data automatically and
web hyperlinks
Choose the Visio template for desired
output styling
Select single or multiple racks for
projects Select all racks for operations diagrams
Exclude unnecessary detail such as blanking plates
Calculate spare patch connections
AssetGen Connect
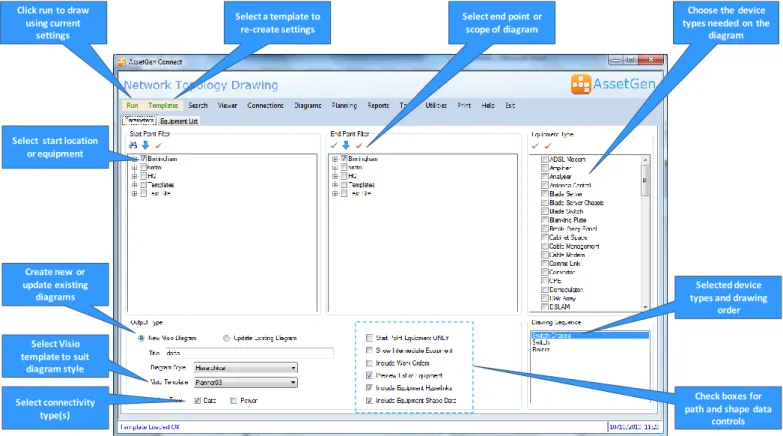
Automated Visio Network, Power and Other Topology Diagrams
We can help you quickly draw and maintain topology diagrams to suit many needs as the AssetGen system records device connectivity. This screenshot explains some of the many options we provide for topology diagrams that could be focused on LAN, WAN, SAN, power, video, voice, etc. or a combination of them all. The settings chosen can then be saved as a template and re-used for diagram checking and maintenance.
Topology maps of the following types can all be created and maintained from the same AssetGen source.
LAN building diagrams WAN diagrams showing site connectivity Campus LAN connectivity
Single device connectivity Multi-device diagrams eg. DMZ Critical system links
Server LAN/SAN connectivity Single points of failure & resilience SAN storage diagrams
Backbone and floor cabling Power distribution Video and CCTV
End to end paths Chassis/card connectivity Network zones
You choose - Network only topology diagrams or …. Network overview with server connections or…. Both!
The time saved gathering the knowledge, transferring the data to the diagram and then laying out for readability is huge. And then management want it updated every week! AssetGen Connect offers a better way for maintaining
Click run to draw using current
settings
Select end point or scope of diagram Select a template to
re-create settings
Choose the device types needed on the
diagram
Select Visio template to suit
diagram style Select start location
or equipment
Check boxes for path and shape data
controls Selected device types and drawing
order Create new or
update existing diagrams
Select connectivity type(s)
DMZ & Internet Access
BT Wan Service VT Wan Service
SW-BHAM-13 SW-BHAM-14 SW-BHAM-19
Live 10.0.0.32 Firewall
FW-BHAM01 FW-BHAM02 FW-BHAM04VPN SW-BHAM-11 SW-BHAM-12
RTR-BHAM-08 RTR-BHAM-07
RTR-BHAM-03 RTR-BHAM-04
BT-NTU2 BT-NTU3 VT-NTU1 VT-NTU2
SW-BHAM-CORE1 SW-BHAM-CORE2
SW-BHAM-01 SW-BHAM-03 SW-BHAM-05 SW-BHAM-06
AssetGen Connect
Deployment Planning
Finding available space for servers, switches and other devices can be simplified by using the cabinet search facility. Allocating space may involve selecting cabinets on the basis of any, or all, of the following criteria:
Location – building, rooms
Cabinet function - server, network, storage
Network Zone - internal, internet, customer, DMZ
Connectivity - copper, fibre, power
Power – limits, rated, design, actual (value or %)
Zoning – Cooling zone limits
AssetGen Connect makes it easy to use any of these criteria in one simple process. The results shown on the right are a list of suitable cabinets, with each existing layout displayed.
Once created, the search criteria for a standard component can be saved as a template for re-use by anyone. Finding suitable cabinets for standard platforms then only takes a few seconds. Simple, quick and easy.
Change Impact Analysis
Predicting the impact of a change or fault within a modern data centre is not easy. If a core switch has 200 ports, how long does it take to identify the business impact of a change? Our batch impact analysis feature reduces the burden of analysing typical changes involving IT infrastructure. For example;
Power downs –room, cabinet, PDU, breakers
Re-booting core LAN and SAN switches
Platform or technology upgrades
Firmware or OS patches on infrastructure
Fault impact assessment
Risks with moving cabinets or equipment
This change impact analysis combines environment, inventory, connectivity and service dependencies – unique to the
AssetGen range. The screen shot shows both the servers and
the business service impacts (provided with AssetGen SysMap) of a PDU power down in a data centre.
Infrastructure Reporting
Reporting can be as simple or extensive as you wish. A runtime version of the industry standard reporting engine (Crystal Reports) is supplied with both desktop and server versions to help produce reports and save in different formats. Reports included with both desktop and server versions include:
1. Audit trails by location, device and user access
2. Cabinet capacity with inventory, space, connectivity and power 3. Equipment inventory, status, port usage, partial connections
4. Forward schedule of changes and work orders (server version only)
Over 30 reports are included as standard with AssetGen covering most common reporting requirements for system administrators and users. Filtering can be applied as required so a single report on port usage can be applied to multiple locations and equipment types.
AssetGen Connect
AssetGen Connect / SysMap Integration
If AssetGen SysMap is also installed on the same desktop or server platform, then users can quickly understand the system or service impact of a physical infrastructure change. When planning or communicating device changes, it’s important to know who is impacted for change management. Integration features include:
Device impact analysis
Multi-device (or batch) impact analysis
AssetGen Connect attributes visible from within SysMap
Visio diagrams can have both Connect and SysMap web hyperlinks automatically inserted (server only) AssetGen SysMap is licenced and installed separately.
.
AssetGen Connect Licencing and Options
AssetGen Connect is available in desktop and server versions.
Desktop version
The desktop version licence is based on the number of equipment items recorded in the
AssetGen Connect Professional database. There is no limit on the numbers of ports or connections.
Server Version
The multi-user server version AssetGen Connect is licenced by the numbers of sites and buildings. There is no restriction on the numbers of devices, ports or connections recorded. There is no user restriction for
web browser access. The server version comes with one AssetGen Connect Professional client – additional clients need to be purchased for extra “power users” or administrators.
To understand more about AssetGen Connect Professional licencing and upgrades between versions, please contact your sales distributor listed below.
Desktop and Server Platform Requirements
AssetGen software is designed to work with standard Microsoft environments for both desktop and servers. For the Visio data graphics feature MS Visio 2007/10 Professional (not supplied) is recommended.
The desktop version is supported on Windows XP, Vista and Windows 7. The recommended server platform is Windows Server 2003/8 and SQL Server 2005/8. For browser access Internet Explorer V6 and above is recommended. Please refer to the technical FAQs on our web site for more details.
All trademarks acknowledged
Developed by: Sales Distributor:
AssetGen Ltd Tel: +44(0) 8707 770717 Square Mile Systems Ltd Tel: +44 (0)870 950 4651
AssetGen Connect 500 500 devices
AssetGen Connect 1000 1000 devices
AssetGen Connect 2000 2000 devices
AssetGen Connect Unlimited Unlimited number of devices
Single site Single site, single building
Campus Single site, multiple buildings