E
ndowment
F
oundation
Durham Shared Maths Project
Evaluation report and Executive summary
July 2015
Independent evaluators:
Cheryl Lloyd, Triin Edovald, Stephen Morris, Zsolt Kiss, Amy
Skipp, Sarah Haywood (NatCen Social Research)
The Education Endowment Foundation (EEF) is an independent grant-making charity dedicated to breaking the link between family income and educational achievement, ensuring that children from all backgrounds can fulfil their potential and make the most of their talents.
The EEF aims to raise the attainment of children facing disadvantage by:
• Identifying promising educational innovations that address the needs of disadvantaged children in primary and secondary schools in England;
• Evaluating these innovations to extend and secure the evidence on what works and can be made to work at scale;
• Encouraging schools, government, charities, and others to apply evidence and adopt innovations found to be effective.
The EEF was established in 2011 by the Sutton Trust, as lead charity in partnership with Impetus Trust (now part of Impetus-The Private Equity Foundation) and received a founding £125m grant from the Department for Education.
Together, the EEF and Sutton Trust are the government-designated What Works Centre for improving education outcomes for school-aged children.
For more information about the EEF or this report please contact: Robbie Coleman
Research and Communications Manager Education Endowment Foundation 9th Floor, Millbank Tower
21-24 Millbank SW1P 4QP
p: 020 7802 1679
About the evaluator
The project was independently evaluated by a team from NatCen Social Research. The impact evaluation was led by Cheryl Lloyd who was assisted by Triin Edovald, Stephen Morris, and Zsolt Kiss. The process evaluation was designed and overseen by Amy Skipp, with Sarah Haywood managing the qualitative strand of the project, assisted by Fay Sadro.
A team from the University of Bristol, led by Paul Clark managed the evaluation project through set up and randomisation for the trial.
NatCen would like to thank Emily Tanner, Eloise Poole and Gemma Lewis for their support and contribution to the project, as well as all the schools who gave up their time to participate in our interviews.
Contact details:
Emily Tanner
Head of Children, Families & Work NatCen Social Research
35 Northampton Square London
Tel: 0207 549 8580
Contents
Executive summary ... 3
Introduction ... 5
Methodology ... 9
Impact evaluation ... 21
Process evaluation... 37
Conclusion ... 49
References ... 52
Appendix A: Parent information sheet ... 53
Appendix B: Parent opt-out letter ... 54
Appendix C: Main analysis of primary outcome... 55
Appendix D: Subgroup analysis of primary outcome ... 57
Appendix E: Analysis of secondary outcome: Attitudes towards school ... 69
Appendix F: Analysis of secondary outcome: Attitudes towards reading ... 75
Appendix G: Analysis of secondary outcome: Attitudes towards maths ... 81
Appendix H: Security classification of trial findings ... 87
Executive summary
Shared Maths is a form of cross-age peer tutoring, developed at Durham University, where older pupils (Year 5/Year 6) work with younger pupils (Year 3/Year 4) to discuss and work through maths problems using a structured approach. The intervention structures interactions between the two pupils to enable the younger pupils (the tutee) to find solutions to maths problems. The older pupils (the tutor) use strategies such as questioning, thinking out loud, praise, and reviewing strategies to gain a deeper understanding of mathematics.
The intervention was delivered by teachers, with training and support from a Local Co-ordinator in each of four participating local authorities (Leeds, Medway, Durham and Worcester). Participating pupils spent 20 minutes each week using the approach, for two blocks of 16 weeks over consecutive years.
An effectiveness trial assessed the impact of the project on the progress in terms of mathematics of 6,472 pupils (3,305 in Year 3 and 3,167 in Year 5) in 82 primary schools across four local authorities with 40 schools randomly allocated to receive the programme and 42 schools allocated to the control condition. The control schools received the intervention after the intervention schools had completed the project.
Key Conclusions
1. This evaluation does not provide any evidence that the Durham Shared Maths programme had an impact on attainment in maths, when used with Year 5 and 3 pupils.
2. There is no quantitative evidence of any impact on the attitudes towards school, reading and maths for both Year 3 and Year 5 pupils who participated in the Shared Maths programme. 3. The process evaluation revealed teachers’ views that pupils with EAL, SEN and lower ability
were particularly struggling with the intervention. Teachers did not feel well equipped to support these pupils in accessing the intervention.
4. Teachers reported a number of wider perceived benefits from using Shared Maths - such as improvements in confidence in maths, approaches to problem-solving and social skills. These benefits may in time help support improvements in learning, and transfer to other lessons, although further work is needed here.
5. Given the concerns expressed by teachers about lower ability pupils finding adherence to the programme challenging, Shared Maths could benefit from further tailoring of the content and delivery to be better suited for pupils with different abilities prior to further testing.
What impact did it have?
There is no evidence from this evaluation that the Durham Shared Maths intervention had an impact on the maths attainment (primary outcome) of participating pupils, as well as on attitudes towards school, maths and reading (secondary outcomes) of participating pupils, measured using Interactive Computerised Assessment System (InCAS) scores, compared to those in the control group.
Interviews with participating teachers and the Shared Maths delivery team suggested that there were minor differences in the way the programme was implemented (for example the format and content of training for teachers and pupils) although such differences can be expected considering the scale and context of intervention delivery. Furthermore, it has to be noted that teachers had to fit the intervention to their existing schemes of work.
Although teachers perceived the programme to be benefitting pupils in terms of their confidence in maths, approaches to problem-solving and social skills, there were concerns about the accessibility of the intervention for lower ability pupils and pupils with English as an Additional Language (EAL) or Special Educational Needs (SEN).
How secure is this finding?
This evaluation was set up as an effectiveness trial to test the impact of Shared Maths with Year 5 and Year 3 pupils, delivered with the developer leading the recruitment and retention of the schools, but with the training and support for the intervention managed by Local Co-ordinators. Effectiveness trials aim to test the intervention in realistic conditions in a large number of schools.
This was a clustered Randomised Controlled Trial (RCT), with 82 schools, across four local authorities, randomly allocated to receive the intervention (40 schools) or continue teaching as usual (42 schools). At the end of the intervention period all pupils were asked to complete the Interactive Computerised Assessment System (InCAS) standardised maths test, as a measure of general maths ability.
The study was a large and well-conducted study, designed to detect a minimal effect size of 0.10. There was a low level of school drop out from the project (3 schools dropped out, or 4%) and this was from both the control and intervention groups, suggesting that it did not introduce selection bias. The testing was administered by the schools and the delivery team and therefore, in accordance with the EEF padlock guidance, this reduced the padlock rating to 4.
The process evaluation indicates there was some variation in the way the programme was delivered and how successfully pupils adhered to the Shared Maths approach, although a degree of variation could be expected with a large-scale delivery of the intervention in a real life setting.
Overall, this indicates the findings are moderate to highly secure.
How much does it cost?
The Durham Shared Maths intervention included costs for Local Co-ordinators, teacher training and resources associated with delivering the programme. Overall, the total cost of the programme per 16 week block is £660 per school. This translates into a unit cost of £8.25 per pupil per academic year.
Note. Effect sizes are converted to months’ progress on the basis of Table 1 in Higgins, et al. (2013).
Group Effect
size
Estimated months’ progress
Security rating Cost
Intervention vs. control (Year 3) 0.01 0 £ Intervention vs. control (Year 5) 0.02 +1 £ Free School Meal pupils (Year 3) -0.05 –1 – – Free School Meal pupils (Year 5) 0.05 +1 – –
Security rating awarded as part of the EEF peer review process
Introduction
Durham Shared Maths is a cross-age peer tutoring pedagogy which seeks to improve maths learning for all children taking part. The intervention pairs older (Year 5/Year 6) pupils (tutors) with younger (Year 3/Year 4) pupils (tutees) to discuss and work through maths problems using a structured approach. The approach aims to help both ‘tutors’ and ‘tutees’ gain a clearer and deeper understanding of the maths problem and from that, the path to the solution. The intervention is delivered in the classroom and fits within the existing and ongoing maths teaching, rather than providing an alternative scheme of work.
The Shared Maths intervention is a modified version of the Duolog Maths tutoring model developed by Prof Keith Topping and tested at scale in the Fife Peer Learning Project in Scotland. This model requires the tutor to encourage the tutee to solve maths questions with high emphasis on developing metacognitive awareness of the processes and strategies being utilised (Topping, et al., 2004). The older pupils use strategies such as questioning, thinking out loud, praising and linking the questions to real life situations to help their tutee reach the answer and gain a deeper understanding of the maths problem. The method aims to highlight the different methods that can be employed when doing maths for both the tutee and tutor.
The Durham Project team behind the Shared Maths handbook, produced for the teachers taking part in this project, theorise that the Shared Maths process should be effective at raising maths attainment for both tutees and tutors. For tutees, the Shared Maths approach allows individuals to work through problems at their own level with the tutor prompting them to think more deeply about what the question is asking and about strategies for answering. The tutee receives immediate feedback and is able to seek help from a peer who is able to explain the process in a different way from the teacher. It also encourages the tutee to verbalise their thinking making them more aware of the processes they are using. Praise and feedback encouraged by the process help to build tutee’s confidence in maths. Tutors also benefit from the process as they need to understand and solve the questions ahead of the tutors and think of ways in which they can guide their tutee to a solution. This can help tutors to consolidate and build on previous learning and may also present them with new strategies not previously considered. The questioning skills developed through the intervention may also improve their own self-questioning and problem-solving behaviour. Being given a tutoring role also improves the confidence and self-concept of the tutors.
The intervention involves all pupils across Year 3 and Year 5 paired together (or occasional trios) on the basis of their relative maths ability in their classes.1 Shared Maths lessons take place for 20 minutes each week over two 16 week blocks, one in each academic year. The questions to be solved during the lessons are set by the Year 3 class teacher to be appropriate to the Year 3 pupil’s current maths work and level of ability. At the start of the intervention all pupils are trained by teachers in how to solve problems using the Shared Maths process and the pupils’ roles.
Schools from four local authorities took part in the trial; Worcestershire, Leeds, Durham and Medway. As this project is an effectiveness trial aiming to look at how the Shared Maths intervention could be delivered at scale, teachers were trained and supported in their implementation of Shared Maths by four independent local consultants recruited by the developer team (Shared Maths coordinators). Two of the consultants were employees of the local authorities and two were independent Maths consultants. The consultants received training from the developer team at the beginning of the project and attended additional training days through the project. The four consultants delivered training sessions for teachers involved (two sessions each year) and monitored Shared Maths practice
1
At the start of the Shared Maths programme pupils were in Years 3 and 5 and progressed to Years 4 and 6 respectively by the end of the programme, throughout this report pupils are referred to as in Years 3 and 5 only throughout the report.
through visits to all schools to observe lessons and provide feedback to the school and the developer team (once a year). Teachers in participating schools received a detailed programme handbook which included classroom prompts and resources as well as access to the Shared Maths website with video examples of Shared Maths practice.
Background evidence
Many research studies have looked at the peer tutoring process and how effective it is at raising attainment as well as improving social and emotional outcomes. The results of these studies have been brought together by researchers in meta-analytic reviews which summarise findings from a variety of different sources. The evidence for peer tutoring tends to be positive, with reviews showing that peer tutoring is an effective technique for raising attainment in school-aged children, particularly with younger pupils across different subjects including maths, literacy and science – with tutoring in maths being particularly effective (Cohen, Kulik & Kulik, 1982; Rohrbeck, et al., 2003).
A recent meta-analytic review by the Washington State Institute for Public Policy (WSIPP) (Pennucci & Lemon, 2014) explored the effects of both cross-age and same-age/classwide peer tutoring.2 The results of respective meta-analytic reviews indicated that both types of programmes had a positive effect on participant test scores. However, the strength of the evidence was found to be stronger for same-age and classwide peer tutoring when compared cross-age peer tutoring in the WSIPP inventory of evidence- and research-based practices. The meta-analytic review on cross-age peer tutoring included only two relatively old studies (1980 and 1983) that included limited information on the demographic characteristics of the pupils (for further details on the criteria applied to included studies please see Pennucci & Lemon, 20143).
Looking at maths peer tutoring, reviews (e.g. Britz, Dixon & McLaughlin, 1989; Robinson, Schofield, & Steers-Wentzell, 2005) have identified that these interventions have been successful at raising pupil attainment and that providing training for pupils improved the effectiveness of the tutoring. However, a more recent report by the What Works Clearinghouse in the US identified one study of peer-assisted learning strategies that meets their evidence standards (2013). The report indicated that this tutoring programme was found to have no discernible effects on mathematics achievement for elementary school students in the US.
The EEF and Sutton Trust Pupil Premium Toolkit (Higgins, Katsipataki, Coleman et al., 2014) included a review of the effectiveness of different teaching and learning strategies and concluded that based on current evidence peer tutoring was a potentially effective approach to improved attainment for both the tutors – who have to think carefully about how to explain and solve the problem – and the tutees. It also concluded that the approach should be used to supplement or enhance normal teaching, rather than to replace it.
A recent large-scale efficacy trial in Fife (Tymms, et al., 2011) developed the peer tutoring approach in primary school maths and reading and found that cross-age tutoring was more effective than
2
In the two evaluations included in the meta-analysis of age peer tutoring, the average cross-age peer tutoring programme provides 30 hours tutoring time and 7.5 hours of training time per class. In the evaluations included in the meta-analysis of same-age peer tutoring, pupils from the same classrooms provide academic assistance to struggling peers. Same-age tutoring assistance occurs through one-on-one interactions or in small groups, and in some instances, students alternate
between the role of tutor and tutee. The same-age peer tutoring programmes included in the WSIPP’s meta-analysis provide, on average, 30 hours of peer tutoring time each year and about five hours of training time for teachers and students to learn programme procedures.
3
For combined meta-analytic results on class-wide peer tutoring, peer-assisted learning strategies and reciprocal peer tutoring by WSIPP please visit the following link:
tutoring with age groups for maths. The study had some limitations, including participants and researchers not being blind to treatment allocation, loss of schools and pupils during the project, schools changing their intervention group and a differential loss to follow up among the older cohort. Despite these limitations, this is still a relatively robust study, demonstrating positive impacts of cross-age peer tutoring in mathematics when implemented in real world contexts, suggested that peer tutoring has promise when scaled up. This EEF effectiveness trial builds on this experience by delivering the programme to a large number of primary schools in four English local authorities to assess how effective it is at raising the attainment of disadvantaged pupils when implemented on a large scale and delivered by non-specialists in peer tutoring.
Evaluation objectives
The aim of the impact evaluation was to measure the impact of the Durham Shared Maths programme on the maths attainment and attitudes towards school, reading and maths of pupils receiving Shared Maths using InCAS (please see Outcomes section below for more information) by comparing their results to pupils from the control schools:
• in Year 3 (the tutees; outcomes measured in Year 4)
• in Year 5 (the tutors; outcomes measured in Year 6)
• those who are eligible for free school meals in both tutee and tutor year groups.
The aim of the process evaluation was to explore:
• Local Co-ordinators’ experiences of delivering training and supporting schools to implement the Shared Maths intervention
• Changes made by the intervention team after delivery to intervention schools was completed and delivery to control schools had not started
• The effect of these changes on programme delivery
• Teachers’ views and experiences of implementing and delivering the Shared Maths programme in their school
• Teachers’ perceptions of the impact the programme had on their pupils, them and the wider school.
Project teams
The project was run by the Durham Shared Maths Project team consisting of: Andy Wiggins - Project Lead
Vic Menzies - Intervention development and local coordinators training and support Clare Collyer – Project and trial administration
Christine Merrell - Assessment
Steve Higgins – Question / problem resources
Keith Topping (Dundee University) – Peer Tutoring methodology Jeremy Hodgen (Kings / Nottingham university) – Maths pedagogy
Allen Thurston (up to September 2012 – moved to Queen) – Intervention development Kirsty Younger (up to February 2014) – Project administration
The independent intervention delivery team consisted of Jeanette Brocks, Nicola Stevenson, John Shute and Brian Hill.
The independent evaluation was set up by a team from the University of Bristol, led by Paul Clark who managed the project through set up and randomisation for the trial. For the remaining stages of the project a team from NatCen Social Research were the independent evaluators. The impact evaluation was led by Cheryl Lloyd who was assisted by Stephen Morris, Triin Edovald and Zsolt Kiss. The
process evaluation was designed and overseen by Amy Skipp, with Sarah Haywood managing the qualitative strand of the project, assisted by Fay Sadro.
The Durham team carried out the adaption of the existing Fife Peer Tutoring model, this included adding resources for the English curriculum, tutee question selection, and local consultant training resources. They also recruited the participating schools and managed the trial (including outcome testing and data collection). The delivery team were responsible for the training and on-going monitoring and support of the teachers and schools. The evaluation team were responsible for the data analysis and telephone interviews with teachers, local consultants and Durham team.
Ethical review
Ethical approval was obtained by the Durham Shared Maths project team from the Board of Ethics in the School of Education at Durham University. This approval included the intervention development and delivery, the trial and assessment.
NatCen Social Research obtained ethical approval from its own ethics board for the evaluation, comprising the process evaluation and analysis of test results. This approval included the processes for the research team communicating with and carrying out interviews with school staff. For further details on parental consent procedures see Pupil eligibility and recruitment section below.
Methodology
Trial design
This trial was designed as a cluster randomised field trial across four different geographical areas. Primary schools that were approached and that chose to take part in the study were assigned at random, on a 1:1 basis, to either the intervention or control group. Year 3 and Year 5 pupils in intervention schools participated in the project from September 2012 to April 2014. Pupils in control schools acted as wait-list controls. The Shared Maths intervention was implemented in control schools from April 2014.
A cluster trial design was chosen to avoid the potential for contamination to occur between pupils assigned to different study arms within the same school or class: a potential concern if classes or individual pupils are the unit of randomisation rather than whole schools.
Eligibility
School eligibility and recruitment
The Durham Shared Maths team were responsible for local authority and school recruitment. In October 2011 four local authority districts were contacted and asked to take part in the trial, of which three agreed to participate. Another local authority was then approached and agreed to participate in the project. The four local authorities that agreed to take part were: Medway, Worcester, Durham and Leeds. These areas were selected on the basis of providing a good spread of schools around the country. In line with the EEF policy at the time, the strategy for the recruitment of primary schools within these local authority districts included the following aims:
1. it was intended that around 40 per cent of schools in the study sample were to be or have been below the government performance floor target threshold at some time in the last three years (i.e. 2010, 2011 and possibly 2012)4; and;
2. it was intended that schools in the study sample would be from areas of high deprivation (e.g. high proportion of FSM/low IDACI rankings).
Each local authority was asked to put forward at least 22 candidate schools for inclusion in the trial by mid-March 2012.5 The local authorities were asked to prioritise schools that were perceived as having weaknesses in maths teaching, but also had the potential and capacity to improve their maths teaching. They were also asked not to put forward schools that had recently been graded as inadequate by Ofsted or were known to be going through a period of major re-organisation (e.g. academisation). In addition they were asked not to nominate schools with more than 3 entry forms or substantial imbalance between Y3 and Y5. Actual agreement with the schools was not required at this stage.
A total of 129 nominated schools were approached by the Shared Maths team. Nominated schools were provided with an information leaflet. This set out the aims of the project, details of the assessment procedures and what the project required of schools (i.e. willingness to be randomised, to carry out computer-based testing, and to deliver the intervention for 18 months). Further detail on the timescales involved and the support available to schools from the project team were also provided in
4
For more information about floor target thresholds please see
https://www.gov.uk/government/news/primary-schools-test-results-released
5
Some local authorities provided an initial list of suitable schools that included more than 22 schools per local authority area.
the leaflet.6 Schools were invited to attend a recruitment event in their local authority area and encouraged to sign up for the study in May 2012. In total 70 schools attended one of the four recruitment events (one in each local authority).7
Following face-to-face discussions, follow-up emails and phone calls after the recruitment events, a total of 84 schools were recruited for the trial. These schools agreed to all trial procedures, including informing parents, undertaking the computerised assessments of the relevant cohorts (Year 3 and Year 5), randomisation and implementation of the intervention as allocated.
Even though 84 schools were recruited for the trial (and for randomisation), the Shared Maths project team and the original evaluators excluded two schools from the intervention arm post-randomisation that failed to complete the pre-testing in time. The two schools and their local authorities were not informed of their allocations. Thus, the final study sample consisted of 82 schools for which the data was available.
Pupil eligibility and recruitment
All Year 3 and Year 5 pupils in recruited schools were eligible to take part in the trial. School-level consent was sought for testing as this was carried out across the whole year group and the results were passed back to schools to be used for monitoring purposes8. Participating schools informed parents of all pupils in relevant cohorts about the study using an information sheet provided by the Shared Maths team (Appendix A). Parents had the opportunity to withdraw their child’s data from the analysis by responding to an opt-out letter from the Shared Maths team which was distributed by schools (Appendix B).
Intervention
Durham Shared Maths is a cross-age peer tutoring pedagogy which pairs older Year 5 pupils (tutors) with younger Year 3 pupils (tutees) to discuss and work through maths problems using a structured stepped approach. The approach aims to help both ‘tutors’ and ‘tutees’ gain a clearer and deeper understanding of the maths problem and from that, the path to the solution. The Shared Maths pedagogy seeks to promote the National Curriculum aims of fluency in maths, problem solving and encouraging mathematical reasoning and incorporates some key aspects of Ofsted guidance on best practice e.g. formative assessment and differentiation. The intervention was delivered in the classroom and was designed to fit within the existing and ongoing maths teaching, rather than providing an alternative scheme of work. Training and support for implementing the programme was provided to Year 3 and Year 5 teachers by local consultants.
The Shared Maths approach
In Shared Maths the tutee and tutor are encouraged to discuss the maths problem/question in a way that encourages them both to fully understand the problem and find the method for reaching the solution. This involves approaching each question/problem using three main steps: (1) understanding the question”, (2) finding an answer to the question and (3) finishing the question by checking, summarising and linking to other learning and real life. During the first step the pairs should read the
6
Available from http://www.sharedmaths.org/attachments/DSMP%20Info%20Sheet.pdf
7
Based on information available to the NatCen evaluation team, it was not possible to identify how many of the 70 schools that attended the recruitment events signed up for the study.
8
No parental consent was sought as Schedule 2 Item 6 of the Data Protection Act could be applied. For further details see the guidance for evaluators on gaining consent from participants for EEF evaluations:
http://educationendowmentfoundation.org.uk/uploads/pdf/EEF_guidance_for_evaluat
ors_on_consent_and_the_Data_Protection_Act_FINAL.pdf
question together, identify what the question is asking and verbalise how they plan to solve the problem. After doing this the tutee should try to solve the problem “thinking aloud” explaining what they are doing. The tutee should prompt or use questions to help the tutee to solve and better understand the question. After the pair reaches an answer they should move onto the final step which involves checking the answer, summarising they methods they used to solve the problem and discussing the problem fitted into what they already know and how the method could be used in real life. Throughout all steps the tutor should praise and encourage the tutee for making progress in solving the problem. During Shared Maths the role of the tutor is to ensure that the tutee sticks to the structured approach when solving maths questions and to encourage them to verbalise their thinking. The tutor should prompt or ask questions to help their tutee to solve the problem but shouldn’t explicitly tell their tutee how to solve the problem.
Matching pupils
Teachers were responsible for matching pairs of pupils from the participating year groups. Pupils were paired up based on their relative ability in their class which means the pupils who were most able in Year 3 were paired with those who were most able in Year 5. If teachers believed that a pair would have a difficulty working with each other (e.g. due to their personalities or social history) then the next nearest tutor could be assigned to the tutee.
If classes did not have the same number of pupils then some pupils could be grouped into ‘trios’ with two tutees to one tutor or two tutors to one tutee, depending on which class is larger. This method of grouping could also be used if levels of pupil absence were high among a group to ensure there was some consistency in tutoring. Teachers were strongly encouraged to consider personalities when putting pupils into trios.
Teaching pupils to do Shared Maths
Teachers were encouraged to train all tutors and tutees together in two sessions before starting on the programme to allow all pupils to become familiar with the key strategies, see a demonstration of these and practice them.
The programme handbook provided guidance about what should be covered and how during the pupil training sessions. In the first session, the focus was on ways to understand and solve maths questions which involved the following strategies in pairs:
• Read
• Identify
• Listen
• Question
• Think out loud; and
• Praise.
The second session included a reminder of the problem solving strategies covered in session one, followed by a focus on the following strategies:
• Check
• How did you do it?
• How could you use it?
Durham Shared Maths sessions
The pairs (or trios) of pupils spent twenty minutes each week solving maths problems together, over two blocks of 16 weeks across two academic years.
Shared Maths lessons took place during regular maths classes. Each Shared Maths lesson lasted for 30 minutes which included five minutes at the beginning and end of the lesson to get set up and move between classrooms. The Shared Maths element of the work lasted 20 minutes, starting with an introduction, 15 minutes of paired work then 3 to 4 minutes of debriefing at the end.
During the paired work teachers were responsible for monitoring the interactions in the classroom and supporting pairs where they may be struggling with either the problem or the process.
Selecting Questions/problems for pairs
The teacher of the younger class was responsible for selecting the maths questions in advance of each lesson. The handbook provided guidance on how to select appropriate questions. Questions used should be at the upper edge of the tutee’s independent maths ability level and differentiated for each pupil. They should ideally tie into work that the tutees are learning at the time.
Training for teachers
All training sessions for teachers were delivered by the local Shared Maths coordinator (and each initial session was observed by a member of the developer team). At the beginning of each block of Shared Maths the coordinators ran a 5 hour training session and all year 3 and year 5 teachers in the first year and Year 4 and Year 6 teachers in the second year in participating schools were invited to attend. This session introduced the method and background to the intervention and the reasons for doing Shared Maths. It then went into detail about the different steps in the approach and showed a video demonstrating Shared Maths in practice. The training then covered the organisational aspects of beginning Shared Maths including how to match up children, the structure of the lesson, training pupils and selecting appropriate questions. Throughout the session teachers were encouraged to reflect on the potential benefits from implementing the programme and to consider how the intervention would work in the context of their school. Teachers were encouraged to discuss any concerns or potential barriers in their schools. The session also provided time for teachers from the same school to jointly plan their implementation of the project.
A second twilight or afternoon training session was run midway through each block. At this session teachers were encouraged to reflect on how Shared Maths had been implemented in their school and discuss the benefits seen as well as any issues they were having. Discussion at the sessions focused on the specific issues that the teachers in attendance were having. There was also additional input from coordinators on judging the difficulty of maths questions and on encouraging praise and feedback.
Additionally around half way through each block the Shared Maths coordinator visited each school to observe a lesson. The teacher whose lesson was observed in each school was randomly selected by the developer team. The coordinator observed and used the Observation Schedule (included in the appendices) to record what was happening in the classroom generally and the discussion between one or two randomly selected pairs in the classroom. The information from the observation was fed back to the teacher at the end of the lesson and suggestions for development discussed. The completed observation schedule was also returned to the developer team with the permission of the teacher.
Project resources
All teachers involved were given the Shared Maths handbook which described in detail all aspects of the intervention and included copiable resource sheets designed to lead pupils through the process. Resources included the Shared Maths diagram included above, worksheets for tutors and tutees, questioning prompt cards, praise prompt cards and a tutor and tutee log sheet to reflect on learning.
Teachers were expected to choose the resources required that would be useful in their class. The handbook also contained links to other information to help teachers plan and deliver lessons.
Teachers were also given access to the Shared Maths secure website which provided video examples of the different stages of the tutoring process, links to websites where suitable maths questions might be found and contact details for the project team.
Delivery model
In each local authority there was a Local co-ordinator who was responsible for providing teacher training and on-going support throughout the project. Two of these coordinators were people already employed by the Local Authority in a teacher development role and who had time ringfenced to support the programme. The other two coordinators were private maths consultants who provided professional development to schools. All contact with schools about the intervention was done through the coordinators.
Training for coordinators
The four local coordinators attended training sessions at the beginning of the project and through the year. These sessions allowed the coordinators to share practice with each other and to feedback to the developer team on the experiences of teachers. The table below shows the dates and topics of the training sessions for coordinators.
Date Days
Training
Topics covered
June 2012 3 Shared Maths process & training for schools (day 1) The trial design and methodology (day 2)
Mentoring teachers, observing Shared Maths and providing feedback (day 3)
October 2012 1 Refresher of session 1 training for schools and discussion of foreseeable barriers for schools, input on difficulty of word problems in maths.
February 2013 1 Refresher of session 2 training for schools, classroom observations, and focus session on feedback.
October 2013 2 Feedback from team on teacher surveys, and observation data. Coordinator input on classroom practice and on useful additions to the handbook. (Day 1)
Filming, future delivery plans and engaging control schools. (Day 2) March 2014 1 Feedback on teacher questionnaires and classroom observations,
changes to the model for Phase 2 (control schools) and costs of delivery.
November 2014 1 Preliminary results of trial, implementation data, describing the coordinator role, possible case studies.
Control schools
The control group schools followed ‘business as usual’ during the trial and did not receive any Durham Shared Maths materials or training. However, it is important to note that whilst schools did not receive the programme, the delivery team were aware that at least some of the control schools
were independently making a focused effort to improve pupils’ maths attainment during the trial using other strategies.
Outcomes
Primary outcomeThe primary outcome of interest in this study was maths attainment. This became the sole focus of this analysis (see Analysis section below for further details). The Interactive Computerised Assessment System (InCAS), which is a diagnostic, computer-adaptive assessment tool (Merrell & Tymms, 2005), was used to measure pre- and post-intervention maths ability. The maths module of the InCAS assessment presents questions from several topics including number work, shape, measuring and reading graphs and charts.
The following InCAS modules were chosen for this trial to measure pupils’ mathematic attainment:
• General Mathematics
• Mental Arithmetic
These modules each provide a pupil score:
• A general maths score is provided calculated using the pupils scores from the component parts of the general mathematics module which including counting, arithmetic, problem solving, measures, shape and space and data handling.
• A mental arithmetic score based on scores from the addition, subtraction, multiplication and division modules.
For each module pupil scores are provided in raw form and converted to an age equivalent score which can be used to compare progress with their actual age. InCAS also provides age standardised scores which have a mean of 100 and a standard deviation of 15. This means that scores of between 85 and 114 are “average” with those achieving 115 or higher performing “above average” and those scoring under 85 being “below average”. (Please see Analysis section below for further details on specific scores that were used in the analysis.)
Secondary outcomes
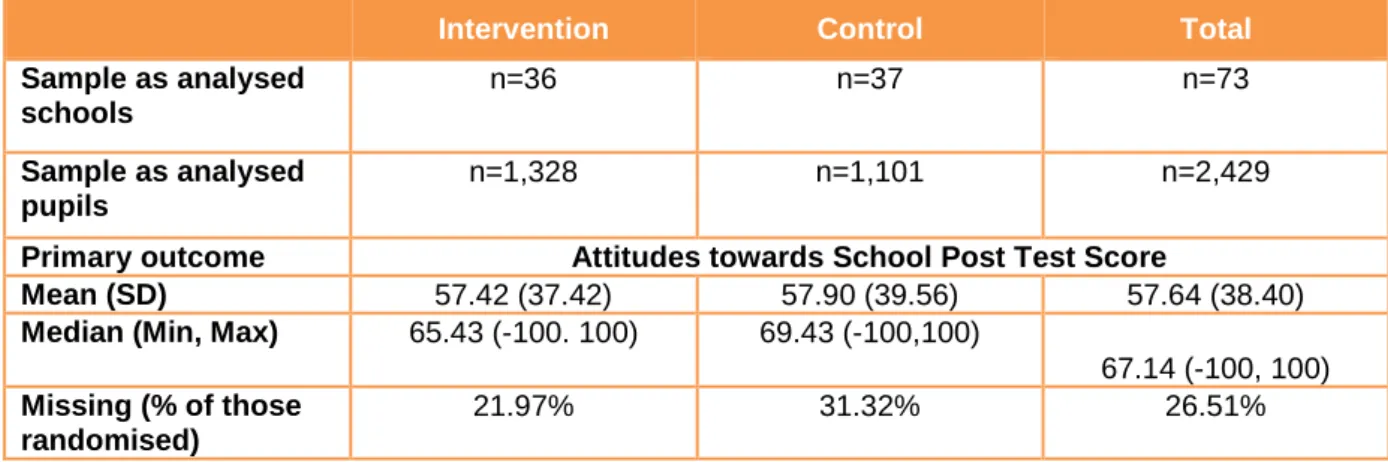
The secondary outcomes of interest in this study were reading ability, developed ability and attitudes to school which were also measured using the InCAS assessment. InCAS Reading looks at pupils’ ability to recognise words, to break them into sounds and to choose the appropriate words to complete a passage. The InCAS attitudes module asks pupils for their attitudes to Reading, Maths and school on a sliding scale. The secondary outcomes included in the analysis were attitudes to school, reading and maths (see Analysis section below for further details).
Administration of the InCAS assessment
All Year 3 and Year 5 pupils in participating schools undertook the pre-test in September 2012 to November 2012 and the follow-up test between February and March 2014. The InCAS assessment was completed on computers and administered to pupils in groups or as a class. In addition to primary and secondary outcomes, schools were welcome to complete the other modules for their own information if they wished.
The tests were administered by schools with some support from the Shared Maths team and other employees from the Centre for Evaluating and Monitoring (CEM). For example, in some instances the project team helped schools with setting up the tests and administering it to the pupils. Teachers and the Shared Maths project team were aware of the pupils’ group allocation at post-test. The test
administration varied across schools depending on the size of the school and availability of computers. Schools were instructed to deliver tests under ‘exam’ conditions. Each pupil wore headphones when taking the test as the computer presented different questions (from a bank of many thousands), depending on chance and their ability. Since InCAS is a personalised computer assessment, tailored to each individual pupil according to their age and abilities and generates an age equivalent score, the marking of the tests is automated and thus blinded to pupils treatment allocation status. Overall, children in both intervention and control schools were subject to equivalent test conditions and while some aspects of administration and support might have varied on the basis of the type and characteristics of the school, levels of support should not have varied by trial arm. The pupil data was uploaded to the CEM assessment system. Prior to testing, school administrators uploaded pupil background information including Unique Pupil Numbers (UPNs) to the InCAS website. Shortly after testing was complete at schools, the Shared Maths team were able to securely access test scores and pupil background information which was submitted by the school administrator. Following receipt of this data, if for any reason pupil UPNs were missing, the Shared Maths team securely sent schools lists of missing UPNs to complete and return securely. Once all testing and UPNs were complete this data was provided to the evaluation team, for matching to the National Pupil Database (NPD).
Sample size
Sample size calculations were undertaken by a team of original evaluators at the University of Bristol. A previous study of cross age peer tutoring conducted in Fife found an effect size of around 0.2 for the maths intervention (Tymms, et al., 2011). The present study was designed such that effects of a similar magnitude might be detected, using the following assumptions:
• Criterion for statistical significance: p <0.05
• Power against alternative hypothesis: 0.8
• Proportion of schools assigned to treatment 0.50
• Effect size: 0.2
• Number of pupils in each year group per school: 35
• Intra-class correlation (ICC) coefficient: 0.2
• Proportion of variance in the outcome explained by covariates (R-squared): 0.75
Provisional calculations suggested that it was necessary to have at least 76 schools in the final analysis sample. The decision was taken to recruit at least 78 schools to compensate for the fact that some schools were likely to drop out of the study.
Based on the sample size at randomisation and the final analysis sample, along with results obtained in the final analysis, minimum detectable effect sizes can be reported ex-post for the trial. At analysis the minimum detectable effect size (Cohen’s d) is estimated as 0.10 of a standard deviation, whilst at randomisation this was 0.11 (for Year 3 samples). Similar results are obtained from the Year 5 sample, details for both year groups are shown below.
As randomised As analysed
Year 3 Year 5 Year 3 Year 5
Probability level 0.05 0.05 0.05 0.05 ICC 0.07 0.10 0.07 0.10 Average cluster size 40 39 34 32 R-squared (level 2 variance explained) 0.74 0.8 0.74 0.8 Power 80 80 80 80 Effect size 0.10 0.10 0.11 0.10
Randomisation
The randomisation of whole schools for this study was undertaken by the University of Bristol. The 84 schools initially recruited to the trial were stratified by local authority area, and randomisation of schools was therefore conducted within each area. Within each local authority, schools that had agreed to take part were assigned a value drawn at random from a uniform distribution in Microsoft Excel. Schools were then ranked in descending order on the basis of the random number they were assigned. Subsequently, the first school in the ranking was assigned to the intervention group followed by every other school (all schools in odd number positions within the ranking) whilst the remainder were assigned to the control group.
The University of Bristol then informed the project team of the outcome of the randomisation process who in turn informed the schools.
Analysis
The analysis was conducted in STATA version 13 (Stata Corporation, College Station, Texas, USA). Impacts were estimated on the basis of intention to treat, whereby all schools and pupils who were involved in post-testing were analysed according to the study arm to which they were initially assigned, regardless of whether they went on to participate in the intervention.
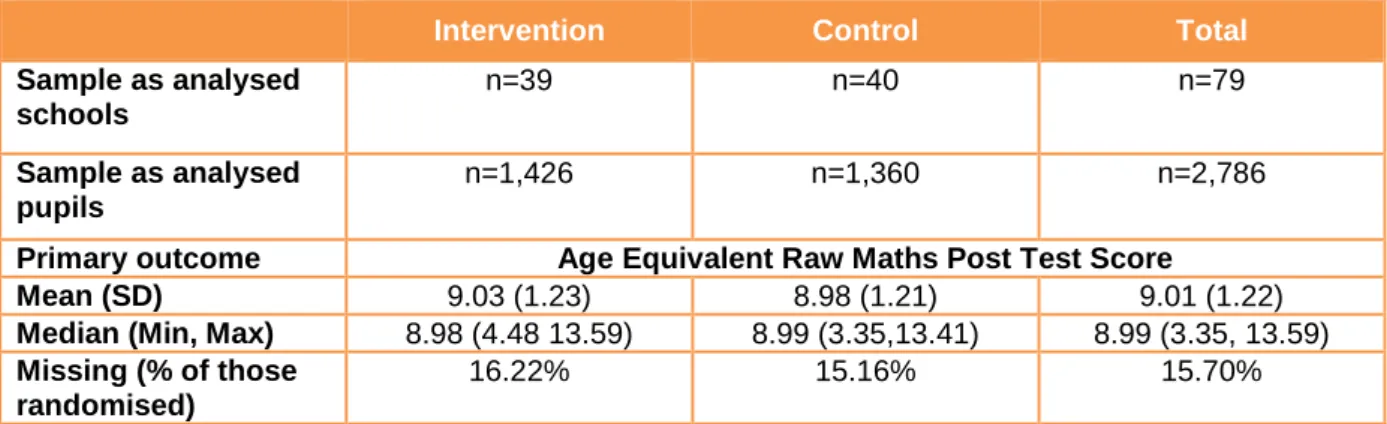
General Mathematics score was used as the primary outcome in analysis as this reflects the pupils’ overall maths ability. Initial descriptive analysis, is based on age equivalent raw scores for pupils for whom post-test primary data were available. The raw scores are presented in years and months which provides an easy comparison to pupils’ expected maths ability. For example, if a pupil is performing as expected for their age, their age equivalent score is the same as his/her chronological age.
Multivariate regression analysis was then used to obtain effect sizes on the primary outcome using age standardised scores which provide an indication of whether pupils are performing at the average level for their age, below or higher than average.9 This involved fitting a multi-level linear regression model with random intercepts; the pupil being level one in the model and the school level two. The following covariates were included in the adjusted analysis:
• School level: a dummy variable indicating whether the school was an intervention school and a set of indicators for the local authority areas.
• Pupil level: baseline test score in maths, eligibility for free school meals, EAL, ethnic group, sex and month of birth. These covariates were included in the analysis to adjust for possible imbalances between intervention and control pupils.
Separate regression models were estimated for Year 3 and Year 5 pupils and for those who qualified for free school meals.10
9
Age standardised scores are based on the pupils’ raw score which has been adjusted for age and placed on a scale that makes a comparison with a nationally representative sample of pupils of the same age across the UK. The average score is 100.
10
The interaction models were implemented using a random intercept and random slope hierarchical regression model (multi-level model). We specified a random slope for the individual level variable indicating if the student was eligible for free school meals. This means that we allowed the effect (slope) of free school meal eligibility on the post-test to vary across school. We further specified that any difference in the variance of these slopes (i.e. in the effect receiving free school meals has on the outcome) is due to having been in a school which was in the treatment group versus the control. This latter specification was included through a cross-level interaction between receiving free school meals
Effect sizes and their respective 95 per cent confidence intervals were calculated following the procedure set out in Tymms (2004):
Where represents the adjusted difference in outcomes between intervention and control groups obtained from the full regression model and 𝜎 the square root of the pupil level variance obtained from fitting an unadjusted multilevel model. The unadjusted model contains a constant, intervention dummy variable but no further covariates.
Summary descriptive statistics are produced below along with estimates of ICCs for each regression model estimated.
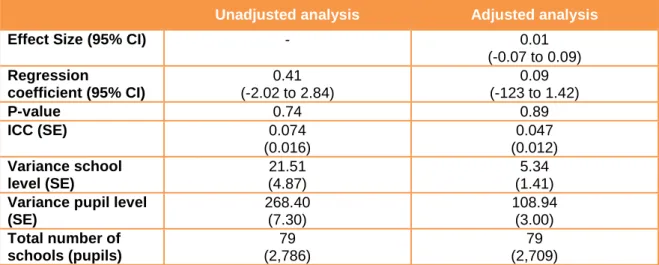
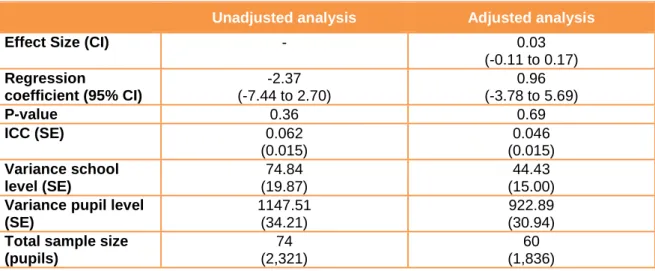
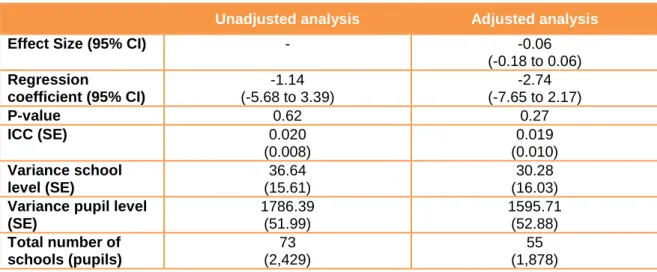
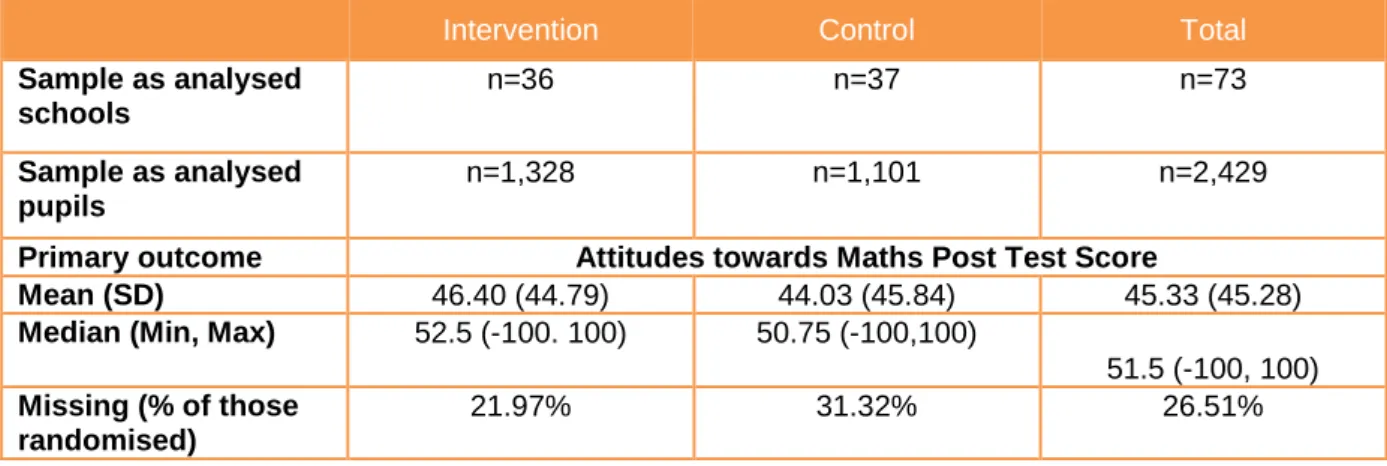
Only limited analysis of secondary outcomes was carried out as part of this study because of the extent of missing data relating to some of secondary outcomes of interest. Namely, due to the level of testing required as part of the project, the Shared Maths team prioritised encouraging schools to collect the InCAS general maths module over the modules relating to secondary outcomes. Therefore, analysis of some secondary outcomes was unfeasible due to the extent of missing data. For example, the post-test results for reading ability measured by the InCAS reading test were available for 1,444 pupils in 28 intervention schools (out of which 4 schools had information for less than 5 pupils) and for 745 pupils in 27 control schools (out of which 12 schools had information for 3 or less pupils). Nonetheless, analysis was carried out on three secondary outcomes: attitudes towards school, reading and maths. The analysis of these secondary outcomes followed the strategy discussed above for the analysis of the primary outcome.
Process evaluation methodology
A longitudinal approach was taken for the process evaluation involving observations and two stages of interviews with the first stage taking place when the programme was introduced in intervention schools and the second stage carried out after the programme was completed in intervention schools and introduced in control schools. Interviews were carried out with teachers, Local Co-ordinators and Shared Maths project team.
As part of the intervention itself the Durham team also collected additional information on the fidelity of implementation of the intervention, which is available from the project team on request (see Project Team for details) and will be published at a later date.
In the first stage, teachers in intervention schools were interviewed between October 2013 and January 2014 by two NatCen researchers. In the second stage, teachers in schools that were originally control schools were interviewed between May and June 2014. Teachers were selected to include both Year 3 and Year 5 teachers across participating local authority areas (see a breakdown of participating teachers by local authority is below). In total 14 teachers (one per school) delivering Shared Maths and opted into the process evaluation took part in depth-interviews.
All four Local Co-ordinators were interviewed at two points, at the midpoint in programme delivery in intervention schools (during early July 2013) and the start of programme delivery in control schools (during March 2014). Two of the Shared Maths project team (Vic Menzies and Kirsty Younger) were also interviewed at the midpoint of programme implementation for intervention schools and again before the programme was introduced in control schools. The rationale for this was to explore any changes made to delivery in control schools based on their experience of Shared Maths in
and the allocation into treatment or control schools. The results of this interaction indicate if being in a treatment versus control school has any impact on the effect FSM has on the outcome.
intervention schools, before the teachers for that phase were interviewed. It also meant they could reflect on particular barriers and successes of initial programme delivery.
This resulted in 24 separate data collection encounters. The total numbers of achieved interviews and dates are shown below:
Stage Number of interviews Fieldwork period
Teacher Local Coordinator Intervention team 1. Programme introduced in intervention schools 8 4 1 October 2013 to January 2014 2. Programme introduced in control schools 6 4 1 May 2014 to June 2014 Total 14 8 2
These interviews all took place over the phone, except in cases where a classroom observation had taken place, in which case a face-to-face interview was carried out.
Two observations were carried out as part of the process evaluation. The observations took place in one school over the course of a full Shared Maths lesson and were carried out by two researchers from the evaluation team. Each observer attended a separate session. They were observing how the intervention was carried out in the classroom and completed a free text proforma to guide the observation. The observations helped to shed light on the role of the teacher, behaviour and engagement of pupils, details of the classroom setting and their observations on barriers and drivers to successful implementation.
It was not possible to achieve the same number of teacher interviews in each area due to the following reasons:
• Lack of teacher availability – many teachers were too busy to take part in an interview despite flexibility in offered times and dates from the research team.
• For Shared Maths implementation in control schools, many schools had delayed the start of the programme and so were not eligible for interview during the allotted fieldwork period. A breakdown of participating teachers by local authority is below:
Area Number of participating teachers
Medway 5
Leeds 2
Worcestershire 4
Durham 3
The schools taking part in the process evaluation did represent a wide range of key pupil and teacher characteristics. These included the number of pupils in the Shared Maths class who had EAL, the number who received FSM or who were identified as having SEN, as well as teachers’ gender, years of experience and seniority. This difference allows us to obtain an understanding of how the programme is implemented, and works, in different types of schools and with teachers from a variety of backgrounds.
Area School Number of participating children % EAL % FSM % SEN Medway 1 61 18% 27% 14% 2 170 3% 18% 22% 3 122 3% 11% 32% 4 126 33% 44% 39% 5 57 2% 4% 12% Leeds 1 97 43% 46% 32% 2 58 11% 18% 26% Worcestershire 1 89 1% 11% 20% 2 51 2% 20% 45% 3 35 3% 41% 29% 4 59 0% 46% 31% Durham 1 97 13% 38% 32% 2 72 3% 26% 39% 3 42 5% 37% 22%
The interviews were semi-structured, based around a topic guide to ensure systematic coverage of key issues, but were also intended to be flexible and interactive, allowing issues of relevance for individual respondents to be covered through detailed follow up questioning. Examples of this were questions relating to the training: the overarching questions were the same for participants but allowed for tailoring as training differed between areas.
The interviews were digitally recorded and subsequently analysed using Framework, a systematic approach to qualitative data management developed by NatCen Social Research and now widely used in social policy research. All participants were told that everything discussed in the interview would remain confidential and would be treated in accordance with the Data Protection Act. Additionally it was made clear, both on recruitment materials and during the interview, that their views or opinions would not be discussed outside of the research team, including sharing individual feedback with the intervention team.
Observations were carried out of two classroom Shared Maths sessions which focused on themes that included:
• The teachers’ role and level of guidance needed
• Tutor/tutee interaction
• Level of pupil perception and understanding around tasks set
• Level of maths self-concept
• Perception of facilitators and barriers to the practical implementation of the programme.
These observations took place before the depth-interviews with teachers in order to allow the research team to further understand how the programme functions in a real-life setting before conducting depth interviews with teachers.
In addition, when the intervention was made available to control group schools, researchers attended two of the training days for teachers in different areas in order to gain a deeper understanding of teacher training at different time points of Shared Maths delivery, to experience the introduction to the programme for teachers and to encourage teacher participation in the evaluation of the programme.
Impact evaluation
Timeline
Date Activity
October 2011 Local Authorities agreed to take part in project
November 2011 to June 2012
Recruitment of schools
September 2012 to November 2012
Pre-test data collection
September 2012 Opt-out parental consent for data use
October 2012 Randomisation of schools to intervention and control groups
November 2012 Intervention school teacher Continued Professional Development (CPD)
sessions for Years 3 and 5
January 2013 Intervention schools start first 16 week block of Programme
March 2013 Second teacher CPD session in intervention schools
March 2013 Lesson observations in all intervention schools by Local Co-ordinators
July 2013 or Sept 2013 Teacher CPD sessions for Years 4 and 6 in intervention schools
Sept 2013 Update to parental consent: new evaluator & data use
September 2013 Intervention schools start second 16 week block of Programme
w/c 21st October 2013 Second teacher CPD session in intervention schools
21st October to 7th December 2013
Lesson observations in all intervention schools by Local Co-ordinators
February 2014 Intervention delivery finishes
Participants
School recruitmentSchool recruitment was undertaken by the Shared Maths project team during November 2011 to June 2012. In total the delivery team approached 129 schools to consider taking part in the trial (see also Figure 1), 29 of these schools approached declined to participate in the study. A further five schools whose details were passed on by local authorities did not meet inclusion criteria (see also School eligibility and recruitment section above). Two schools withdrew at the beginning of pre-testing period (Sept – Nov 2012) due to the changes in staffing over the summer. Yet another school withdrew at the beginning of this period without expressing reasons for refusing to participate. Eight schools did not complete the pre-testing and were excluded before randomisation. In total, 11 schools did not complete the pre-test. In all, out of 129 schools approached, 84 were recruited yielding a recruitment rate of approximately 65 per cent.
As indicated above, it is important to note that even though 84 schools were randomised, the Shared Maths project team in consultation with the then evaluation team excluded two schools from the intervention arm that failed to complete the pre-testing in time. The excluded schools were never informed of their allocation status. Thus, the final randomised study sample consisted of 82 schools, with 40 allocated to the intervention arm and 42 to the control arm.
Pupil recruitment
All 82 schools sent opt-out letters to parents of all children in Year 3 and Year 5 in September 2012. The letter explained that parents were able to withdraw their child’s data from the trial analysis, but not from testing as this was taking place in school time and the results were given to schools to use for routine monitoring purposes. There were a few parent queries regarding the study. However, no parent opted that his/her child did not take part in the study.
Participant flow
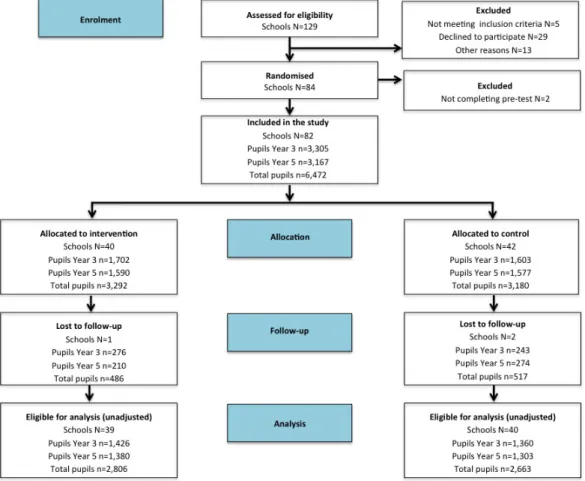
Figure 1 shows the flow of participants in relevant cohorts through the study. There were a total of 6,472 pupils in the study at the point of randomisation (3,305 and 3,167 in Year 3 and Year 5 respectively).
In October 2012, 84 schools were randomised into intervention and control conditions. (As indicated above, 2 schools were excluded after randomisation due to the failure to complete pre-tests.) Of the remaining schools, 40 schools (containing 3,292 participating pupils) were randomly allocated to receive the intervention in 2013 and 42 schools (containing 3,180 participating pupils) to the control condition. There were 1,702 Year 3 pupils and 1,590 Year 5 pupils in the intervention condition and 1,603 Year 3 pupils and 1,577 Year 5 pupils in the control condition.
After randomisation and pre-testing, 3 schools failed to complete the post testing: 1 from the intervention arm and 2 from the control arm, Two of the schools were unable to complete the testing within the time frame due to technical / IT issues, and one school was no longer in contact with either the Durham Team nor the local authority. The number of pupils in the intervention arm lost to follow-up was 486 pfollow-upils (276 in Year 3 and 210 in Year 5). The loss to follow-follow-up in the control arm was 517 pupils (243 in Year 3 and 274 in Year 5). Overall, the proportion of pupils allocated to intervention and to group lost to follow-up was 15% and 16% respectively.
The final number of pupils who had post-test data and were eligible for unadjusted primary analysis was 2,806 (85% of those allocated) in the intervention arm (1,426 who started in Year 3 and 1,380 in Year 5) and 2,663 (84% of those allocated) in the control arm (1,360 who started in Year 3 and 1,303 in Year 5).
However, it is important to note that further participants were excluded from adjusted primary analysis due to missing pupil level covariates capturing baseline test scores in maths or relevant socio-demographics (e.g. whether the pupil qualified for free school meals, EAL, ethnic group, sex and month of birth). In the intervention arm, 41 Year 3 pupils and 5 Year 5 pupils were excluded from adjusted analysis due to not having pre-test measure. A further 2 pupils were excluded for missing socio-demographics. In total, 98 pupils in the intervention arm were excluded from the adjusted analysis sample. As for the control arm, 33 Year 3 pupils and 30 Year 5 pupils were excluded from adjusted analysis due to not having pre-test measure. One pupil was excluded due to missing key socio-demographics. In total, 64 pupils in the control arm were excluded from the adjusted analysis sample (please see Table 2 and Table 3 below for further details on pupils characteristics).
Figure 1: CONSORT diagram
Note: A further 98 pupils in the intervention arm and 64 in the control arm were excluded from adjusted primary analysis due to missing pupil level covariates capturing baseline test scores in maths or relevant socio-demographics.
School characteristics
In this section we look at the characteristics of schools in the sample at the time of randomisation, and those included in the primary analysis.
As we have seen, 82 schools were allocated at random to control and intervention groups on a 1:1 basis11, 42 schools assigned to control conditions, 40 to the intervention. Schools in control and
11
Please note that 2 schools in the intervention arm were excluded after randomisation which led to an uneven number of schools in the intervention and control arm.
intervention groups were distributed across the four areas in which the trial ran in similar proportions. Around a third of schools were located in the Medway, with approximately one fifth located in Leeds, Durham and Worcestershire. At randomisation the mean size of schools in the control and intervention groups respectively stood at around 280 and 310 pupils (Table 1). The majority of schools were 'community schools' and all were mixed sex. Between one fifth and a quarter of pupils were eligible for FSM, compared to an average of 17 per cent of pupils in primary schools being eligible and claiming FSM (DfE, 2014a). Comparing the sample at randomisation (excluding the two schools that were excluded before being told their allocation) to the sample for analysis reveals little difference between the sample characteristics.
Table 1: School level characteristics
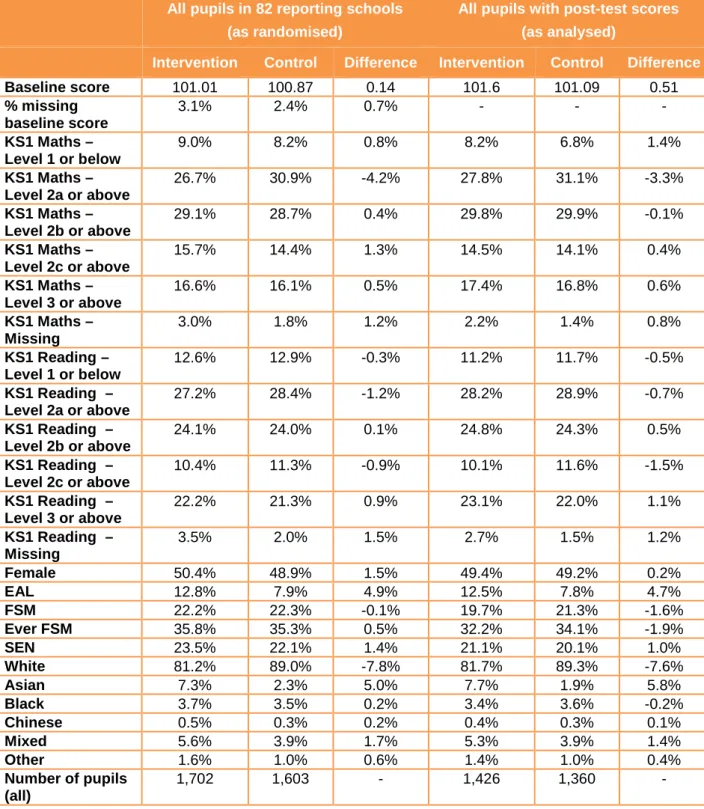
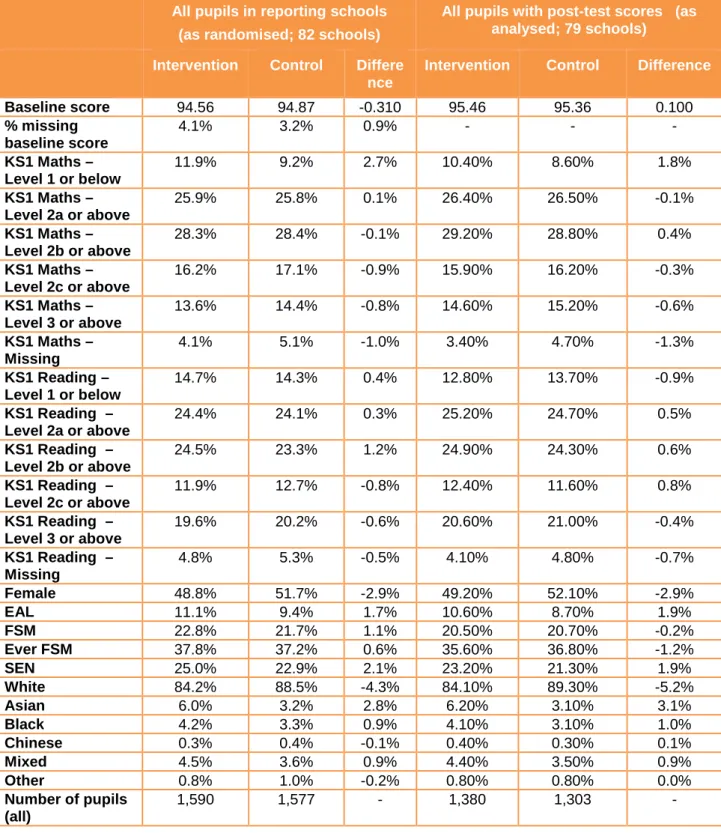
Pupil characteristics
The trial involved the participation of both Year 3 and 5 pupils. Table 2 presents a summary of pupils’ characteristics in intervention and control groups as randomised and as analysed (i.e. those eligible for unadjusted analysis based only on the post-test scores for the primary outcome). There were 1,702 pupils in intervention schools and 1,603 pupils in control schools at randomisation. Restricting analysis to just the pupils with post-test scores (as analysed) reduces the number.
As randomised (N=82) As analysed (N=79)
Intervention Control Difference Intervention Control Difference
School capacity 309.1 278.3 30.8 312 281 30.9 Medway 33% 36% -3% 31% 35% -4% Leeds 25% 21% 4% 26% 23% 3% Durham 23% 21% 1% 23% 23% 1% Worcestershire 20% 21% -1% 21% 20% 1% Community school 60% 69% -9% 59% 73% -14% Voluntary aided school 15% 12% 3% 15% 13% 3% Voluntary controlled school 13% 10% 3% 13% 8% 5% Foundation school 3% 0% 3% 3% 0% 3% Academy sponsor led 10% 7% 3% 10% 5% 5% Academy converter 0% 2% -2% 0% 3% -3% Boys school 0% 0% 0% 0% 0% 0% Girls school 0% 0% 0% 0% 0% 0% Mixed school 100% 100% 0% 100% 100% 0% % eligible FSM 23.1% 22.5% 0.6% 22.3% 23% -0.7% Missing % eligible FSM 10% 7% 3% 10% 5% 5% Outstanding 3% 0% 3% 3% 0% 3% Good 68% 60% 8% 67% 58% 9% Requires improvement 28% 33% -6% 28% 35% -7% Inadequate 3% 7% -5% 3% 8% -5% Number of schools 40 42 - 39 40 -
The baseline characteristics of pupils in intervention and control schools were similar at randomisation and again at analysis, suggesting that the loss of pupils between randomisation and post-test analysis did not introduce bias on observable variables into the sample. There are slight differences in the distributions of scores at Key Stage 1 (at both randomisation and primary analysis). Intervention schools have a noticeably higher proportion of pupils with English as an Additional Language (EAL), fewer pupils from a white British background but more from an Asian background. These variables were controlled for in the adjusted analysis.
Table 2: Pupils characteristics (Year 3)
All pupils in 82 reporting schools (as randomised)
All pupils with post-test scores (as analysed)
Intervention Control Difference Intervention Control Difference
Baseline score 101.01 100.87 0.14 101.6 101.09 0.51 % missing baseline score 3.1% 2.4% 0.7% - - - KS1 Maths – Level 1 or below 9.0% 8.2% 0.8% 8.2% 6.8% 1.4% KS1 Maths – Level 2a or above 26.7% 30.9% -4.2% 27.8% 31.1% -3.3% KS1 Maths – Level 2b or above 29.1% 28.7% 0.4% 29.8% 29.9% -0.1% KS1 Maths – Level 2c or above 15.7% 14.4% 1.3% 14.5% 14.1% 0.4% KS1 Maths – Level 3 or above 16.6% 16.1% 0.5% 17.4% 16.8% 0.6% KS1 Maths – Missing 3.0% 1.8% 1.2% 2.2% 1.4% 0.8% KS1 Reading – Level 1 or below 12.6% 12.9% -0.3% 11.2% 11.7% -0.5% KS1 Reading – Level 2a or above 27.2% 28.4% -1.2% 28.2% 28.9% -0.7% KS1 Reading – Level 2b or above 24.1% 24.0% 0.1% 24.8% 24.3% 0.5% KS1 Reading – Level 2c or above 10.4% 11.3% -0.9% 10.1% 11.6% -1.5% KS1 Reading – Level 3 or above 22.2% 21.3% 0.9% 23.1% 22.0% 1.1% KS1 Reading – Missing 3.5% 2.0% 1.5% 2.7% 1.5% 1.2% Female 50.4% 48.9% 1.5% 49.4% 49.2% 0.2% EAL 12.8% 7.9% 4.9% 12.5% 7.8% 4.7% FSM 22.2% 22.3% -0.1% 19.7% 21.3% -1.6% Ever FSM 35.8% 35.3% 0.5% 32.2% 34.1% -1.9% SEN 23.5% 22.1% 1.4% 21.1% 20.1% 1.0% White 81.2% 89.0% -7.8% 81.7% 89.3% -7.6% Asian 7.3% 2.3% 5.0% 7.7% 1.9% 5.8% Black 3.7% 3.5% 0.2% 3.4% 3.6% -0.2% Chinese 0.5% 0.3% 0.2% 0.4% 0.3% 0.1% Mixed 5.6% 3.9% 1.7% 5.3% 3.9% 1.4% Other 1.6% 1.0% 0.6% 1.4% 1.0% 0.4% Number of pupils (all) 1,702 1,603 - 1,426 1,360 -