April 2019
Panel: The Adjunct Faculty Experience: Is What
We "Know" Correct?
Paul Yakoboski
TIAA Institute
Follow this and additional works at:
https://thekeep.eiu.edu/jcba
Part of the
Collective Bargaining Commons
, and the
Higher Education Commons
This Proceedings Material is brought to you for free and open access by the Journals at The Keep. It has been accepted for inclusion in Journal of Collective Bargaining in the Academy by an authorized editor of The Keep. For more information, please [email protected].
Recommended Citation
Yakoboski, Paul (2019) "Panel: The Adjunct Faculty Experience: Is What We "Know" Correct?,"Journal of Collective Bargaining in the Academy: Vol. 0 , Article 52.
Paul J. Yakoboski, Senior Economist, TIAA Institute
Executive summary
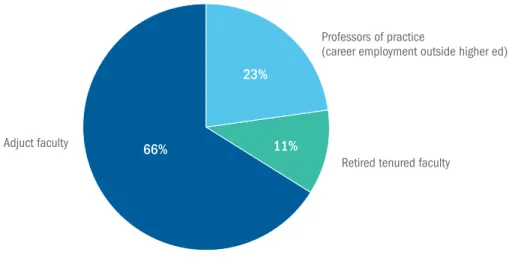
The part-time nontenure-track faculty work force is comprised of three groups. One-quarter referred to as “professors of practice” have career employment outside higher education. Approximately 10% are professors who have retired from a tenured position. The remaining two-thirds are adjunct faculty.
This report examines the adjunct faculty dynamic in American higher education—their demographics, employment experience, career satisfaction, and position preferences— based on results from the 2018Adjunct Faculty Survey.
Approximately 70% of adjunct faculty are over age 40. A slight majority (52%) are female. Female adjuncts tend to be younger than their male peers. A master’s is the highest degree attained by the majority (56%) of adjunct faculty; one-third have earned a doctorate degree. Approximately one-half (52%) teach one or two courses at a single college or university, while 22% teach three or more classes at two or more institutions. Adjunct faculty are paid an average of $3,000 per course, but almost 60% receive less. At the same time, 60% of adjuncts are in households with an income of $50,000 or more. Adjunct household income is highly correlated with marital status. Two-thirds of adjuncts are married or living with a partner; 77% of these have household income of $50,000 or more. In contrast, 65% of single adjuncts report household income of less than $50,000.
One-half of adjunct faculty would prefer to have a tenure-track position. About 10% would prefer a full-time nontenure-track position, while one-quarter prefer an adjunct position. Not surprisingly, preferred position type is strongly correlated with career satisfaction. Two-thirds of adjuncts report being satisfied overall with their academic
Adjunct faculty: Who they are and what is
their experience?
Any opinions expressed herein are those of the author, and do not necessarily represent the views of TIAA, the TIAA Institute or any other organization with which the author is affiliated.
career; 23% are very satisfied and 43% satisfied. At the other end of the spectrum, 16% are dissatisfied with their academic career. Eighty percent of adjuncts who are dissatisfied with their academic career would prefer a tenure-track position, compared with one-third of adjuncts who are very satisfied with their career. Career satisfaction appears correlated with household income, but not with average pay per course. Career satisfaction also appears linked with adjunct age and highest degree attained. Those under age 40 are more likely to be dissatisfied with their academic career, as are those with a doctorate degree.
Faculty composition in higher education
Part-time nontenure-track faculty comprise close to one-half (47%) of the academic work force in U.S. higher education. Tenured and tenure-track faculty account for one-third, with full-time nontenure-track faculty accounting for the remainder (19%).1 With that said,
faculty work force composition varies notably across higher education sectors (Figure 1).
1
Based on 2016 IPEDS data.
Figure 1. Faculty composition in higher ed
These proportions are based on faculty headcount in each of the three groups. Alternatively, the faculty work force can be viewed on a full-time equivalent (FTE) basis. (Appendix Table C1 provides estimates of faculty composition on a FTE basis.)
The part-time nontenure-track academic work force, in turn, can be divided into three groups (Figure 2):
W Professors of practice, i.e., part-time faculty with
career employment outside higher education, account
for one-quarter of it. Such faculty (for example, a professional musician or a practicing attorney) bring that expertise and experience into the classroom.2 W Professors retired from a tenured position account
for approximately 10%.
W Adjunct faculty account for the remaining two-thirds.3
2 These faculty are sometimes referred to as “executives or professionals in residence.”
3 Clinical faculty in professional schools are sometimes referred to as adjunct faculty. In addition, some colleges and universities give the title
“adjunct” to tenured and tenure-track faculty with courtesy appointments in other units. Neither of these is considered adjunct for purposes of this study, nor are graduate students. Not all adjunct positions involve teaching responsibilities; in some cases, adjunct faculty may have a research position. Ninety-eight percent of adjuncts in this study taught at least one course.
Figure 2. Part-time nontenure-track faculty
Source: 2018 Adjunct Faculty Survey, TIAA Institute. Most part-time nontenure-track faculty are adjuncts.
College and university employment of adjunct faculty has raised issues along four dimensions:
W Student learning and outcomes.
W Institutional efficiency and cost management. W Organizational functioning of academic units. W The individual adjunct faculty member.
This report focuses on the fourth. It leverages data from the TIAA Institute’s 2018 Adjunct Faculty Survey to examine the demographics and experience of adjunct faculty from all sectors of American higher education. (See Appendix A for a discussion of survey methodology.) (See Appendix B for a bibliography of TIAA Institute research addressing the range of issues noted above.)
Who are adjunct faculty?
A common perception regarding adjunct faculty seems to be that they are relatively young, have recently attained their doctorate degree, and are teaching multiple classes at multiple colleges and universities while pursuing a tenure-track position. While such individuals certainly exist, they do not represent the norm.
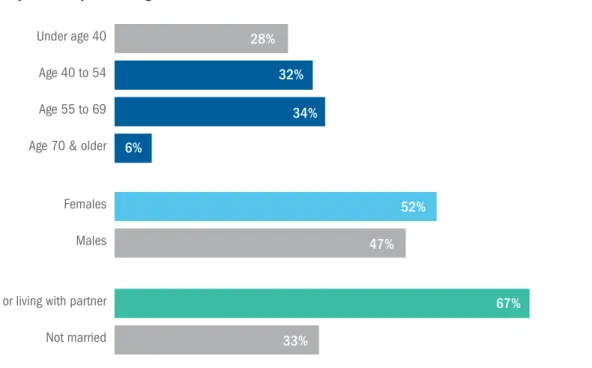
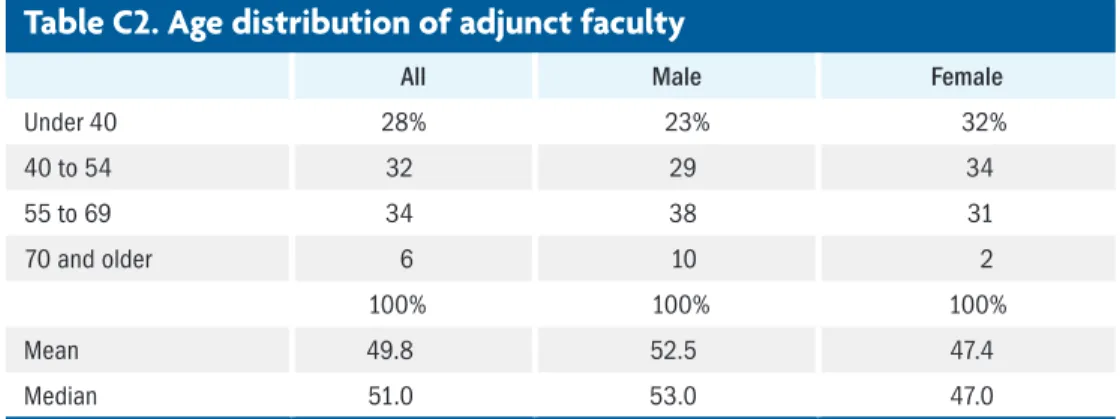
Approximately 70% of adjunct faculty are over age 40; their average age is 50 (Figure 3).4,5 A slight majority
(52%) are female. Female adjuncts tend to be younger than their male peers, with an average age of 47,
compared with 53 for male adjuncts (Appendix Table C2). Almost one-half of male adjuncts are age 55 and older, compared with one-third of female adjuncts. In addition, two-thirds of adjuncts are married or living with a partner.
4 In a survey by the American Federation of Teachers (AFT), 33% of part-time faculty are under age 45, 31% are age 45 to 54, and 36% are age 55
or older. See “Survey of Part-Time and Adjunct Higher Education Faculty,” conducted on behalf of the American Federation of Teachers by Hart Research Associates (January 2010) in American Academic, vol. 2, March 2010 (AFT Higher Education).
5 In 2003, 80% of full-time faculty and instructional staff were age 40 and older (IPEDS).
Figure 3. Adjunct demographics
Source: 2018 Adjunct Faculty Survey, TIAA Institute. 70% of adjunct faculty are over age 40.
Not married Married or living with partner Males Females Age 70 & older Age 55 to 69 Age 40 to 54 Under age 40 6% 52% 47% 67% 33% 34% 28% 32%
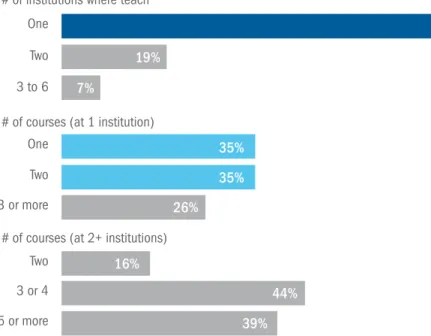
Seventy-four percent of adjunct faculty teach at a single college or university.6 Among these, 35% teach one
course and 35% teach two courses, meaning that 52% of adjuncts teach one or two courses at a single institution
(Figure 4). On the other hand, 26% of adjunct faculty teach at two or more colleges and universities, and among these, 83% teach three or more classes.
6 This figure aligns with the Coalition on the Academic Workforce (CAW) study in which approximately 70% of adjunct faculty taught at one college
or university. By contrast, in the AFT survey, 55% of adjuncts without a non-teaching job reported having one academic teaching job. A master’s is the highest degree attained by the
majority (56%) of adjunct faculty. One-third have earned a doctorate degree. The academic discipline of most
adjuncts falls under the humanities or social sciences (Figure 5).
Figure 4. Adjunct work experience
Source: 2018 Adjunct Faculty Survey, TIAA Institute. Over 1/2 teach one or two courses at a single institution.
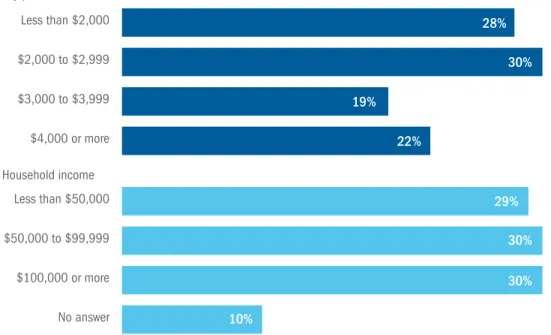
Adjunct pay and household income
Adjunct faculty are paid an average of $3,000 per course, but almost 60% receive less than this amount on average. At the same time, 60% of adjuncts are in
households with an income of $50,000 or more (Figure 6). Clearly, the majority of adjuncts are in households where adjunct earnings are not the primary source of household income.7
7 The CAW and AFT studies indicated a similar dynamic. In the CAW study, 61% of part-time faculty reported household income of $55,000 or
more (2009). In the AFT survey, 75% reported household income of $50,000 or more (2009). In both cases, these figures include “professors of practice.”
Figure 5. Adjunct demographics
Source: 2018 Adjunct Faculty Survey, TIAA Institute.
The highest degree among most adjunct faculty is a Master’s.
Professional/Sciences Humanities/Social Sciences Bachelor's Professional/other terminal Master's Doctorate 5% 6% 55% 44% 56% 32% Highest degree
Figure 6. Adjunct pay and household income
Source: 2018 Adjunct Faculty Survey, TIAA Institute.
Average pay per course is $3,000, but 60% of adjunct faculty are in households with annual incomes of $50,000 or more.
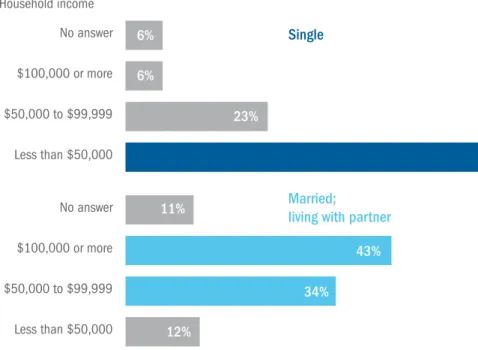
It is not surprising, then, that adjunct household income is highly correlated with marital status. Sixty-five percent of single adjuncts (including divorced, separated or widowed) report household income of less than $50,000; 46% report household income of less than $35,000.
In contrast, 77% of adjuncts with a spouse or partner have household income of $50,000 or more; 43% have household income of $100,000 or more (Figure 7).
In addition, adjuncts receiving lower pay per course are more likely to be in households with lower household incomes. Among those averaging less than $2,000 per course, 38% report household income of less than $50,000 and 30% report $100,000 or more. By comparison, among those averaging $4,000 or more per course, 21% report household income of less than $50,000, while 44% report $100,000 or more.8
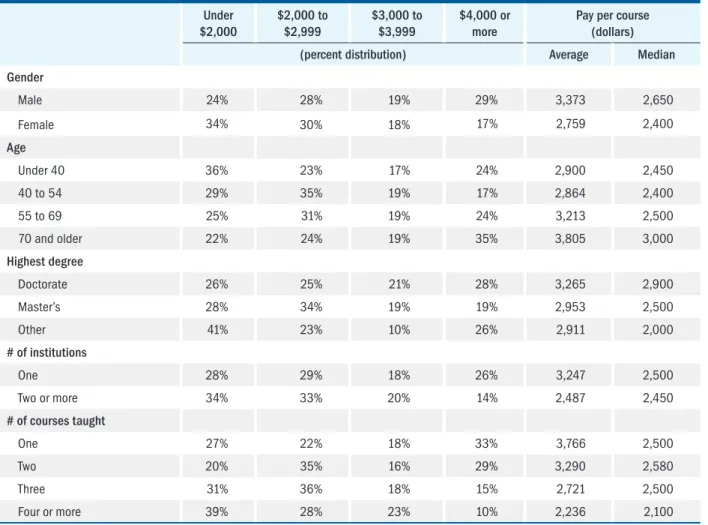
Male adjuncts tend to earn more per course than their female peers; $3,373 on average compared with $2,759. Older adjuncts average more per course ($3,805 among those ages 70 and older; $2,900 among those under age 40). Average pay among adjuncts with a doctorate degree is only $300 greater than that of adjuncts with a master’s degree, but those with a doctorate are 10 percentage points more likely to average $3,000 or more per course. Average pay per course is greater for adjuncts teaching at
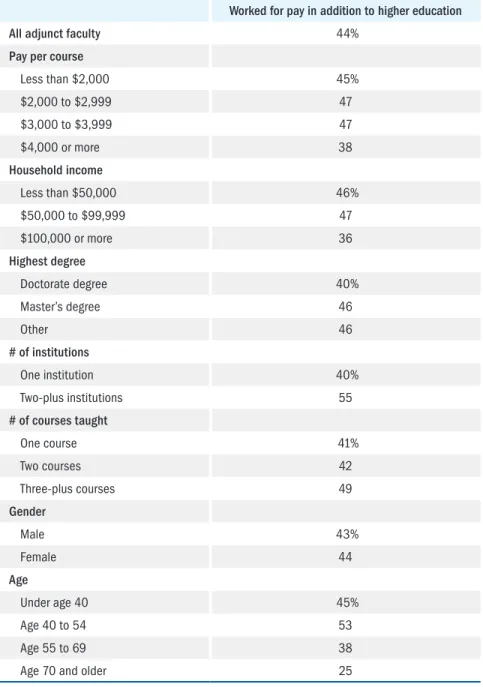
just one college or university; the same is true for those teaching just one course. (See Appendix Table C3.) Forty-four percent of adjunct faculty reported working for pay aside from their college or university employment in the past school year. Fifty-five percent of adjuncts who work at two or more colleges and universities had additional employment outside higher education, compared with 40% of those working at one institution. (See Appendix Table C4.) Also, it is somewhat more common among those teaching three or more courses. The likelihood of additional employment falls at older ages; the share working outside higher education decreases from 53% among adjuncts age 40-54 to 25% among those age 70 and older. The percentage with outside employment drops about 10 percentage points for those earning $4,000 or more per course, as well as those with household incomes of $100,000 or more, but there is no drop-off before those points.
Figure 7. Household status and income
Married adjuncts (including those living with partner) have higher household incomes.
Career satisfaction and preferred
position-type
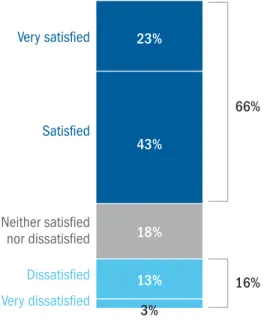
Two-thirds of adjunct faculty report being satisfied overall with their academic career; 23% are very satisfied and
43% satisfied. At the other end of the spectrum, 16% of adjuncts are dissatisfied with their academic career (Figure 8).
Career satisfaction appears correlated with household income but not with average pay per course. Twenty-three percent of those with household income under $50,000 were dissatisfied with their career overall, compared with 11% of those with household income of $100,000 or more. Analogously, the percentage very satisfied among those with $100,000 or more in household income is
double that of those with less than $50,000 (29% vs 15%). (See Appendix Table C5.)
Career satisfaction also appears linked with adjunct age and highest degree attained. Those under age 40 are more likely to be dissatisfied with their academic career, as are those with a doctorate degree.
Figure 8. Adjunct career satisfaction
Source: 2018 Adjunct Faculty Survey, TIAA Institute.
2/3 of adjunct faculty are satisfied with their academic career.
Overall, are you satisfied or dissatisfied with your academic career?
18% 23% 43% 13% 3% 16% 66%
Preferred position type
One-half of adjunct faculty would prefer to have a tenure-track position. About 10% would prefer a full-time nontenure-track position, while one-quarter prefer an
adjunct position (Figure 9).9,10 In addition, more than 80%
of those preferring a tenure-track position would likely accept a full-time nontenure-track position if available.11
9 Survey respondents were asked, “Would you prefer to have a tenure-track position (yes/no/not sure)?” Those answering “no” or “not sure”
were asked, “Would you prefer to have a full-time nontenure-track position (yes/no/not sure)?” Those answering “yes” to the initial question were classified as preferring a tenure-track position. Those answering “yes” to the second question were classified as preferring a full-time nontenure-track position. Those answering “no” to both questions were classified as preferring an adjunct position. The remainder (no/not sure, not sure/no and not sure/not sure) were classified as “not sure.”
10 In the AFT survey, approximately 60% of adjunct faculty would have preferred a full-time teaching position over their part-time position. This
assumes that no professors of practice felt this way—47% of all respondents preferred a full-time position over their part-time position. Only 24% of adjunct faculty in the CAW study preferred part-time non-tenure track employment; these were likely highly correlated with the 27% who did not view their faculty employment as their primary job. The rest had sought (26%), were seeking (30%) or planned to seek (20%) a full-time tenure-track position.
11 Those preferring a tenure-track position were asked, “How likely or unlikely would you be to accept a full-time nontenure-track position,
assuming adequate salary and benefits?”
Figure 9. Preferred position type
Source: 2018 Adjunct Faculty Survey, TIAA Institute.
1/2 of adjunct faculty would prefer a tenure-track position; 1/4 prefer an adjunct position.
Prefer to have:
Prefer tenure track, but… 7%
43% Would likely accept full-time nontenure-track position 11% 15% 24% 50% Tenure-trackposition Full-time nontenure-track position Adjunct position Not sure
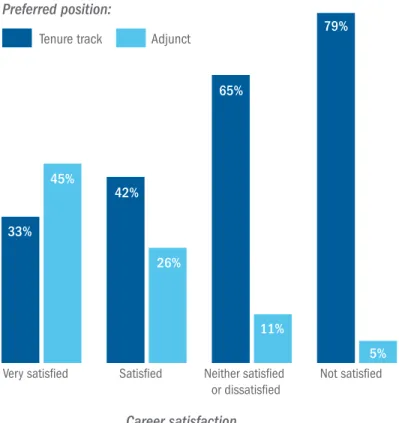
Not surprisingly, preferred position type is strongly correlated with career satisfaction. Eighty percent of adjuncts who are dissatisfied with their academic career would prefer a tenure-track position compared with one-third of adjuncts who are very satisfied with
their career. Analogously, 45% of adjuncts who are very satisfied prefer an adjunct position, but only 5% of those dissatisfied do (Figure 10).
Figure 10. Preferred position among adjuncts
Source: 2018 Adjunct Faculty Survey, TIAA Institute.
Preferred position strongly correlated with career satisfaction.
In addition, there are some clear demographic patterns in preferred position type. Sixty-nine percent of adjuncts in households with income less than $50,000 would prefer a tenure-track position—double the percentage of those with household incomes of $100,000 or more (34%). Analogously, the percentage of adjuncts who would prefer a tenure-track position is higher among those:
W Teaching at two or more colleges and universities. W Teaching three or more courses.
W Who are under age 40. W With a doctorate degree.
(See Appendix Table C6.)
Conclusion
Part-time nontenure-track faculty comprise close to one-half of the academic work force in U.S. higher education, and two-thirds of these are adjunct faculty. (The others have career employment outside higher 26% 11% 5% 33% 42% 65% 45% 79% Career satisfaction Preferred position:
education or have retired from a tenured position.) Thus, approximately one-third of the academic work force is comprised of adjuncts. This report leverages data from the 2018 Adjunct Faculty Survey to examine the experience of these faculty.
A common perception regarding adjunct faculty seems to be that they are relatively young, have recently attained their doctorate degree, and are teaching multiple classes at multiple colleges and universities while pursuing a tenure-track position. While such individuals certainly exist, they do not represent the norm.
Approximately 70% of adjunct faculty are over age 40. A slight majority are female. A master’s is the highest degree attained by 56% of adjuncts; one-third have earned a doctorate degree. Approximately one-half teach one or two courses at a single college or university, while about 20% teach three or more classes at two or more institutions.
Adjunct faculty are paid an average of $3,000 per course, but almost 60% receive less than this amount on average. At the same time, 60% of adjuncts are in households with an income of $50,000 or more. Clearly, the majority of adjuncts are in households where adjunct earnings are not the primary source of household
income. Adjunct household income is highly correlated with marital status. Two-thirds of adjuncts are married or living with a partner; 77% of these have household income of $50,000 or more. In contrast, 65% of single adjuncts report household income of less than $50,000. Two-thirds of adjunct faculty report being satisfied overall with their academic career; 23% are very satisfied and 43% satisfied. At the other end of the spectrum, 16% of adjuncts are dissatisfied with their academic career. Career satisfaction appears correlated with household income but not with average pay per course. Satisfaction also appears linked with adjunct age and highest degree attained. Those under age 40 are more likely to be dissatisfied with their academic career, as are those with a doctorate degree.
One-half of adjunct faculty would prefer to have a tenure-track position. About 10% would prefer a full-time nontenure-track position, while one-quarter prefer an adjunct position. In addition, more than 80% of those preferring a tenure-track position would likely accept a full-time nontenure-track position if available. Not surprisingly, preferred position type is strongly correlated with career satisfaction.
About the author
Paul Yakoboski is a senior economist with the TIAA Institute where he is responsible for research on lifetime financial security, including topics related to defined contribution plan design, financial literacy and capability, individual saving and investment decision-making, and asset management during retirement, as well as research on work force issues in the higher education and non-profit sectors.
Prior to joining the TIAA Institute, Yakoboski held positions as Director, Policy Research for the American Council of Life Insurers, Senior Research Associate with the Employee Benefit Research Institute and Senior Economist with the U.S. Government Accountability Office. He previously served as Director of Research for the American Savings Education Council and was an adjunct instructor at Nazareth College.
Yakoboski serves on the board of the Journal of Retirement, the editorial advisory board of Benefits Quarterly, the research committee of the Insured Retirement Institute and the Society of Actuaries’ Committee on Post-Retirement Needs and Risks. Yakoboski earned his Ph.D. and M.A. in economics from the University of Rochester and his B.S. in economics from Virginia Tech.
Appendix A
Survey methodology
Five-hundred and two adjunct faculty members were surveyed online from May 14 to June 8, 2018. Survey
respondents were selected from members of the Research Now online research panel.12 Respondents represented
all sectors of higher education. By design, the survey sample did not include professors of practice or retired tenured faculty. However, counts of these two groups were kept as respondents were screened during fielding. This enabled computing the compositional breakdown presented in Figure 2.
Ninety-three percent of survey respondents were employed at a college or university during the Spring 2018 semester; question wording referenced that semester as appropriate. The remainder worked at a college or university during the Fall 2017 semester;13 question wording referred to that semester for these individuals. (Eighty-nine percent of
respondents worked for a college or university during both semesters.)
Survey responses were weighted by age, gender, and highest degree attained. A Coalition on the Academic Workforce (CAW) survey was used for age and degree weighting.14 Gender was weighted based on GAO analysis
of 2015 IPEDS data.15
12 Research Now maintains one of the survey research industry’s most comprehensive and deeply-profiled online survey panels. Panel members
are recruited through a controlled mix of both online and offline methods, using “by-invitation-only” acquisition to avoid attracting professional survey takers.
13 One respondent reported employment in the Winter 2017-2018 semester.
14 The CAW survey was conducted in 2010 with a sample of 9,238 part-time faculty. Seventy-three percent of respondents reported contingent
teaching in higher education as their primary employment, implying that approximately one-quarter of the sample was professors of practice. See Coalition on the Academic Workforce, “A Portrait of Part-Time Faculty Members: A Summary of Findings on Part-Time Faculty Respondents to the Coalition on the Academic Workforce Survey of Contingent Faculty Members and Instructors,” June 2012.
15 See U.S. General Accountability Office, “Contingent Workforce: Size, Characteristics, Compensation, and Work Experiences of Adjunct and
Appendix B
Bibliography of previous TIAA Institute reports on the faculty work force model
Chun, Edna and Alvin Evans. “Designing and Implementing Strategies for the Development of a Winning Faculty Workforce,” TIAA-CREF Institute (November 2014).
Ehrenberg, Ronald G. “Assessing Public Higher Education at the Start of the 21st Century,” TIAA-CREF Institute
Trends and Issues (July 2005).
Finkelstein, Martin, Valerie Martin Conley and Jack H. Schuster. “Taking the Measure of Faculty Diversity,” TIAA Institute Advancing Higher Education (April 2016).
Finkelstein, Martin and Jack H. Schuster. “A New Higher Education: The “Next Model” Takes Shape,” TIAA-CREF Institute Advancing Higher Education (April 2011).
Finkelstein, Martin, Jack H. Schuster and Kevin Iglesias. “Faculty Careers in Rapid Transition: The Salience of the Redistribution of Faculty Appointments,” TIAA-CREF Institute Research Dialogue (June 2013).
Hearn, James, Rachel Burns and Karley A. Riffe. “Academic Workforce Flexibility and Strategic Outcomes in Four-Year Colleges and Universities,” TIAA Institute Research Dialogue (December 2017).
Hearn, James and Mary Milan Deupree. “Here Today, Gone Tomorrow? The Increasingly Contingent Faculty Workforce,” TIAA-CREF Institute Advancing Higher Education (March 2013).
Hearn, James, Mary C. Milan and T. Lacy Austin. “The Contingency Movement: A Longitudinal Analysis of Changing Employment Patterns in U.S. Higher Education,” TIAA-CREF Institute Research Dialogue (September 2012). Hurlburt, Steven and Michael McGarrah. “Cost Savings or Cost Shifting? The Relationship between Part-Time
Contingent Faculty and Institutional Spending,” TIAA Institute and the Delta Cost Project at AIR (November 2016). Kezar, Adrianna. “Changing Faculty Workforce Models,” TIAA-CREF Institute (November 2013).
Kezar, Adrianna, Elizabeth Holcombe and Daniel Maxey. “Rethinking Faculty Models/Roles: An Emerging Consensus about Future Directions for the Professoriate,” TIAA Institute (April 2016).
O’Meara, KerryAnn. “Flexible Workplace Agreements: Enabling Higher Education’s Strategic Advantage,” TIAA-CREF Institute (December 2015).
Shaker, Genevieve G. and William M. Plater. “The Public Good, Productivity and Faculty Work: Individual Effort and Social Value,” TIAA Institute and NACUBO (July 2016).
Yakoboski, Paul J. “The Career Experience of Academics in Adjunct Faculty Positions,” TIAA-CREF Institute
Trends and Issues (May 2015).
Yakoboski, Paul J. “Exploring Emerging New Faculty Workforce Models,” TIAA-CREF Institute (November 2014). Yakoboski, Paul J. and Jean E. Foster. “Strategic Utilization of Adjunct and Other Contingent Faculty,”
Appendix C
Table C1. Academic work force composition
Tenured/tenure track Full-time nontenure track Part-time nontenure track Headcount FTE-basis Headcount FTE-basis Headcount FTE-basis Public Research 50% 61% 24% 29% 26% 10% Master’s 44 62 12 17 44 21 Bachelor’s 38 56 13 20 49 24 Associates 17 31 14 26 69 43 Private Research 42% 55% 24% 30% 34% 15% Master’s 26 43 16 26 58 31 Bachelor’s 40 55 20 27 40 18
Source: Hulburt and McGarrah, “The Shifting Academic Workforce,” Delta Cost Project Issue Brief (June 2016).
Table C2. Age distribution of adjunct faculty
All Male Female
Under 40 28% 23% 32% 40 to 54 32 29 34 55 to 69 34 38 31 70 and older 6 10 2 100% 100% 100% Mean 49.8 52.5 47.4 Median 51.0 53.0 47.0
Table C3. Pay per course by adjunct characteristics
Under $2,000 $2,000 to $2,999 $3,000 to $3,999 $4,000 or morePay per course (dollars) (percent distribution) Average Median Gender Male 24% 28% 19% 29% 3,373 2,650 Female 34% 30% 18% 17% 2,759 2,400 Age Under 40 36% 23% 17% 24% 2,900 2,450 40 to 54 29% 35% 19% 17% 2,864 2,400 55 to 69 25% 31% 19% 24% 3,213 2,500 70 and older 22% 24% 19% 35% 3,805 3,000 Highest degree Doctorate 26% 25% 21% 28% 3,265 2,900 Master’s 28% 34% 19% 19% 2,953 2,500 Other 41% 23% 10% 26% 2,911 2,000 # of institutions One 28% 29% 18% 26% 3,247 2,500 Two or more 34% 33% 20% 14% 2,487 2,450 # of courses taught One 27% 22% 18% 33% 3,766 2,500 Two 20% 35% 16% 29% 3,290 2,580 Three 31% 36% 18% 15% 2,721 2,500 Four or more 39% 28% 23% 10% 2,236 2,100
Table C4. Adjunct work for pay outside higher education
Worked for pay in addition to higher educationAll adjunct faculty 44%
Pay per course
Less than $2,000 45% $2,000 to $2,999 47 $3,000 to $3,999 47 $4,000 or more 38 Household income Less than $50,000 46% $50,000 to $99,999 47 $100,000 or more 36 Highest degree Doctorate degree 40% Master’s degree 46 Other 46 # of institutions One institution 40% Two-plus institutions 55 # of courses taught One course 41% Two courses 42 Three-plus courses 49 Gender Male 43% Female 44 Age Under age 40 45% Age 40 to 54 53 Age 55 to 69 38
Age 70 and older 25
Table C5. Career satisfaction among adjunct faculty
Very satisfied Satisfied Neither Dissatisfied Very dissatisfied Pay per course
Less than $2,000 21% 44 17 17 1 $2,000 to $2,999 19% 47 17 11 5 $3,000 to $3,999 27% 40 19 14 1 $4,000 or more 23% 41 22 10 4 Household income Less than $50,000 15% 38 24 20 3 $50,000 to $99,999 20% 49 16 11 4 $100,000 or more 29% 45 14 9 2 # of institutions One 24% 41 20 13 3 Two or more 19% 51 15 15 1 # of courses taught One 24% 39 21 13 3 Two 25% 46 15 12 2 Three 21% 42 20 13 5 Four or more 19% 46 18 15 1 Gender Male 27% 42 15 13 2 Female 19% 45 21 12 3 Age Under 40 17% 39 17 22 5 40 to 54 21% 44 23 11 1 55 to 69 25% 46 17 9 3 70 and older 45% 44 5 5 1 Highest degree Doctorate 20% 35 19 22 4 Master’s 24% 47 17 11 2
Table C6. Preferred position among adjunct faculty
Tenure track Full-time non-tenure track Adjunct Not sure Pay per course
Less than $2,000 50% 12 19 19 $2,000 to $2,999 51% 9 25 14 $3,000 to $3,999 53% 11 23 14 $4,000 or more 47% 13 28 12 Household income Less than $50,000 69% 12 8 10 $50,000 to $99,999 52% 8 24 17 $100,000 or more 34% 12 38 17 # of institutions One 45% 11 28 16 Two or more 63% 12 13 11 # of courses taught One 37% 10 34 19 Two 43% 13 28 16 Three 64% 12 16 9 Four or more 65% 10 12 13 Gender Male 48% 9 29 14 Female 52% 13 20 15 Age Under 40 66% 11 6 17 40 to 54 57% 12 18 13 55 to 69 36% 11 38 15 70 and older 17% 5 62 16 Highest degree Doctorate 62% 10 20 8 Master’s 47% 11 24 18