Loyola University Chicago Loyola University Chicago
Loyola eCommons
Loyola eCommons
Master's Theses Theses and Dissertations
2018
A Study Into the Feasibility of Using Natural Language Processing
A Study Into the Feasibility of Using Natural Language Processing
and Machine Learning for the Identification of Alcohol Misuse in
and Machine Learning for the Identification of Alcohol Misuse in
Trauma Patients
Trauma Patients
Andrew Phillips
Loyola University Chicago
Follow this and additional works at: https://ecommons.luc.edu/luc_theses
Part of the Computer Sciences Commons
Recommended Citation Recommended Citation
Phillips, Andrew, "A Study Into the Feasibility of Using Natural Language Processing and Machine Learning for the Identification of Alcohol Misuse in Trauma Patients" (2018). Master's Theses. 3754.
https://ecommons.luc.edu/luc_theses/3754
This Thesis is brought to you for free and open access by the Theses and Dissertations at Loyola eCommons. It has been accepted for inclusion in Master's Theses by an authorized administrator of Loyola eCommons. For more information, please contact [email protected].
This work is licensed under a Creative Commons Attribution-Noncommercial-No Derivative Works 3.0 License. Copyright © 2018 Andrew Phillips
LOYOLA UNIVERSITY CHICAGO
A STUDY INTO THE FEASIBILITY OF
USING NATURAL LANGUAGE PROCESSING AND MACHINE LEARNING FOR THE IDENTIFICATION OF ALCOHOL MISUSE IN TRAUMA PATIENTS
A THESIS SUBMITTED TO
THE FACULTY OF THE GRADUATE SCHOOL IN CANDIDACY FOR THE DEGREE OF
MASTER OF SCIENCE
PROGRAM IN COMPUTER SCIENCE
BY
ANDREW PHILLIPS CHICAGO, IL AUGUST 2018
Copyright by Andrew Phillips, 2018 All rights reserved.
iii
ACKNOWLEDGEMENTS
I would first of all like to thank my advisor, professor and mentor, Dr. Dmitriy Dligach, for his invaluable advice during my studies and throughout this project. I was first introduced to machine learning in his class, and through working on this project with him I have come to appreciate the difficulties of the task in general.
I would like to thank Dr. Majid Afshar, and by extension the Loyola University Chicago Health Sciences Division, for this opportunity and insight into the challenges of integrating machine learning technologies into the medical field.
Many thanks to Dr. Mark V. Albert for agreeing to be on my committee. His queries and insights facilitated a greater understanding of the project from an external perspective.
Special thanks to my family and friends; only with their continued support at all times was I able to make it to this point.
iv TABLE OF CONTENTS ACKNOWLEDGEMENTS iii LIST OF FIGURES v LIST OF TABLES vi ABSTRACT vii CHAPTER I: INTRODUCTION 1
CHAPTER II: METHODOLOGY 3
Data Preparation 3
Data Preprocessing 5
Model Selection 7
CHAPTER III: RESULTS 11
Preliminary 11
Baselines 12
Model Selection via F1 Metric 12
Model Selection via ROC AUC Metric 13
Learning Curves 14
Prediction on AUDIT-less Patients 14
CHAPTER IV: DISCUSSION 15
Baselines 15
Model Selection 15
Limitations 16
CHAPTER V: FUTURE WORK 17
Feature Engineering 17
Error Correction 17
Using All Note Types 17
Ensemble Classifiers 17
Automated Pipeline 18
REFERENCE LIST 19
v
LIST OF TABLES
Table 1. Distribution of patient notes across note types and datasets. 11 Table 2. Summary of baseline hyperparameters and scores on several data views. 12
Table 3. Summary of top grids as selected by F1 metric. 13
Table 4. Summary of top grids as selected by ROC AUC metric. 13
vi
LIST OF FIGURES
Figure 1. General layout of the data directory containing the datasets. 5
Figure 2. Sample from datasets containing raw text (left) and matching CUIs (right). 6
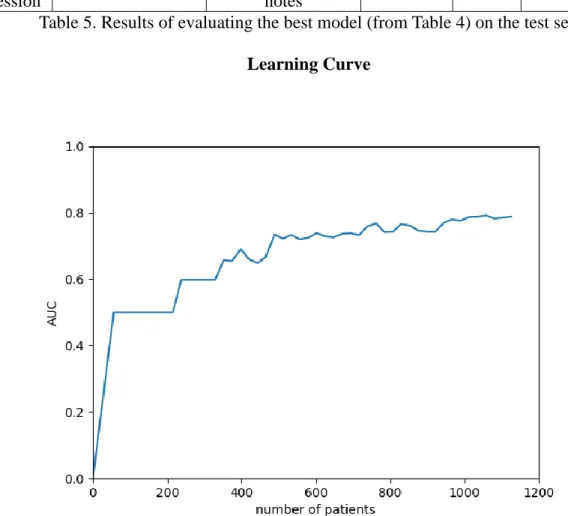
Figure 3. Sample learning curve showing score improvement as dataset size increases. 9 Figure 4. Learning curve showing the performance of the engineered “anc” notes model as
vii ABSTRACT
Alcohol misuse is a leading cause of premature death in the United States. Nearly a third of trauma patients are found to have elevated blood alcohol levels upon admission, and there is a high risk of relapse for patients with alcohol misuse. However, timely intervention has been shown to reduce this risk. It is thus important to be able to quickly screen patients to identify alcohol misuse. Many medical centers use standardized questionnaires such as the Alcohol Use Disorder Indicator Test to identify alcohol misuse, but since the test is not usually a part of routine care, there are many cases where it is not done. Also, some patients may under-report their scores, making misuse identification and subsequent intervention unfeasible.
The data captured by care providers in clinical narrative is a potentially rich source of data for identifying patients with alcohol misuse which can be used to augment the screening process. In this study, large quantities of notes were processed with natural language processing and machine learning methods to identify important social and behavioral determinants for health. It resulted in the creation of a system, which uses NLP and ML, that provides good discrimination of patients with and without alcohol misuse.
1
1 CHAPTER I
INTRODUCTION
Alcohol misuse is a leading cause of premature death in the United States. It is attributed to 1 in 10 deaths of working age adults (Stahre, 2014). Nearly a third of trauma patients are found to have elevated blood alcohol levels (BAL) upon admission (Afshar, 2015). Additionally, there is a high risk of relapse for patients with alcohol misuse (Rivara, 1993). However, timely intervention has been shown to reduce this risk by nearly 50% (Gentilello, 1999). It is thus important to be able to quickly screen patients to identify alcohol misuse.
Many medical centers use standardized questionnaires such as the Alcohol Use Disorder Indicator Test (AUDIT)1 to identify alcohol misuse, but this is not usually a part of routine
clinical care, nor is it administered by primary providers. Hence there are many cases where it is not done. Also, some patients may under-report their scores, making misuse identification and subsequent intervention unfeasible.
There are many signs and symptoms of alcohol misuse, a substantial amount of which may be captured by care providers in the clinical narrative collected upon patient admission. As such, this is a potentially rich source of data for identifying patients with alcohol misuse which can be used to augment the screening process. Natural language processing (NLP) is a sub-field of
1 The AUDIT is a 10-item screening questionnaire developed by the World Health Organization to identify alcohol
2
2
artificial intelligence (AI) which is concerned with, among other things, automatic semantic analysis of text, and has been successfully used in clinical practice and research
(Ananthakrishnan, 2013; Xia, 2013). Machine learning (ML), another sub-field of AI, focuses primarily on learning from data in order to make predictions. Large quantities of notes from the electronic health record (EHR) can be processed with these methods to identify important social and behavioral determinants for health.
This study aims to evaluate the utility of a system, which uses NLP and ML, to augment trauma centers that screen for alcohol misuse. It is hypothesized that such a system will provide good discrimination of patients with and without alcohol misuse.
3
3 CHAPTER II METHODOLOGY
This chapter details the data, tools and steps taken to execute the study. Due to the sensitive nature of the data, this researcher first obtained CITI certification, and all processing and storage of the data itself is done solely on a dedicated server located on the medical campus. The data is first prepared for processing by converting it to a form in which it can be more easily handled by the main tools. Preprocessing is then done to extract features, followed by model selection using a variety of classifiers.
Data Preparation
The primary objective of the preparation stage is to get the data into a format that can be best used by the main processing tools. The data provided comes in the form of two files. One is a text file of patient encounter records and fields separated by pipes, exported from the medical campus’s EHR system. The fields hold information such as patient medical record number
(MRN), patient name, admitted and discharged date, note type and note text. The other is a file of comma separated values containing lab data and AUDIT records, the fields focused on are the patient MRN, demographic data fields, AUDIT scores and misuse diagnosis. The encounter records are associated by individual patients, and then AUDIT data is connected to patients to create a more easily parsed JSON file.
4
4
The next step is to determine which notes to focus on, and to aid in this, three lists of note types are provided: one containing note labels related to admission and consultation notes (“anc”), one for “lab” notes1
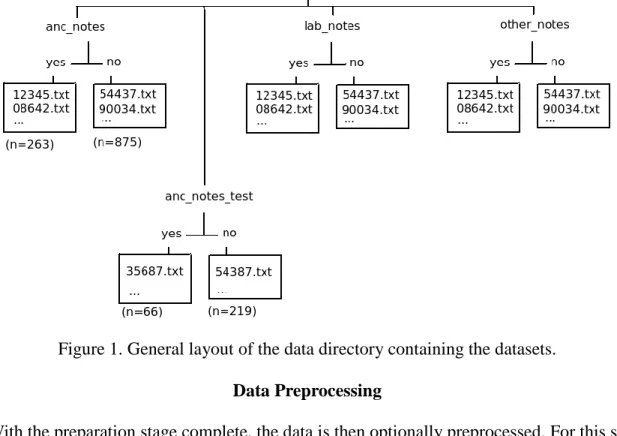
and a final for “other” miscellaneous notes. These lists are used as filters to then extract encounter notes from the JSON and save to text files named by patient MRNs, creating views of the data by note type categories. Additionally, the misuse information in the attached AUDIT data is used to create two sub-categories, “yes” and “no”, which provides an optimal processing format for the ML library. The main focus is placed on the “anc” category as this contains notes created by primary care provider, and so is most likely to have relevant information (Afshar 2017). Finally, a view of the data combining all note type categories is made by again using “anc” as the reference set and integrating data from the “lab” and “other” views. Each step as described represents a corresponding folder structure within the directory where the data resides. The final step of the preparation stage is to proportionately split the categorized notes into 4:1 train and test (holdout) sets for each unique data view. A random 20% of patients are selected from the main datasets and placed in a separate folder for final validation (Figure 1).
5
Figure 1. General layout of the data directory containing the datasets. Data Preprocessing
With the preparation stage complete, the data is then optionally preprocessed. For this study, several methods and combinations are attempted, including several custom solutions, and new data views generated. They include trimming the notes by using a list of key words and phrases (as determined from looking at the notes) to filter for sentences related to alcohol misuse, concept and sentence extraction with cTAKES, and regular expressions targeting significant text and extracting related values.
Two different types of trimming are done. In the first, the list of words, which includes terms such as “alcohol”, “beer”, “wine”, “disorient”, “drink”, “sober”, “intoxicated”, etc, is used with a regular expression that extracts individual sentences from the text to find sentences containing those indicated key words. These sentences are used to create a new, smaller view which will be easier to process computationally and also increases the accuracy of the models. The second type
6 of trimming simply extends the first by using a word2vec1 model that is pre-trained on the
MIMIC dataset (a large, open corpus of de-identified health data), and finds other potentially relevant keywords by searching with the existing keywords and a distance metric. The hope is that this addition captures other potentially relevant sentences which may be missed by the manually added keywords.
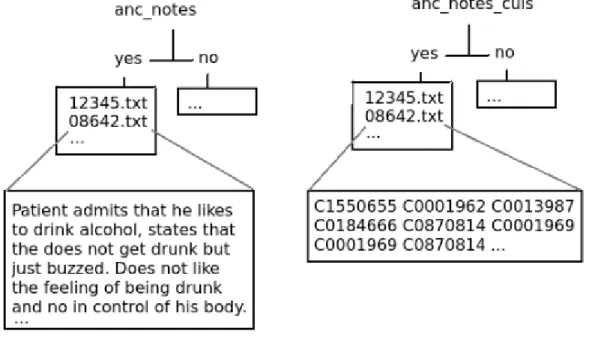
The most important preprocessor used in this study is the clinical Text Analysis and Knowledge Extraction System (cTAKES), which incorporates the Unified Medical Language System (UMLS) database of medical terms (Savova, 2010). Text is first annotated into special XML files, which then makes it possible to extract different kinds of information. Its main use is in the extraction of CUIs (concept unique identifiers) from the notes (Figure 2).
Figure 2. Sample from data views containing raw text (left) and matching CUIs (right). In order to detect more relevant CUIs, the UMLS dictionary is modified to allow the look-up of terms such as “wine”, “beer”, etc which are classified as food and are not included by default. A
7 sentence extraction feature is also used to extract sentences from the text, as it has specifically designed algorithms for finding medical-related sentence styles inherent in the notes.
Several regular expression-based algorithms are also used to target specific values which are likely to be in the text, or sentence structures which may be used to perform particular
calculations. These include sentence patterns which indicate a blood alcohol content (BAC) value may be present, as well as sentences which point to alcohol consumption patterns over a particular time. This data is used to create new sets of features, which can be used on their own or to augment other data views.
Another preprocessing step, which is mainly to enable proper processing by scikit-learn, is the conversion of the text to a numerical representation. As such, this is a precursor to the majority of the tasks done in the next stage.
Model Selection
The final and most important stage is to use machine learning (this study focuses on supervised learning1 methods) to create a model optimized to give the best prediction. This is
done by applying multiple classifiers to the different data views. The primary framework used here is scikit-learn, which provides a number of classifiers and other functionality to facilitate model creation and selection along with various metrics (Pedregosa, 2011).
First, a number of grid searches are done using the train portion of the various views and several classifiers2. The grid search for the main experiment is configured initially to search all
combinations of the classifiers with a narrowly defined set of hyper-parameters, all views,
1
This is where the task is to learn a function from a series of input-output pairs which can then be used to map future inputs to an output.
2 The primary classifiers from scikit-learn are LogisticRegression, PassiveAggressiveClassifier, LinearSVC, and
8 parameter sets to vary the final preprocessing (ie extraction of numerical features) done, and multiple metrics. Each combination utilizes 10-fold cross validation in an effort to offset the unevenness of the data and simulate having a larger dataset than is available. Average precision, recall and F1 scores (and in the second stage ROC AUC) across the folds, along with classifier hyper-parameters for each grid are recorded.
The next step is to extract results primarily according to a specified metric, or other
components such as the dataset or classifier. The most promising of these results are configured in subsequent grid searches with expanded hyper-parameters and the process is repeated until a single “best” model is achieved. This model is ran on the associated holdout set, which is also preprocessed with the same pipeline configuration as the corresponding train view.
The results of the grid searches, along with their associated inputs, are saved to auto-named results files in such a way that each grid in each set of results can be easily found and recreated partially or completely. In initial experiments, F1 score is selected as the primary metric as it is the most prevalent in the machine learning field used to determine how well a model performs, and so is instrumental in getting a set of well performing classifier given the type of data being processed. Later on ROC AUC is selected as the primary metric since it is most used in the medical field due to the importance of minimizing false negatives and maximizing true positives. Since results based on the ROC AUC and F1 metrics are not directly comparable, the grid search is again ran on the different configurations, but excluding classifiers that neither support finding a ROC AUC nor have acceptable performance when evaluating based on F1.
Once the final model has been found, the classifier and hyper-parameters are used to
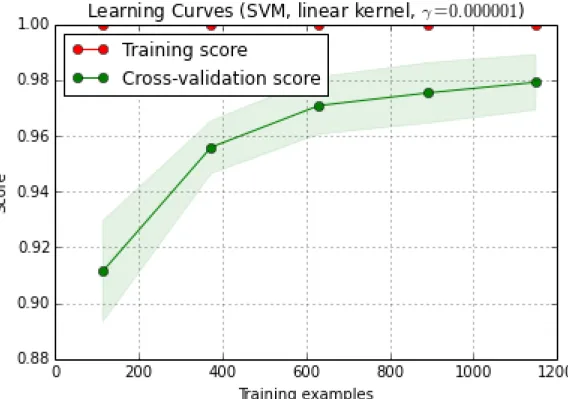
9 to 100% in equal steps, training multiple models using the different dataset sizes, and then
evaluating on the complete holdout set. This provides a series of plottable data points which, when graphed, typically show a curve that tells how the model improves as it is given more data, and by extension allows inference of how much room there is for improvement (Figure 3).
Figure 3. Sample learning curve showing score improvement as dataset size increases. Several baselines are also generated for the project using either the main data view “anc notes”, or information from the lab data:
A human-AUDIT gold standard in which 104 patients’ notes are randomly selected and misuse is determined by two trained technicians (in case of disagreement a supervisor makes the final judgment). This represents the bar that, if achieved through NLP and ML methods, signifies that machine performance is very likely on par with or better than human
10 Several grid searches involving data views created from: 1) a custom “weekly consumption”
extraction algorithm and 2) a custom algorithm to extract and create buckets of BAC value ranges. Trimmed notes are used for these searches.
A model created with the scikit-learn provided DummyClassifier, used on the “anc” view with default hyperparameters.
Using BAC values measured upon admission (stored in the lab data) and predicting cases >130mg/dL as misuse.
A custom rules-based classifier that searches the given data view for the occurrence of any of four words/phrases which are associated with alcohol misuse: “alcoholic”, “alcohol dependence”, “alcohol abuse” and “alcohol withdrawal”. If any of these are found, then it classifies that case as misuse.
This step was conducted not only to gain general information about how much improvement can be achieved on top of a simple rules-based approach, but also to get an idea of how different kinds of feature engineering methods can affect model score.
11
11 CHAPTER III
RESULTS
This chapter contains the most significant results of the study. It includes a breakdown of the data itself, the best performing models for the ROC AUC metric, and generated learning curve. The final model is also used to predict labels for the set of patients without AUDIT data, which gives a good idea of its real world performance.
Preliminary
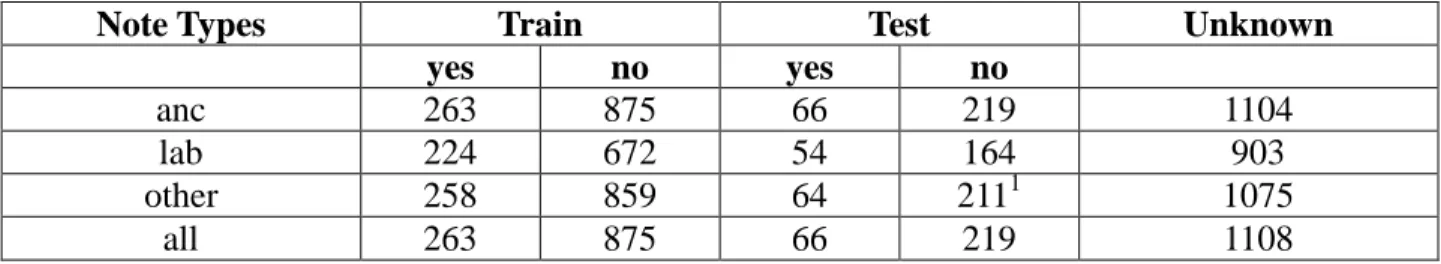
A total of 257,618 records were extracted from the provided notes text file, which yielded 2,534 individual patient notes after associating by MRN. The number of patients with AUDIT data, as found in the CSV file, was 1,508. Of these, 82 AUDITed patients did not have any associated notes, and were classified unknown. Categorizing the notes yielded patient proportions as follows:
Note Types Train Test Unknown yes no yes no
anc 263 875 66 219 1104
lab 224 672 54 164 903
other 258 859 64 2111 1075
all 263 875 66 219 1108
Table 1. Distribution of patient notes across note types and datasets.
12 Baselines
These are the performances of the baselines that were calculated: Classifier
Hyper-parameters
Features Precision Recall F1 ROC AUC
Human ANC notes 75% 64.3% 69.2%
Dummy Classifier
Default ANC notes 20.9% 19.9% 20.3%
BernoulliNB Default Weekly
consumption (from ANC
notes)
54.5% 18.4% 26.7% 65.7%
BernoulliNB Default BAC
mentions (from ANC notes) 59.9% 26.6% 36.6% 65.6% BAC >130 (from lab data) 68.6% 45.4% 54.6%
Rules-based ANC notes 61.5% 19.3% 28.5%
Rules-based All notes 58% 27.1% 36.1%
Table 2. Summary of baseline hyper-parameters and scores on several data views. Model Selection via F1 Metric
The top performing models in this stage were generated from LinearSVC and LogisticRegression trained on raw and feature engineered versions of the notes. Table 3 summarizes the top performing models. Results yielding an F1 of under 50% or using BAC information from the lab data were excluded.
13 Classifier Hyper-parameters1 Features Precision Recall F1
Logistic Regression
C=1, penalty=‘L1’ ANC notes 52.6% 52.7% 52.2%
LinearSVC C=0.1, loss=‘squared_hinge’, penalty=‘L2’ CUIs of trimmed ANC notes 49% 57.2% 52.5% Logistic Regression C=1, penalty=‘L1’ CUIs of trimmed ANC notes 50.2% 61.3% 54.9% Passive Aggressive Classifier C=0.1, loss=‘hinge’ CUIs of trimmed ANC notes 47.2% 62.1% 53.3%
Table 3. Summary of top grids as selected by F1 metric. Model Selection via ROC AUC Metric
In this stage, the number of classifiers used in the grid searches was reduced to two: LogisticRegression and LinearSVC, as these were the only ones from the initial experiments which support the “predict probability” function2
, which is required to calculate ROC AUC scores, and yielded acceptable performance. As with the previous stage, it was found that the best models are trained from the CUIs and other engineered features of the notes.
Classifier Hyper-parameters
Features Precision Recall F1 ROC AUC Logistic Regression C=10, penalty=‘L1’ ANC notes 50.4% 46.3% 47.7% 75.0% Logistic Regression
C=1, penalty=‘L1’ Engineered ANC notes3
53.3% 54.4% 53.5% 77.1%
Table 4. Summary of top grids as selected by ROC AUC metric for both raw and engineered notes.
1 Only hyper-parameters that were tuned are shown. 2
This functionality is not supported by the LinearSVC classifier, so it is replaced by it’s equivalent that supports it: SVC with the “linear” kernel.
14 Classifier
Hyper-parameters
Features Precision Recall F1 ROC AUC Logistic
Regression
C=1, penalty=‘L1’ Engineered ANC notes
53.7% 54.6% 54.1% 80.4%
Table 5. Results of evaluating the best model (from Table 4) on the test set. Learning Curve
Figure 4. Learning curve showing the performance of the engineered “anc” notes model as selected by ROC AUC.
Prediction on AUDIT-less Patients
The best model was finally used to predict misuse cases on the 1104 “anc” cases which did not have an AUDIT. Of the cases, 24.3% were labeled as misuse, which is essentially “consistent with the the proportion” seen in a separate “annotated dataset as well as other populations” (Afshar, 2018).
15
15 CHAPTER IV
DISCUSSION
Baselines
As shown by the baselines created by the DummyClassifier and RulesBasedClassifier, and then the scores achieved throughout the study, ML can be applied to clinical notes to make predictions. The feature engineered baselines however also show that there is a place for rules which can be used to extract additional useful information based on very corpus-specific features in the same way the cTAKES framework (and others) annotates and extracts concepts and other relevant information.
Model Selection
One thing of note in this stage was that even though the ROC AUC remained stable in the 70s when selection was done by F1, the F1 varied greatly during selection by ROC AUC. This was due greatly in part to the high skew of the dataset. The ROC is designed to show how the number of correctly classified positive varies vs the number of incorrectly classified negative examples, but doesn’t account for large skews in those positive vs negative examples, and so may make an algorithm seem to be performing better than it actually is. A score based on precision and recall however, such as F1, captures the effects of the skew on the algorithm’s performance (Davis 2006).
16
16
It was also noticed throughout the study that models with engineered features were constantly better than those without for both F1 and ROC AUC metrics. As such, better engineering will lead to even better models.
The learning curve created shows an upward trend with the available data, and so it can be inferred that the score will continue to improve with the provision of more data. That the model was able to give predictability on the notes without AUDIT data proportionally similar to that achieved on a separate human-annotated dataset shows that it provides good discrimination of patients with and without alcohol abuse.
Limitations
In reading some of the notes for some of the classified patients, this researcher observed that there were cases where the cues pointing to alcohol misuse did not align with their AUDIT result. This can be partly attributed to the possibility of some patients under-reporting their alcohol related practices, while care providers may record behaviors and other factors which state otherwise. This means the AUDIT data is independent of the note data, and as such these scores do not make for ideal labels for supervised learning.
Getting beyond this limitation involves annotating the notes in order to get labels which are dependent on them. Another method could be to attempt some error correction by excluding or reclassifying the misclassified cases which have a high probability of being in the other class, and retraining with the new dataset.
17
17 CHAPTER V FUTURE WORK Feature Engineering
As found in this study, feature engineering played a key role in creating the top performing models. The custom algorithms such as the “weekly consumption” and “BAC information” extractors were very rudimentary, and so can be improved upon.
Error Correction
As discussed in the limitations, the inherent cases of patients who under-reported on their AUDIT leads to the model not being as optimized as it could be. Implementing an automatic analysis and reclassification algorithm would enable the creation of better models with minimal human intervention.
Using All Note Types
Focus on the admission and consult notes led to the discovery of many features which can be used for misuse discrimination. Only initial experiments were done using the “lab” and “other” categories, and they generally gave comparable or worse performance compared to using only “anc” types. However, it may be worth discovering and extracting features with custom algorithms similar to those used in this study.
Ensemble Classifiers
This too is an unexplored possibility. Throughout the study it was discovered that some models had a high precision and low recall, and some had the inverse. Exploring combinations of
18
18
these classifiers may lead to the creation of models with high precision and high recall. Automated Pipeline
One of the objectives of this study is to create a pipeline that others can use to automatically process given notes and AUDIT data. As it currently stands, the pipeline created is not fully automatable, and is difficult to use at some parts. The code also needs some cleaning up and documentation. Doing this would make it easier for others who may want to use it.
19
19
REFERENCE LIST
Afshar M, Netzer G, Murthi S and Smith GS. “Alcohol Exposure, Injury, and Death in Trauma Patients.” J Trauma Acute Care Surg. 2015;79:643-8.
Afshar M. Correspondence on Slack Team Messenger. 06 Jun 2018. Afshar M. In-person meeting. Feb 2017.
Ananthakrishnan AN, Cai T, Savova G, Cheng SC, Chen P, Perez RG, Gainer VS, Murphy SN, Szolovits P, Xia Z, Shaw S, Churchill S, Karlson EW, Kohane I, Plenge RM and Liao KP. “Improving Case Definition of Crohn’s Disease and Ulcerative Colitis in Electronic Medical Records Using Natural Language Processing: A Novel Informatics Approach.” Inflamm Bowel Dis. 2013;19:1411-20.
Davis J, Goadrich M. “The Relationship Between Precision-Recall and ROC Curves.” University of Wisconsin-Madison Department of Computer Science. 2006.
Gentilello LM, Rivara FP, Donovan DM, Jurkovich GJ, Daranciang E, Dunn CW, Villaveces A, Copass M and Ries RR. “Alcohol Interventions in a Trauma Center as a Means of Reducing the Risk of Injury Recurrence.” Annals of Surgery. 1999;230:473-80; discussion 480-3.
Pedregosa et al. “Scikit-learn: Machine Learning in Python.” JMLR. 2011;12:2825-30. Rivara FP, Koepsell TD, Jurkovich GJ, Gurney JG and Soderberg R. “The Effects of Alcohol
Abuse on Readmission for Trauma.” JAMA. 1993;270:1962-4.
Saunders JB, Aasland OG, Babor TF, de la Fuente JR and Grant M. “Development of the Alcohol Use Disorders Identification Test (AUDIT): WHO Collaborative Project on Early Detection of Persons with Harmful Alcohol Consumption-- II.” Addiction. 1993;88:791-804.
Savova G, Masanz J, Ogren P, Zheng J, Sohn S, Kipper-Schuler K and Chute C. “Mayo Clinic Clinical Text Analysis and Knowledge Extraction System (cTAKES): Architecture, Component Evaluation and Applications.” JAMIA. 2010;17:507-513
doi:10.1136/jamia.2009.001560.
Stahre M, Roeber J, Kanny D, Brewer RD and Zhang X. “Contribution of Excessive Alcohol Consumption to Deaths and Years of Potential Life Lost in the United States.” Prev Chronic Dis. 2014;11:E109.
20
20
Xia Z, Secor E, Chibnik LB, Bove RM, Cheng S, Chitnis T, Cagan A, Gainer VS, Chen PJ, Liao KP, Shaw SY, Ananthakrishnan AN, Szolovits P, Weiner HL, Karlson EW, Murphy SN, Savova GK, Cai T, Churchill SE, Plenge RM, Kohane IS and De Jager PL. “Modeling Disease Severity in Multiple Sclerosis Using Electronic Health Records.” PLoS One. 2013;8:e78927.
21 VITA
Born and raised in St. Thomas, Jamaica, Andrew Phillips came to the USA in 2010 to pursue a degree in Philosophy at Divine Word College in Epworth, Iowa. He graduated Magna Cum Laude with a Bachelor of Arts dual major in Philosophy and Cross Cultural Studies in 2014. Having a passion for the field of Artificial Intelligence, Phillips joined Loyola University Chicago in Spring 2016 to pursue a master’s degree in Computer Science. For his Machine Learning course project, he elected to work with Drs. Dligach and Afshar in using NLP and ML to obtain useful insights from unstructured clinical notes, and continued this work in subsequent semesters as Independent Projects, which finally culminated in this thesis. During his study, he was offered three TA merit awards, two of which he accepted and assisted with an Introduction to Computer Science course followed by a Machine Learning course, but rejected the third in favor of a research fellowship award which gave the opportunity to continue working on the aforementioned project on a larger scale.
Phillips was a volunteer at Girls Who Code, Loyola Chapterfor two semesters, where he helped to teach young girls how to create programs in Scratch, and web pages with HTML and CSS. He also works on multiple personal projects, the majority of which are in some way related to automation and AI.