Analyse
Automatic bat call analysis with the
batcorder-system.
Description of automatic bat call identification procedure and advices for the interpretation and revision of results. - Ulrich Marckmann, Dr. Volker Runkel
Version 1.02 (August 2010)
Obs
eco
technology & service1. Contents
1. Introduction 21.1. Drawbacks and opportunities associated with acoustic species determination 2
2. The procedure of automatic call analysis 4
2.1. Statistical method and its characteristic values 5
3. Options for manual revision of analysis results 9 3.1. Assessment of species composition and abundances 10
3.2. Chronology of sequences 11
3.3. Closer inspection of individual sequences 12
4. Summary of revision advises 19
4.1. Known sources of error 20
Analyse
1. Introduction
The batcorder-system represents a new and powerful tool for an automated record-ing and species determination of bat calls. It enables you to quickly collect and analyse qualitative and quantitative data, thus per-mitting comparative field studies of bat ac-tivity ranges. As a novel system, it requires a solid examination of its techniques and opportunities in comparison with conven-tional methods.
Contrary to previous acoustic analysing tools, the batcorder-system automatically identifies and measures bat calls, and deter-mines the corresponding bat species by ap-plying advanced statistical methods. Since it is a black-box solution, one may ask for the reliability of the analysis and for a pos-sible revision of the acquired data. With the great amount of data that are automatically collected and analysed, such data revision and interpretation have to be adapted to the specific research issue.
This manual provides assistance for the au-tomated species determination and gives instructions for revising acquired data. We additionally recommend to consider the ad-vises given by the Landesamt für Umwelt Bayern (LfU), which complements this manual and lists determinations keys for Bavarian species (German only):
http://www.ecoobs.de/downloads/Kriter-ien_Lautzuordnung_10-2009.pdf
1.1. Drawbacks and opportunities as-sociated with acoustic species deter-mination
1.1.1. „Bats are not birds“
Most errors in acoustic bat species determi-nation are caused by the intraspecific vari-ability of echolocation calls. The resulting overlap in call parameters inevitably leads to some uncertainty in species determina-tion. Researchers often refer to an article written by Barclay (1999) “Bats are not Birds”, which explicitly describes the dilem-ma of call analysis: bats do not echolocate in order to broadcast their species belonging but to gather information about their envi-ronment and prey. Consequently, a reliable species classification via analyzing echolo-cation calls is limited and sometimes, under certain circumstances impossible.
Furthermore, the intraspecific call variabil-ity complicates a definite description and classification of a “typical call” of a species. Fewest species can be classified distinc-tively upon simple boundary values and parameters. In most cases, only a sophis-ticated linkage of several call properties permits a discrimination between similarly calling species. Specific recording condi-tions also have an influence on call meas-urements in the automated analysis. Sub-optimal records (intense echos, elevated acoustic noise) can lead to incomplete measurements of the signals, thus result-ing in doubtful call classifications. Since no analysing method will ever achieve an ab-solute certainty in species classification, it will always be essential to conduct an error estimation and an interpretation of results.
Analyse
1.1.2. Classification Rate and Quality In order to test the quality of a specific clas-sification method, one needs to refer to the rate of correctly classified test calls. The identified rate for the batcorder-system lies at 95%, which is an excellent value com-pared to values of manual and other auto-mated classification methods cited in the literature (Ahlen 1981; Fenton & Bell 1981; Weid & Helversen 1987; Fenton 1988; Weid 1988; Ahlen 1990; Zingg 1990; Herr et al . 1997; Vaughan et al . 1997; Ahlén & Baa-goe 1999; Barclay 1999; O’Farrell & Miller 1999; O’Farrell et al . 1999; Tibbels 1999; Jones et al . 2000; Parsons & Jones 2000; Russo & Jones 2002; Rydell et al . 2002; Obrist et al . 2004). Normally, this high rate cannot be accomplished in the field, be-cause only calls with suitable quality (with-out disturbances) are used for the training and testing of classification methods. Even under optimal conditions the remain-ing five percent account for a certain pro-portion of unclassified or incorrectly classi-fied calls. However, the batcorder-system is aimed at comparative studies in space and time and this remaining uncertainty is irrelevant for these investigations. Taken a study of a specific species’ habitat use: a few incorrectly classified sequences (Type-I Error; false-positive) at locations of little importance to this species are irrelevant to the outcome of the study because there will be hundreds of correctly classified records from locations that are preferentially used by this species.
1.1.3. Manual Check-up
Investigations with manual recording sys-tems (e.g. with time-expansion detectors) usually generate moderate amounts of data. Such comparatively small data sets permit a detailed analysis of each recorded signal. Ideally, the sonogram of each call is examined at the computer and even low quality records can possibly be assigned to
a species or group of species.
This is neither possible nor necessarily re-quired in surveys with the batcorder-system (or other passive monitoring systems) be-cause of the huge amount of collected data. Nevertheless, the batcorder-system’s anal-yses can and should be revised, in particu-lar if data are used to generate distribution maps or if they provide the basis for exper-tise on endangered and protected species in nature conservation. Besides, one has to keep in mind that the batcorder-system “only” provides the data and that it is neces-sary to interpret these data corresponding to specific research issues.
Analyse
2. The procedure of automatic call analysis
The automated call analysis (bcAdmin/batIdent) is not quite comparable with the determina-tion by an auditory impression (heterodyne/frequency division detectors) or with manually analysing sonograms of recorded calls at the computer. There are wide differences concern-ing error sources. In summary these are the characteristics of an automated analysis:
Öunbiased
Results do not depend on the user’s knowledge and ability.
Överifiable
Results are verifiable and reproducible at any time. Recorded files can always be re-analysed using other or improved programs.
Öuncritical regarding rare or locally uncommon species
Contrary to a manual species classification the automated analysis does not interpret results. There is no human factor (e.g. the knowledge of a species’ local distribution) that interferes and adulterates findings. There-by, the risk of circular reasoning is abandoned and thinking patterns like “it can’t be because it is not supposed to be” do not occur.
Ö judgement of calls/sequences uncoupled from their temporal
context
Since the analysis examines and classifies calls of a sequence sepa-rately, single outliers within a sequence are not so easily recognized. Temporal patterns of a sequence (e.g. consecutive recordings) are thus not considered by the automated analysis.
Ölimited decision criteria concerning the quality of signals
Dans la mesure où les signaux d’une séquence sont examinés et déter-minés séparément lors de l’analyse, les anomalies que peut comporter une succession de signaux sont plus difficilement identifiées. De même, les informations temporelles des séquences (par exemple succession directe de plusieurs enregistrements) ne sont pas prises en compte par l’analyse automatique.
Ölimited decision criteria concerning the quality of signals
An automated analysis system can decide whether to incorporate de-tected signals only to a certain extent. Most times a person that manu-ally examines recordings at the computer would immediately realise if signals are incomplete or if signals overlap with other signals. A trained person would also identify echoes, social calls or unknown types of calls. An analysis program does not possess this broad know-how. Although it uses criteria to assess call quality and identify outliers, it cannot cope with all possible situations.
Analyse
The results of the automated analysis highly depend on signal quality and on the technical equipment that is used for record-ing. For an appropriate measurement of pa-rameters, the signals must be above a cer-tain amplitude threshold and a reasonably good signal to noise ratio. Similarly, tech-nical recording characteristics (frequency response, directionality of the microphone, inherent noise, sample rate, and dynamic range) influence the measurement of sig-nal parameters. Therefore, an automated recording system can only achieve opti-mal results if training calls for the statistical identification procedure were recorded with the same technical equipment.
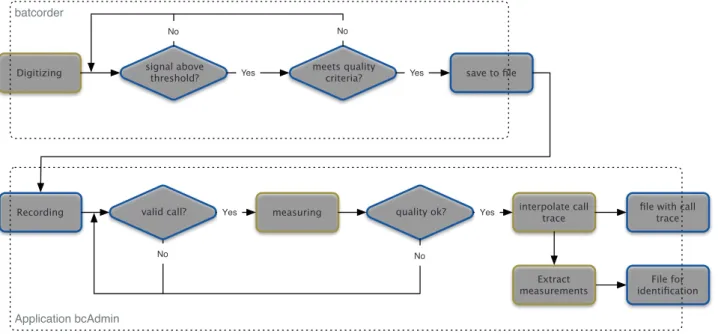
For this reason the batcorder-system is composed of harmonised hard- and soft-ware. The batcorder itself is designed to preferably record signals with appropriate quality and sound level. Accordingly, the automated call discovery and measurement of call parameters by the program bcAdmin (Fig. 1) is exactly adjusted to these record-ings in its default settrecord-ings. Furthermore, the statistical method of species determination in the program batIdent (former bcDiscrimi-nator) was trained with call parameters that were generated with analogous settings of the batcorder and bcAdmin. Modified re-cording- or bcAdmin settings may lead to an increased recording of calls with sub-optimal quality which in turn can result in imprecise or wrong species determinations. The statistical species determination is im-plemented in batIdent (former bcDiscrimi-nator) (Fig. 2). This open-source program takes the measured data from bcAdmin and thereby assigns calls to species groups or, if possible to a single species. For this, batIdent applies a multi-level method of dis-crimination called randomForest (Fig. 2 il-lustrates the tree of analysis).
A special SVM-Algorithm
(Support-Vector-Machine) identifies and rejects outliers (un-known and low quality calls) on each level. After all calls of a recording are analysed, up to three species are extracted from the list of classifications of individual calls of a sequence. For this, determined potential species/species groups are arranged ac-cording to the frequency of call occurrence and classification confidence. The deter-mination result is calculated if more than 2 calls and a mean probability greater than 60% is achieved. Resulting classification results of up to three determined species are summarised and saved in a file that can be imported to bcAdmin.
By this procedure calls are not necessar-ily determined to the species level. If for in-stance a discrimination is doubtful because of an overlap of calls from two species, a species group is given as result of the anal-ysis. Calls or signals that are unknown to the program are labelled as “spec”.
The analysis works even when several spe-cies are calling simultaneously because up to three species are extracted per se-quence. Additionally, the outlier analysis guarantees that improperly measured or unknown signals, which primarily had been assigned to a species but did not fit into the calling repertoire of this species are exclud-ed from the resulting species list.
2.1. Statistical method and its char-acteristic values
This chapter describes the informative val-ue of characteristic valval-ues of the statistical analysing method. Rates of dissociation in terms of confusion tables and classification confidence expressed as probabilities that are delivered for each analysed call are ex-amined in detail. It is important for the inter-pretation of results to understand how these values are produced and what significance they have.
Analyse
Fig. 1: Steps of analysis of the Batcorder and bcAdmin.
Fig. 2: Steps of analysis of batIdent/bcDiscriminator.
Application bcAdmin batcorder
Digitizing signal above threshold? meets quality criteria? save to file
Recording valid call? measuring quality ok? interpolate call trace
Yes Yes
No No
file with call trace
Extract
measurements identificationFile for
Yes Yes No No Application batIdent per call (1 … n) more steps available? measurements species assignmentrandomForest outlier-analysissvm p < 10% ? remove outlier
call
No
Yes
Yes No save call in results
save to result file extract max. 3
Analyse
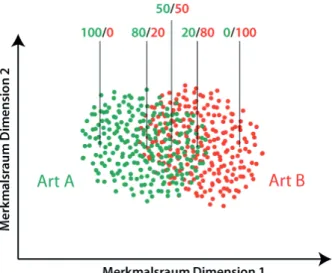
Figure 3 illustrates the (hypothetical) distri-bution of the training calls of two species within a character-/discrimination-space. From both species an equal number of calls are incorporated and the species’ intraspe-cific call variability is equally covered. There is a distinctive overlap between the two species. The markers show the assignment probabilities for specific call types within the character-space. As explained above,
these probabilities result from the amount of calls of a species that resemble the cor-responding call and therefore are closely located to them within the character space. Confusion tables and assignment probabili-ties are important statistical values and per-mit a comparison of different discrimination methodologies. Supplement 1 provides a confusion table with our discrimination rates As already mentioned above, the call by
call species discrimination is achieved by a statistical method called randomForest (Breimann 2001). To train this procedure, calls were sub-classified to “call types” for each species in order capture the whole intraspecific call variability. Approximately 500 calls per species were incorporated, containing all identified call types in equal parts. Confusion rate and thereby the qual-ity of the analysis was established by a set of test calls with known species belonging and displayed in confusion tables.
The main principle of the procedure is to compare every new call with the training
calls and to count how many similar train-ing calls there are within each species. The species with the most corresponding train-ing calls is taken and is displayed after the import to bcAdmin. If for example the pro-cedure finds 60 calls similar to training calls from species A and 40 similar to species B, the call is assigned to species A with a confi-dence of 60%. In bcAdmin the probability of species determination of a whole sequence is then composed of the mean probabilities of individual calls.
Tab. 1 gives an example on the basis of the confusion rate of individual calls from the Northern and Serotine Bat:
true
assignment Eptesicus nilssonii Eptesicus se-rotinus n false-positive Eptesicus nilssonii 529 66 595 11,02% Eptesicus se-rotinus 70 531 601 11,73% n 599 597 1196 false-negative 11,69% 11,05% 11,37%
Tab. 1: Confusion table of a randomForest analysis for individual calls from the Northern and Serotine Bat. True species are shown in columns and species assignments based on the analysis are shown in rows. The proportion of calls of a species that were incorrectly assigned to the other species are called false-negative assignments. The proportion of incorrect assignments in relation to the total amount of calls is called false-positive rate.
Analyse
for individual calls. batIdent’s sequence-wise summary of results and determination of doubtful calls (at the species group level) are disregarded in this table in order to keep it clearly arranged and and to facilitate the comparison with values of other methods. Confusion tables also provide useful infor-mation about the risk of an mix-up between pairs of species, which helps to interpret results in the field. Assignment probabilities are helpful to control the classification of in-dividual doubtful calls and sequences. However, confusion rates and assignment probabilities are primarily calculated for training and test calls and are not implicitly transferable to recordings in the field.
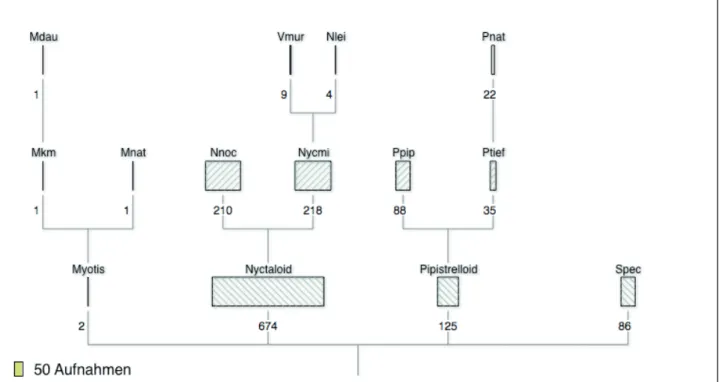
They are basically influenced by the number of calls belonging to a species, their quality and a weighting of different call types (Fig. 4). If two confusable species with an equal number of calls distributed evenly across their calling spectra are analysed, ninety percent of the calls are correctly assigned to the species and confusion rates match the rates of corresponding training calls (Fig. 4-A). However, if fewer calls of species B are included, the rate of false-negative as-signments remains constant but the rate of false-positive assignments of species B in-creases (Fig. 4-B). This instance becomes clearer, if we imagine a location where only calls of species A occur: statistically 10% of
these calls are assigned to species B. Thus, all (100%) assignments to species B for this location are incorrect (false-positive). In an-other example (Fig. 4-C) an equal number of calls of both species are detected but most calls from species B are located with-in the overlappwith-ing zone. As a result both, false-negative assignments to species B and false-positive assignments to species A increase. In such a case also assignment probabilities are misleading: the probability for calls within the overlapping zone should be 50% for both species because an equal number of training calls were incorporated in the statistical method for this scenario. In our example much more calls from species B are located within the overlapping zone. However, the probability of the occurrence of a calls from species B within the overlap-ping zone should be at 80%.
The chance of an ideal case as explained in example 4-A is quite low to occur in the field. Moreover, the quality of recorded calls in the field is often lower than calls we used to train and test the analysing method. There-fore, both confusion rates and assignment probabilities are important hints for the in-terpretation of discrimination results but are not ubiquitously applicable. Results should particularly be handled with caution if con-fusable species occur with highly unequal abundances.
Fig. 3: Distribution of calls from two species in a hy-pothetical character space with overlapping calling spectra. Numbers give assignment probabilities at distinct locations within the scatterplot.
Analyse
3. Options for manual revision
of analysis results
An examination of species identification results allows in many cases to find and eliminate mistakes. With a reasonable revi-sion of automatically classified sequences advantages of automated and manual spe-cies determination are combined and error sources of both techniques are minimised. There are several options to check results concerning plausibility and to re-determine species if necessary.
The extent of a revision depends on the scope of the study (e.g., scientific study vs. rough scanning), on the user’s experience, and on the potential occurrence of species at a given study location. It is for instance much easier to proof whether the Bar-bastelle Bat occurred as compared to the question whether Parti-Coloured Bats and Lesser Noctules occurred simultaneously at a study site.
The following criteria are available to revise and improve results of automated analyses:
Fig. 4: different call distributions of two species in a hypothetical character-space and the resulting confusion rates that emerge from applying always the same statistical method of discrimination. A: equal number of calls evenly distributed across the calling variability; B: significantly less calls of species B are included; C: equal number of calls - the majority of calls from species B are located within the overlapping zone.
Analyse
3.1. Assessment of species composition and abundances
With some experience wrong determinations can already be identified by inspecting the species composition and the amount of recordings per species or species group. If there are only a few recordings of a species (especially in relation to the complete amount of re-cordings) determinations should generally be treated more critically. Neither the automated nor a manual analysis can guarantee absolute reliability. One should always keep in mind that single sequences of a locally abundant species could be incorrectly classified. If the call repertoire of an abundant species considerably overlaps with repertoires of rare species, one should either accomplish a detailed analysis of the relevant sequences or consider the species classification as unreliable and consequently should ignore it.
The table shows the automatically analysed species composition of a location. Incorrectly classified sequences are highlighted in red; in fact only the Northern Bat (Eptesicus
nilsso-Ö The complete night
• Assessment of the whole species spectrum and frequencies of species determinations
• Chronology of call sequences
Ö Single call sequences
• Number of calls and assignment probability • Completeness / Quality of call measurements • Call amplitude
• Social calls
Analyse
are trustful because Myotis-species can hardly be confused with Northern Bat calls. bcAdmin (from v 2.0 on) includes a clas-sification tree of selected recording nights, which facilitates a revision as explained above (Fig. 5).
3.2. Chronology of sequences
The automated analysis does not comprise the temporal context of sequences. Several sequences of similar calls recorded in close succession clearly indicate an individual bat calling within the microphone’s range, e.g. while hunting for prey. Be careful if these sequences are assigned to different spe-cies or spespe-cies groups (especially if these
nii) and a unspecified Whiskered Bat (
Myo-tis brandtii / mystacinus) called at this
lo-cation. The occurrence of the Northern Bat can be viewed as a firm result based on the great amount of classified calls. There has been also been classified one sequence as Lesser Noctule (Nyctalus leisleri) and one as Savi’s Pipistelle (Hypsugo savii). Those
are very likely misclassifications because these species use quite similar calls like the Northern Bat. After an inspection the sequences classified as Barbastelle Bat
(Barbastella barbastellus) were quickly
re-vealed as echo fractions of Northern Bat calls. Even though only a few sequences were recorded, the Myotis-classifications
Fig. 5: bcAdmin’s classification tree for selected recording nights (from v. 2.0 on).
Fig. 6: A bcAdmin recording table shows a doubtful Nathusius Pipistrelle-classification (Pnat) within a block of Common Pipistrelles (Ppip).
Analyse
sequences “came” from confusable spe-cies) because there could be incorrect clas-sifications (Fig. 6). However, it can be in-terpreted as an affirmation of classification results if sequences of confusable species occur clearly separated in time.
3.3. Closer inspection of individual sequences
You should consider a closer inspection of sequences if species relevant to nature conservation or locally uncommon species were determined, or if only a few sequences of a species were recorded, or if the chro-nology of recordings indicate misclassifica-tions. In most cases a check-up of all se-quences is not possible due to its enormous time consuming effort; besides it is normally not necessary.
Following criteria are available for a revi-sion of individual sequences:
• number of calls and probabilities • correct and complete measurement
of calls?
• call amplitudes
• are social calls included?
• shape of calls and other measurable parameters
3.3.1. Number of calls and assignment probabilities
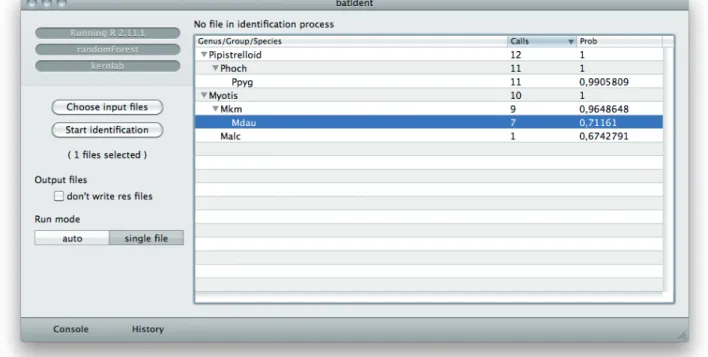
bcAdmin’s list of sequences gives number of calls and assignment probabilities next to species determinations that can be consult-ed for the revision of doubtful sequences. For an explanation of the statistical method-ology of species determination please refer to chapter 2.1.
The amount of recorded calls and their as-signment probability basically determines the reliability of species determinations (Fig.
7). It is unlikely that a few outliers within a sequence of many calls adulterate the clas-sification of the whole sequence. If however that sequence consisted of only a few calls, outliers can have a significant impact on the whole sequence and this may lead to an in-correct species determination.
Although batIdent/bcDiscriminator already includes the number of calls in its calcula-tions, there is no universal rule of how many calls and which assignment probabilities are needed to deliver correct species de-terminations. Since sequences with calls of the Common Pipistrelle are almost always classified with 90%, lesser assignment probabilities have to be considered critical-ly. Species calls of the Genus Myotis and Nyctalus hardly ever reach such high prob-abilities. A Daubenton’s sequence (Myotis daubentonii) with a probability of 80% is a secure result (ca. 1% false-positive classi-fications).
Calculated probabilities do not necessarily equal mean rates of correct call classifica-tions. Assignment probabilities merely de-scribe how the analysed call is ranked ac-cording to the training calls. A value smaller than 100% indicates that the call is located in the overlapping zone of at least two spe-cies. bcDiscriminator assumes that species with this calling type are equal in abundance and that their call repertoire has the same composition as the training calls. A good example to illustrate this problem is the pair of species consisting of the Alcathoe’s Bat (Myotis alcathoe) and the Common Pipist-relle (Pipistrellus pipistrellus):
Especially in or along dense vegetation the Common Pipistrelle tends to call with quite short and steep calling types, which are similar to calls of the Alcathoe’s Bat. If both would occur simultaneously and if both would call with their complete call reper-toire, batIdent would misclassify only 1% of all calls. A sequence with 98% assignment
Analyse
probability would have been classified cor-rectly in 98 of 100 cases on average. How-ever, if only the Common Pipistrelle would occur and fly close to dense vegetation, the rate of misclassifications would increase. In this scenario an Alcathoe’s-sequence with 98% assignment probability would always be misclassified.
Even species classifications with assign-ment probabilities of 100% cannot be con-sidered as absolutely secure determina-tions. For the training of batIdent only calls of good quality were used. If calls recorded in the field are not measured completely, resulting fractions can resemble calls of other species. Those can lead to misclas-sifications even though they were ranked with high assignment probabilities. And
even though the statistical method scans outliers (calls that do not occur within the known call repertoire of a species), some incorrectly measured signals can be mixed up with regular calling types.
This frequently happens when isolated end sections of Myotis-calls are measured. Concerning their length and frequency these fractions often resemble calls of the Barbastelle Bat (Barbastella barbastellus). In this case, calls can incorrectly be deter-mined as calls of the Barbastelle Bat al-though its calls are usually unmistakable. If you are interested in call-wise assignment probabilities (as opposed to sequence-wise probabilities), the summarised results of bcAdmin are not sufficient. Particularly if
Figure 7: The list extracted from bcAdmin shows a positive corelation of call number and identification prob-ability. The first two sequences, both containing only a single call, were identified on group level Mkm at a lower probability only. For example the fourth sequence with 21 calls gets identified as Myotis mystacinus/brandti at a much higher assignment probability.
Analyse
ing file in batIdent: the right side of the win-dow provides a decision tree, which depicts single analysis steps with its call numbers and assignment probabilities.
bcAdmin and bcAnalyze show species as-signments directly above calls in the Call
View Window and in the oscillogram re-spectively (Fig. 9 and 10).
In summary: given probabilities constitute an important and meaningful tool for the in-terpretation of results. However, these val-ues must not be viewed as absolute criteria several species are found within a
record-ing, these summaries do not provide the in-formation of which calls refer to which
spe-cies. Therefore you can examine files with batIdent (single file mode) in more detail. Figure 8 shows analysis results of a
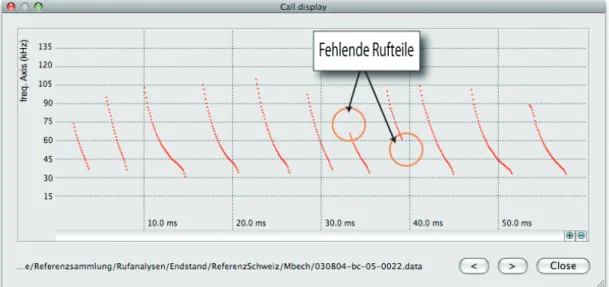
record-Fig. 9: Assignment probabilities in the Call Display of bcAdmin. Some echoes were measured and simply clas-sified as “Spec”. One call fraction was assigned to the Barbastelle Bat (Bbar) with a low probability. All other calls were properly measured and determined as calls from the Northern Bat (Enil), from which these calls in fact came from (the display of call results is available in version 1.15 and 2.0 respectively).
Fig. 10: Call-wise illustration of analysis results in bcAnalyze (available from version 1.07. on). Results are shown above calls if activated in the preferences. You can achieve more detailed information by right clicking on the grey boxes.
Analyse
for the examination of single calls although misclassification can quickly be found with some experience.
3.3.2. Are calls measured correctly and completely?
In bcAdmin you can display and quickly go through calls of a sequence in a frequen-cy-time diagram (call display). Incorrectly measured calls which might lead to wrong determinations stand out clearly in most cases (see also Fig. 9, 11, and 12).
There are several factors that can lead to faulty measurements like echoes (Fig. 11) and background noise. An echo that
overlaps with a call can be measured as a complete call which often happens with constant-frequency calls. Intense echoes of frequency-modulated calls often cause in-complete measurements. Echoes following calls without delay (e.g., Daubenton’s Bats closely above water; Fig. 14) produce os-cillating amplitudes (interferences). Gaps in calls cause incomplete measurements be-cause the algorithm only skips short gaps but aborts measurements when gaps are too large. Short call fractions are usually not suitable for a classification and are thus named “Spec.” (unidentifiable species). Sometimes such fractions resemble calls of other species (e.g., the Barbastelle Bat),
Fig. 11: Example of measured echoes: in this case no corruption of the sequence determination occurred be-cause a sufficient number of calls were measured properly.
Fig. 12: Example of lacking call beginnings and endings: again this did not influence the determination result significantly because a sufficient number of calls were measured properly.
Analyse
which can lead to misclassifications. An incomplete signal measurement can also arise from muted calls. In such cases typi-cally the beginning or the end of the call is lacking (Fig. 12).
These interfering factors are ignored by the discrimination algorithm to some extent, but with more improperly measured calls more incorrect call classifications occur. Several misclassified calls amongst regular calls within a recording file can lead to a mislead-ing determination of a “second species”. It is therefore advisable to check recordings with several species determinations.
Those error source are mostly visibly to the user in the call display of bcAdmin. However, for a closer analysis it might be necessary to examine the oscillogram and sonogram. Such an in-depth revision of measured calls is feasible in bcAnalyze.
3.3.3. Sound level of calls
Measurement quality increases with the sound volume of calls. Particular call begin-nings of frequency modulated calls (e.g., calls of the Genus Myotis) are quiet and
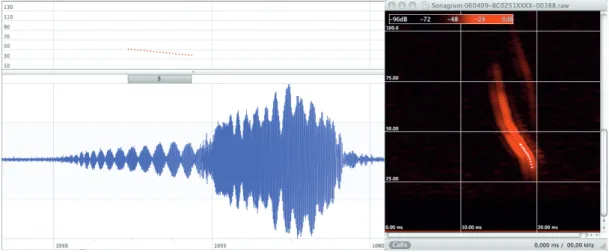
Fig. 13: Example of a sonogram: the call could not be measured completely due to overlapping echoes. White points within the call show the measured section.
Fig. 14: Call oscillogram and sonogram of a Daubenton’s Bat hunting above water. Oscillating amplitudes (beating waves) resulting from a pronounced overlapping echo are visible in the oscillogram. The sonogram unveils that the call is almost completely coalesced with its own echo. bcAdmin only identified a short part of the complete call. This fragment is shown above the oscillogram and marked by white points in the sonogram.
Analyse
are not detected in recordings with a low recording level. This can lead to an altera-tion of measurements such as starting fre-quency and call duration. The determina-tion of a sequence becomes equivocal if the sequence consists of only a few and quiet calls.
A control of the sound level is possible in bcAnalyze’s oscillogram view.
3.3.4. Social calls
A program for automated determination can only utilise calls for which it has been trained for. Calls that were not part of training calls are problematic for the program’s algo-rithm. For the training a substantial range of echolocation calls but almost no social calls were incorporated (except for the genus
Pipistrellus in batIdent). Apart from specific
locations (roosts) and certain times of the year (mating season) social calls are barely recorded in the field.
Bats emit different types of social calls re-garding their complexity: there are plain so-cial calls with only a single element but also complex social calls composed of several units. The former can be measured eas-ily unless they are not masked by echoes. The latter however are hard to measure automatically because they consist of an it-eration and combination of different call ele-ments. The statistical analysis is also more complicated because other parameters (es-pecially chronological features) have to be considered. Structures made of several syl-lables are easy to recognise manually but can hardly be extracted automatically. So-cial calls that are clearly separated in time are even more difficult to handle because they are recognised as single calls.
Moreover, some social calls greatly vary within species and other social calls are used in a similar way by many species (e.g., trills). All these factors impede an automat-ed determination so that a manual revision
becomes necessary. For this, especially the temporal aspect (chronology of recordings) is helpful. Social calls can be assigned to species if they lie in between sequences of temporally connected recordings which are correctly determined by the measurement of echolocation calls.
However, great numbers of social calls are rarely recorded in investigations. Dr. Volker Runkel conducted a comprehensive two-year study with automated species analy-ses for his Ph.D. thesis: for example in August 75% of all recordings of Soprano Pipistrelle’s (Pipistrellus pygmaeus) were social calls. In all the other months often much less than 25%, down to nearly 0% of all recordings were social calls. Species determinations were possible in most in-stances because the recordings contained enough clear echolocation calls. For Myotis
species less than one percent of all record-ings included social calls. Thus, social calls usually play no role in species determina-tion when using automated recording sys-tems due to their low occurence rate. They do not interfere significantly with the spe-cies determination of present spespe-cies. 3.3.5. Manual species determination via call shape and other measurable param-eters
In a sonogram manually or semi-automati-cally extracted measurements can be used for species determination on the basis of published measurements and own expe-rience. The call shape, which is manually compassed and described in a rather sub-jective way constitutes also an important criterion for the decision.
The calls of almost all species are vari-able and are adjusted to the momentary surroundings, function, and flight situation. Therefore, single parameters (e.g., ending frequency) are not sufficient for a reliable
Analyse
determination but several parameters and their interrelation have to be considered. The human perception is quickly overex-tended with such complex patterns and a statistical, automated species determina-tion mostly beats any manual assessment if enough well measured calls are avail-able. A manual revision is advisable for the verification of single recordings of eas-ily determinable species, for the examina-tion of sequences that were inadequately measured, or if sequences are “polluted” by social calls. It is important to keep in mind that the quality of any manual species de-termination depends on the user’s ability and experience. Therefore, any user should not overrate him- or herself and should de-termine doubtful recordings “only” in a con-servative manner.
The following table provides a challenge assessment of the manual species deter-mination of European bat species:
* Amateur I: without difficulty and unmistakable even for amateurs.
** Amateur II: without difficulty and unmistak-able for amateurs with some practice.
*** Expert I: mostly without difficulty and unmis-takable; there are some overlapping instances. **** Expert II: mainly difficult calling types that can be determined securely.
***** Expert III: very sophisticated - highly risky. Species/Group Challenge Rhinolophus hipposideros * Rhinolophus ferrumequinum * Genus Plecotus *** Barbastella barbastellus ** Vespertilio murinus ***** Nyctalus noctula *** Nyctalus leisleri **** Eptesicus serotinus **** Eptesicus nilssonii *** Hypsugo savii ** Pipistrellus kuhlii ***** (**) Pipistrellus nathusii ***** (**) Pipistrellus pipistrellus ** Pipistrellus pygmaeus ** Myotis myotis *** Myotis dasycneme *** Myotis alcathoe *** Myotis bechsteinii **** Myotis nattereri *** Myotis brandtii/mystacinus **** Myotis daubentonii *** Myotis emarginatus ****
This text is not intended to provide an over-view of call parameters and call character-istics of central-European species. For such information please refer to the literature: for example the leaflet “Kriterien für die Wer-tung von Artnachweisen basierend auf Lau-taufnahmen” which was developed in co-operation with the Koordinationsstellen für Fledermausschutz in Bayern (http://www. ecoobs.de/downloads/Kriterien_Lautzuord-nung_10-2009.pdf). Another good source is http://batecho.eu by Arjan Boonman.
Analyse
4. Summary of revision advises
• generally check species determinations that are based on only one or a few sequences
• always check rare or not expected species
• identify improperly measured calls, social calls or interfering sig-nals with the call view of bcAdmin
• if this does not clarify the case, examine the sequences by their sonogram in other programs
• doubtful sequences can be determined individually by batIdent • in case of doubt ignore species assignments of sequences within
a block of recordings of similar calling species • high error probability with low amount of calls
• higher error probability with decreasing sound volume
• higher error probability with increasing number of determined spe-cies per sequence
• do not overrate your own abilities when determining species man-ually
Analyse
4.1. Known sources of error
• very short calls of Pipistrellus pipistrellus and P. pygmaeus, and Myotis-calls that have not been measured to their end are frequently determined as Myotis alcathoe (often as a second species!).
• ending fragments of quiet Myotis-calls and short fragments of several other species are sometimes determined as Barbastelle Bat.
• Myotis bechsteinii is recognized insufficiently and often only assigned to the species
group “Mkm” (Myotis small/medium).
• calls of Daubenton’s Bats above water are often measured incompletely due to over-lapping echoes. Resulting fragments may lead to incorrect species determinations. • Short calls of Nyctaloid species are uspecific and are identified on genus/group level
or incorrectly classified.
• Fragments of echos of nyctaloid calls may be identified as social calls of Pipistrelloid species or Barbastelle calls (rarely).
• Vespertilio murinus is hard to identify and oftgen only determined on the level Nycmi.
Incorrect classifications as other nyctaloid species occur.
• Calls of Pipistrellus pipistrellus, P. pygmaeus and Miniopterus schreibersii overlap and are often classified as “Phoch” (high calling Pipistrelloids). Incorrect classifica-tions nevertheless occur (approx. 2% of all calls).
• Pipstrellus nathusii and P. kuhlii use very similar calls and thus often are misclassified
(20% error probability).
Furthermore software specific errors can occur, as described in the following: Typical errors of bcDiscriminator
• Social calls of the genus Pipistrellus are not recognized and classified as Spec. or a Nyctaloid call.
Typical errors of batIdent
• Daubentons/Pond bat calls are sometimes classified as Hypsugo savii.
• Nyctalus leisleri calls sometimes get classified as Eptesicus nilssonii.
Analyse
5. Bibliography
Ahlén, I. & H. J. Baagoe (1999). „Use of ultrasound detectors for bat studies in Europe: experiences from field identification, surveys, and monitoring.“ Acta Chiropterologica 1(2): 137-150.
Ahlén, I. (1981). Identification of Scandinavian Bats by their sounds. Uppsala, Dept. Wildlife. Ahlén, I. (1990). Identification of bats in flight, Swedish society for conservation of nature. Barclay, R. M. R. (1999). „Bats are not birds - a cautionary note on using echolocation calls to identify bats: a comment.“ Journal of Mammology 80(1): 290-296.
Breiman, L. (2001). „Random Forests.“ Machine Learning 45(1): 5-32.
Fenton, M. B. (1988). Detecting, recording, and analyzing vocalizations of bats. Ecological and beha- vioral methods for the study of bats. T. H. Kunz. Washington D.C., Smithonian Institution Press.
Fenton, M. B. & G. P. Bell (1981). „Recognition of insectivorous bats by their echolocation calls.“ Journal of Mammology 62(2): 233-243.
Herr, A., N. I. Klomp & J. S. Atkinson (1997). „Identifaction of Bat Echolocation Calls Using a Decision Classification System.“ Complexity 4: 11.
Jones, G., N. Vaughan & S. Parsons (2000). „Acoustic identification of bats from directly sampled and time expanded recordings of vocalizations.“ Acta Chiropterologica 2(2): 155-170.
O‘Farrell, M. J. & B. W. Miller (1999). „Use of vocal signatures for the inventory of free-flying neotropical bats.“ Biotropica 31(3): 507-516.
O’Farrell, M. J., B. W. Miller & W. L. Gannon (1999). „Qualitative Identification of free-flying Bats using the Anabat Detector.“ Journal of Mammalogy 80(1): 11-23.
Obrist, M. K., R. Boesch & P. F. Flückiger (2004). „Variability in echolocation call design of 26 Swiss bat species: consequences, limits and options for automated field identification with a synergetic pattern recognition approach.“ Mammalia 68(4): 307 - 321.
Parsons, S. & G. Jones (2000). „Acoustic identification of twelve species of echolocating bat by discri- minant function analysis and artificial neural networks.“ Journal of Experimental Biology 203(17): 2641-2656.
Russo, D. & G. Jones (2002). „Identification of twenty-two bat species (Mammalia: Chirop-tera) from Italy by analysis of time-expanded recordings of echolocation calls.“ Journal of Zoology London 258(1): 91-103.
Rydell, J., H. T. Arita & J. Granados (2002). „Acoustic identification of insectivourous bats (order Chiroptera) of Yucatan, Mexico.“ Journal of Zoology London 257: 27-36.
Tibbels, A. (1999). „Do Call Libraries Reflect Reality?“ Bat Resarch News 40(4): 153-155. Vaughan, N., G. Jones & S. Harris (1997). „Identification of british bat species by multivari-ate analysis of echolocation call parameters.“ Bioacoustics 7: 189-207.
ins-Analyse
besondere anhand ihrer Ortungsrufe.“ Schriftenreihe Bayr. Landesamt für Umweltschutz 81: 63-72.
Weid, R. & O. v. Helversen (1987). „Ortungsrufe europäischer Fledermäuse beim Jagdflug im Freiland.“ Myotis 25: 5-27.
Zingg, P. E. (1990). „Akustische Artidentifikation von Fledermäusen (Mammalia: Chiroptera) in der Schweiz.“ Revue suisse Zool. 97(2): 263-294.