Application Flow Control in YouTube Video Streams
Shane Alcock
University of Waikato Hamilton, New Zealand
[email protected]
Richard Nelson
University of Waikato Hamilton, New Zealand[email protected]
ABSTRACT
This paper presents the results of an investigation into the application flow control technique utilised by YouTube. We reveal and describe the basic properties of YouTube appli-cation flow control, which we termblock sending, and show that it is widely used by YouTube servers. We also examine how the block sending algorithm interacts with the flow con-trol provided by TCP and reveal that the block sending ap-proach was responsible for over 40% of packet loss events in YouTube flows in a residential DSL dataset and the retrans-mission of over 1% of all YouTube data sent after the appli-cation flow control began. We conclude by suggesting that changing YouTube block sending to be less bursty would greatly decrease the negative impact on video streams, im-proving performance and reducing bandwidth usage.
Categories and Subject Descriptors
C.2.0 [Computer Communications Networks]: General
General Terms
Measurement, Performance
Keywords
YouTube, Flow Control, Block Sending, Packet Loss, DSL
1.
INTRODUCTION
YouTube [1] is a video-on-demand service that allows users to stream user-generated video content through their web browser. According to the Alexa traffic rank [2], YouTube is currently the third most popular website on the Internet and has been noted in literature as being one of the primary causes behind the recent increases in HTTP traffic observed in measurement studies [3]. As a significant contributor to traffic observed on the Internet, it is especially important that YouTube traffic patterns are understood and modelled correctly by Internet researchers. There has been a notable quantity of work examining client behaviour, e.g. trends in YouTube video popularity [4] [5], but there has been little research into the behaviour of the YouTube servers them-selves. Rather, there seems to be an implicit assumption in the research community that YouTube traffic behaves in much the same way as any other large HTTP download.
This paper presents an initial look at the application flow control utilised by YouTube servers to conserve bandwidth and prevent the client connection from being saturated. We use passive packet header traces of YouTube traffic captured
from both an academic and a residential DSL network for our analysis. The YouTube application flow control, which we termblock sending, has not been previously described in literature. We derive and describe some properties of the block sending algorithm, including the block size and condi-tions for commencing block sending. We also examine how the algorithm performs in practice and identify instances where the YouTube flow control interacts poorly with the underlying TCP mechanisms, leading to increased conges-tion and packet loss.
The paper is arranged as follows. §2 explains the flow con-trol that can be used by a TCP connection, including at the application level. §3 introduces the datasets that we used in our analysis. §4 describes the block sending algorithm utilised by YouTube, based on our observations. §5 details our analysis of the YouTube behaviour and the subsequent results. §6 discusses related work and finally§7 concludes.
2.
BACKGROUND
One of the key features of TCP is the use of flow control mechanisms to ensure that TCP sessions transmit data at a fair rate that will not overwhelm the receiver or any of the links along the path. The most familiar forms of control are implemented within TCP itself and are applied to all TCP sessions that a host participates in, regardless of the application. These include the TCP congestion control and avoidance algorithms [6] and the TCP receive window [7].
For most TCP applications, the control provided by TCP is sufficient. Congestion control prevents the sender from congesting the path to the receiver, while the receive win-dow ensures that the receiver itself is not overwhelmed with more data than it can handle. However, it may also be de-sirable for the application to provide additional flow control if it is not strictly necessary for the application data to reach the client as fast as TCP would otherwise allow. Instead, the application will limit the rate at which data is passed to the network stack for transmission. The TCP control mechanisms still apply, though, so the effect of the applica-tion flow control may be reduced if the connecapplica-tion is already limited by the receive or congestion window.
Video streaming applications, such as YouTube, are an obvious example where application flow control could be useful. Assuming the user watches the video from start to finish, there is little to be gained from sending the client data far ahead of where they are currently viewing. Instead, the application can reduce its sending rate to ensure the client has enough data to play the video smoothly without overly congesting the network. As a result, other applications that
Name Duration Start Date Flows Bytes Auckland 7 days 2009/10/21 95,500 846 GB
ISP 7 days 2010/01/07 14,656 109 GB Table 1: The datasets used for this analysis.
the client is using can still achieve satisfactory throughput at the same time. Also, the server can avoid sending unwanted data to the client if the user decides to cease watching the video early, saving bandwidth.
Application flow control can have a significant impact on the models of network traffic that are used in research, such as simulation studies. Conventional TCP traffic models will not produce a realistic traffic pattern for applications that implement their own flow control. Therefore, it is important to measure and understand the application flow control tech-niques used by major TCP applications, such as YouTube, so that appropriate models can be developed.
Another reason for measuring application flow control is to evaluate if it is performing as intended, particularly in parallel with the underlying TCP control mechanisms. Ap-plication behaviour that may seem like a good idea can have unintended consequences at the TCP level, leading to ex-cessive packet loss, congestion window reductions and less-ened throughput. Discovering and highlighting such prob-lems will enable the application developers to rectify them, leading to improved application performance.
3.
DATASETS
For this study, we have examined YouTube video streams from two different packet header trace sets from the WITS archive [8]. The Auckland data set was selected from the Auckland X trace set that was captured in October 2009 at the University of Auckland, New Zealand. At the time of capture, KAREN (the New Zealand research and education network) [9] peered directly with the Google autonomous system that YouTube is hosted within. As a result, all con-nections between Auckland and YouTube were over a re-search network with high bandwidth and capacity. This en-abled us to examine YouTube behaviour in a context where congestion (and resulting packet loss) is minimal.
The ISP data set was extracted from the ISP C-II trace set that was captured from a New Zealand ISP in January 2010. We filtered the traces to only include residential DSL customers, i.e. excluding corporate or wireless users. Con-nections between the ISP users and YouTube occur over links with a much lower capacity and bandwidth per-user. Therefore, packet loss due to congestion is very common. In contrast to the Auckland data, this dataset allowed us to in-vestigate the performance of YouTube from the perspective of the average consumer.
We filtered the unencrypted packet traces to only include traffic to and from IP addresses that resolved to known host-names for YouTube video servers. The IP addresses were helpfully provided by one of the authors of [10]. The filtered traces were then processed using the flight analysis module included with thetcpcsmtool [11] to produce a record of ob-served TCP flights and loss events for each YouTube flow. For applications where the sender is unlikely to be waiting on user interaction, such as video streams, the flight sizes should match the largest amount of data that the sender can transmit within the limits of the congestion and flow
3000000 2000000 1000000 0 30 s 20 s 10 s 0 sequence offset relative time . . . . . . . . . . . . . . . .. . . . . . . . . . . . . . . . . . . . . . . .... .. .. .. .. .. .. . .. .. . .. .. . .. .
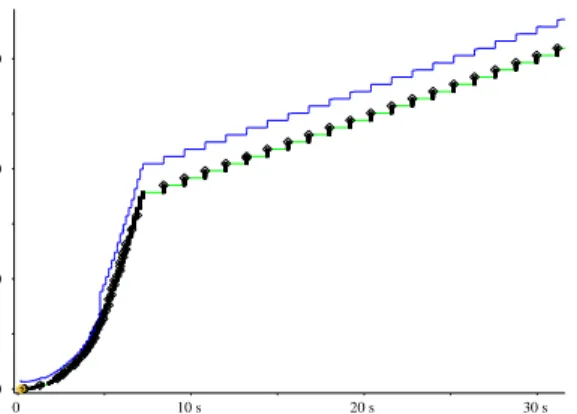
Figure 1: A time sequence graph of a YouTube video stream flow from the Auckland dataset.
control algorithms. We can therefore examine the sending behaviour of the YouTube servers by analysing the pattern of flights sent for each video stream.
Following this step, we discarded flows where the server transmitted less than 1 MB of data, as these were too short to provide any reliable information about the application flow control. The resulting datasets are described in Table 1. The filtered YouTube datasets represent 7.4% and 3.9% of the TCP port 80 traffic observed in the Auckland and ISP traces respectively for the measured time period. Note that the datasets do not include traffic to local YouTube caches.
4.
YOUTUBE FLOW CONTROL
Figure 1 is a time sequence graph created usingtcptrace
[12] that depicts a typical YouTube video stream flow from the Auckland dataset. The thick dark lines show the data segments that were sent by the YouTube server. The dot-ted line drawn above the data flights represents the space remaining in the client receive window, while the line below the flights shows which data segments have been acknowl-edged.
The pattern of flights clearly changes approximately eight seconds into the flow. Prior to that point, the sending pat-tern conforms to the expected TCP slow-start behaviour, where the sending rate grows as data is successfully received and acknowleged by the client. Afterwards, the sender trans-mits data at a constant rate that is much slower that what had been achieved earlier. As no packets were lost, the sender should not be limited by its congestion window. The receive window line also clearly indicates that the client can accept more data than the server is providing.
Therefore, we conclude that the YouTube application is responsible for the decreased sending rate. We observe that the application is writing consistently sized blocks to the network stack at a reduced rate to limit the amount of data that is sent to the client. The YouTube server sends the video as fast as possible for an initial buffering period before settling into the constant sending rate. This rate is probably at or slightly above the playback speed, so as to maintain the buffer and ensure smooth playback for the client while minimising the amount of bandwidth used by the flow.
Based on manual inspection of the flight records and time sequence graphs for individual YouTube flows, we summarise the primary characteristics of the YouTube application flow
control (which we shall henceforth refer to asblock sending) as follows:
• The gap between blocks greatly exceeds the inter-flight gaps observed during the initial buffering phase. This gap often exceeds one round-trip time (RTT).
• The packet rate when transmitting blocks is very high; flights sent during block sending have very short dura-tions, i.e. time between the first and last packet.
• The block writes are typically a multiple of 64 kilobytes in size, with a few rare exceptions (see§5.1).
• Flight sizes during block sending will never exceed the congestion or receive windows, so a block can be (and often is) split over multiple flights.
• The time between each block write is very consistent. Any additional delay in sending a block is compensated for when transmitting subsequent blocks, so that the constant sending rate is maintained overall.
• After packet loss, block sending usually concludes and the congestion window will dominate the sending pattern again. However, once the congestion window has recov-ered sufficiently, block sending may then resume.
5.
ANALYSIS
To examine YouTube application flow control in more de-tail, we developed a tool to detect block writes from the flight records for each YouTube flow that we had extracted earlier usingtcpcsm. The block detection algorithm is based heavily on the block properties described in§4, albeit with many refinements to correct misclassifications identified dur-ing testdur-ing1. The tool can detect complete blocks of any size
from 64 KB upwards but it also reports instances where the server appeared to be sending a block but was interrupted by a loss event before having sent 64 KB.
For each block detected, our tool reports the block size, duration, start time, number of prior loss events and the block transmission rate (BTR). The BTR is calculated by dividing the size of the block by the time difference between the start of the block and the start of the next one. If no block immediately follows the current block, the BTR is not reported. Our tool also calculates the median BTR for each flow. As we have defined block sending behaviour as having a consistent transmission rate, our tool requires at least half of the BTR values to be within 2% of the median to report a valid BTR for a flow.
5.1
Prevalence of Block Sending
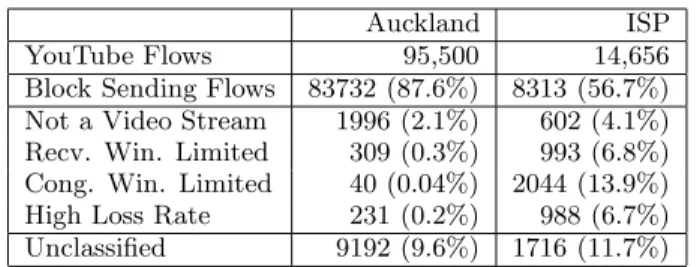
To begin, we investigated the prevalence of block send-ing behaviour in both datasets to determine whether block sending is commonplace or an isolated event. The results are presented in Table 2.
The rate of block sending in the ISP dataset was surpris-ingly low (only 56.7% compared with 87.6% in the Auckland data), so we further categorised flows that did not block send based on situations that could prevent the flow from
1The entire algorithm is too complicated to fully describe
here. Instead, we refer to the source code for our tool which can be downloaded fromhttp://www.wand.net.nz/
~salcock/tcpcsm/yt_model.py.
Auckland ISP YouTube Flows 95,500 14,656 Block Sending Flows 83732 (87.6%) 8313 (56.7%) Not a Video Stream 1996 (2.1%) 602 (4.1%) Recv. Win. Limited 309 (0.3%) 993 (6.8%) Cong. Win. Limited 40 (0.04%) 2044 (13.9%) High Loss Rate 231 (0.2%) 988 (6.7%) Unclassified 9192 (9.6%) 1716 (11.7%) Table 2: Number of flows in each dataset where we detected block sending. The additional categories describe possible situations where a flow is unlikely to block send. 0 0.2 0.4 0.6 0.8 1 0 64 128 192 256 CDF Block Size (KB) Auckland ISP
Figure 2: Distribution of the size of blocks sent by YouTube servers during the block sending phase. The X-axis has been truncated at 300 KB for read-ability.
employing block sending. First, we used simple deep packet inspection to identify flows that were not FLV video streams and therefore unlikely to be using the YouTube application flow control. This was done by searching for a packet where the first three bytes of payload were “FLV”2.
We also identified flows where the TCP control mecha-nisms were likely to prevent the sender from block sending in a detectable fashion. Flows where the receive window never exceeded 20 KB were classed as receive window lim-ited. If the flow was not receive window limited but the flight size never exceeded 20 KB, the flow was classed as congestion window limited. Finally, flows that did achieve a large congestion window but still had a high rate of packet loss (we used less than 250 KB of new data per loss event as the threshold) were classed as high loss flows. The number of flows that matched each of these categories are shown in Table 2.
Ignoring the flows where block sending would have been unlikely to occur, the proportion of flows where block send-ing was detected by our analysis tool increases to 90.1% for the Auckland dataset and 82.8% for the ISP dataset, sug-gesting that block sending is standard practice for YouTube servers.
5.2
Block Sizes
Figure 2 shows the distribution of block sizes in the Auck-land and ISP datasets. 64 KB is easily the most common block size, accounting for 97% of blocks in the Auckland
2This was possible because the original trace files had
0 500 1000 1500 2000 2500 3000 3500 0 5000 10000 15000 20000 25000 30000 35000
Block Transmission Rate (Kbps)
Initial Buffer Size (KB)
(a) Auckland 0 200 400 600 800 1000 1200 0 2000 4000 6000 8000 10000 12000 14000
Block Transmission Rate (Kbps)
Initial Buffer Size (KB)
(b) ISP
Figure 3: Scatter plots showing the relationship between the number of bytes sent during the initial buffering phase and the block transmission rate for each YouTube flow.
data and 79% of blocks in the ISP data. Block sizes that are a multiple of 64 KB are also prominent in the ISP distri-bution. We believe that the 64 KB block size arises from the video files being stored on servers using the Google File Sys-tem (GFS) [13]. GFS divides files into 64 MB chunks, which are then further split into 64 KB blocks for checksumming purposes. To maximise performance, the YouTube server reads and writes the 64 KB blocks directly wherever possi-ble, producing the results shown in Figure 2.
Blocks smaller than 64 KB, as observed in the ISP data, were blocks that were interrupted by packet loss before the block was completed. Nearly 10% of all blocks in the ISP data were interrupted in this fashion. Finally, we note that a small proportion of blocks in the Auckland data range between 96 and 128 KB in size. Manual validation has shown that the blocks were correct, but we are yet to find a suitable explanation for blocks of that size.
5.3
Initial Buffering
Next, we examined the initial buffering period to deter-mine the conditions that must be met for a YouTube server to commence block sending. We deemed the initial buffer-ing period to be over as soon as our analysis tool detected a block (complete or interrupted). There was no consistent flow duration or number of bytes sent before each flow be-gan block sending, but we did find that there was a strong linear relationship between the number of bytes sent during the buffering phase and the median block transmission rate, as shown in Figure 3.
Only flows for which we could determine a valid median BTR are represented in Figure 3. This proved problematic for the ISP dataset, as many blocks were immediately fol-lowed by packet loss events that ended block sending (we examine this problem further in§5.4), preventing us from calculating the BTR. As a result, only 45% of the 8313 ISP flows are represented in Figure 3(b). By contrast, 81% of block-sending flows from the Auckland data are shown in Figure 3(a). However, we see that video streams utilising a higher bit-rate during block sending transmit a proportion-ately larger amount of data during the buffering phase. The Auckland data also has some horizontal banding, which may be due to a minimum block transmission rate being enforced for some flows.
For each flow, we also divided the initial buffer size by the median BTR to calculate the time that would have been
0 0.2 0.4 0.6 0.8 1 0 16 32 48 64 80 96 CDF
Seconds to Transmit Initial Buffer at Block Rate
Auckland ISP
Figure 4: CDF of the time needed to transmit the initial buffer for a YouTube flow using the subse-quent block sending rate. The X-axis has been trun-cated at 100 seconds.
required to transmit the initial buffer using block sending. The distribution of those values is presented in Figure 4, which shows that the initial buffer was equivalent to 32 sec-onds of block sending for the vast majority of YouTube flows in both datasets.
5.4
Interaction with TCP
Figure 5 is a time sequence graph showing part of a flow from the ISP dataset. The first 12 seconds of the flow (which we have mostly omitted) covers the initial buffering period. The first block can be identified by the long pause prior to a large burst of packets. However, this is immediately followed by a packet loss event, as indicated in the graph, which results in the TCP congestion control reverting to slow start. In this context, a packet loss event refers to a retransmit that leads to TCP loss recovery (either a fast retransmit or a retransmit timeout). Multiple packets may be retransmitted in response to a loss event. Once the congestion window has grown again, there are two more attempts at block sending which both appear to lead to packet loss as well.
Therefore, we propose that block sending is responsible for the packet loss, especially given that no loss was observed during the initial buffering phase. The application delays pushing the block onto the TCP stack, meaning that the congestion and receive windows are empty by the time the block is written. As a result, the entire block is
transmit-2000000 1800000 1600000 1400000 20 s 15 s sequence offset relative time R R R R R R R R R R R R R R 3 Loss Events R R R R R R R R R R R R R R R R R 3 R R R R R R R R R R R R R R 3
Figure 5: A time sequence graph showing a YouTube flow from the ISP dataset. Every attempt at block sending is immediately followed by packet loss.
ted immediately as a burst of packets, effectively creating congestion. The idle time prior to writing the block is not long enough for congestion window reduction [14] to be em-ployed, yet other competing flows may have increased their congestion window in the interim, further contributing to path congestion.
This short-term congestion leads to a much higher prob-ability of packet loss, resulting in otherwise avoidable re-transmissions as well as forcing the TCP implementation to reduce the congestion window. This will lessen the through-put for the video stream until the window recovers. If this problem is widespread, it would suggest that the YouTube application flow control is detrimental, rather than benefi-cial, to the client experience and may need to be re-evaluated by the YouTube developers.
We have used two different definitions to determine whether a packet loss event in our datasets was caused by block send-ing. The first, and strictest, definition states that a loss event was caused by block sending if preceded by one (and only one) block, similar to the events depicted in Figure 5. Henceforth, we shall refer to this definition as definition A. The second definition states that if a loss event is preceded by either one or two blocks then it was caused by block sending. The reasoning is that the first block can often be transmitted without packet loss but can still create sufficient congestion that the following block will be disrupted.
Table 3 presents the proportion of loss events and retrans-missions that can be attributed to the YouTube application flow control, along with some general statistics about the overall loss and block rates. For this analysis, we have ig-nored loss events, retransmits and bytes sent prior to the first block observed for each flow, i.e. the initial buffering period. Also, when calculating the number of bytes retrans-mitted, we have assumed a worst-case scenario of 1500 bytes per retransmit.
The results show that loss events and retransmissions are much more common in the ISP data, which is not surprising. ISP flows also transmitted fewer blocks than Auckland flows, presumably because the higher loss rate frequently disrupted the block sending process. Up to 40% of all loss events and nearly half of all retransmits in the ISP dataset could be attributed to congestion caused by block sending. This resulted in between 1 and 1.5% of the YouTube traffic in
Auckland ISP Block Sending Flows 83,732 8,313 Avg. Megabytes per Flow 8.13 6.53 Avg. Loss Events per Flow 2.13 21.91 Avg. Blocks per Flow 115.88 18.10 Avg. Blocks per Loss Event 54.3 0.83 Avg. Retxs per Flow 9.94 139.15 Avg. Retxs per Loss Event 4.66 6.35 Loss Events matching def. A 5.8% 27.8% Loss Events matching def. B 9.8% 40.1% Retxs matching def. A 4.6% 36.0% Retxs matching def. B 8.1% 47.5% Bytes retransmitted (def. A) <0.01% 1.1%
Bytes retransmitted (def. B) <0.01% 1.5%
Table 3: Statistics describing the proportion of loss events and retransmits that can be attributed to block sending using definitions A and B.
0 0.2 0.4 0.6 0.8 1 0 0.2 0.4 0.6 0.8 1 CCDF
Block Loss Rate Auckland (A)
Auckland (B)
ISP (A) ISP (B)
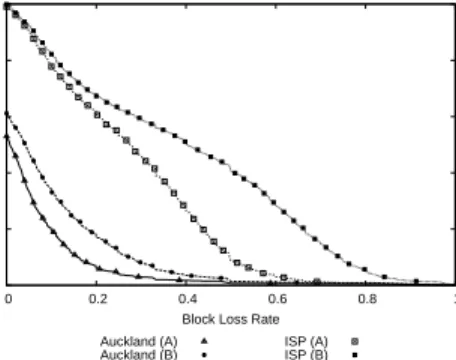
Figure 6: CCDF of loss events against the flow block loss rate.
the ISP dataset being retransmitted due to block sending. The impact on the Auckland data was not negligible either; nearly 10% of loss events were attributable to block sending, although the overall proportion of traffic retransmitted was very low. However, this suggests that the bursty nature of block sending can still cause problems even in excellent network conditions.
Finally, we examined the block loss rate (BLR), which we defined as the proportion of loss events for a given flow that could be attributed to block sending. Figure 6 is a CCDF showing the distribution of loss events in terms of the BLR of the flow that they occurred in. The Auckland results show that the vast majority of loss events occurred in flows with a low BLR value, meaning that block sending was seldom the leading the cause of packet loss in Auckland flows. A significant proportion of loss events occurred in flows where the BLR was zero, i.e. no loss events could be attributed to block sending.
By contrast, almost all ISP flows have a BLR greater than zero; block sending was responsible for at least one loss in al-most every flow where block sending was detected. Also, the impact of block sending is much greater in the ISP dataset compared with Auckland. Using defintion B, over 40% of loss events occurred in flows where the BLR is greater than 0.5. This suggests that many residential DSL users would see a significant improvement in YouTube performance if the application flow control was changed to be less bursty.
6.
RELATED WORK
Unsurprisingly, YouTube has been a popular research topic in the Internet measurement community recently. Much of this work has focused on the characteristics of YouTube con-tent, such as file size, bit-rate and popularity. Examples of such work are [4], [5], [15] and [16]. By contrast, our research has examined individual YouTube flows in greater detail to investigate how the YouTube content is delivered to clients and characterise the behaviour of the YouTube server ap-plication. There is some overlap, though; for instance, our results suggested there is a much broader range of video bit-rates than demonstrated previously. We suspect this is due to YouTube supporting a greater variety of video resolutions than when the earlier studies were conducted.
[17] noted that YouTube content delivery is rate limited, with a maximum transfer rate of approximately 1.25 Mbits/s. Our work elaborates on this finding by revealing how the rate limiting is performed and evaluating the effect on stream-ing performance. The authors of [17] also found that many YouTube transfers achieved low throughput over DSL con-nections but claimed that the application was not responsi-ble for the poor performance. Our results disagree with the latter claim, as we have found that block sending by the ap-plication can cause congestion and packet loss, particularly for DSL clients, which may account for the low throughput observed by [17].
Finally, [10] developed a technique for identifying traf-fic flows for various video streaming applications, including YouTube. The authors generously provided us with their list of YouTube server IP addresses which we used to create our own datasets.
7.
CONCLUSION
There are two principal conclusions that we draw from this research. Firstly, YouTube implements a previously undoc-umented form of flow control at the application level, which we call block sending, that operates in addition to tradi-tional TCP flow control mechanisms. We have been able to detect block sending in over 80% of YouTube flows that we examined, from both residential DSL and academic net-works. We have also presented research that examines block sending in more detail, showing that the blocks are typically 64 KB in size (matching the block size used by GFS) and that the amount of data sent during the initial buffering period is equivalent to 32 seconds of block sending.
The second conclusion is that block sending can have a detrimental effect on YouTube flow performance, particu-larly if the client is streaming the video over a congested link. Blocks are typically transmitted as a large burst of packets, creating additional congestion and often leading to packet loss. Our analysis showed that over 40% of the packet loss observed by YouTube clients using residential DSL could be attributed to congestion caused by block sending. These loss events resulted in a data retransmission rate of 1.5% of all bytes sent once block sending began.
We believe a simple modification to the block sending algorithm to spread the transmission of each block over time rather than the current bursty approach would offer improved YouTube performance and reduce the bandwidth used by YouTube servers. The largest improvements would be seen by YouTube clients using congested or poor-quality connections, but well-connected clients would also see some
benefit.
8.
REFERENCES
[1] “YouTube,” http://www.youtube.com. [2] Alexa, “Top 500 Global Sites,”
http://www.alexa.com/topsites.
[3] G. Maier, A. Feldmann, V. Paxson, and M. Allman, “On Dominant Characteristics of Residential
Broadband Internet Traffic,” inIMC ’09: Proc. of the 9th ACM SIGCOMM Conference on Internet
Measurement Conference. New York, NY, USA: ACM, 2009, pp. 90–102.
[4] M. Cha, H. Kwak, P. Rodriguez, Y.-Y. Ahn, and S. Moon, “I Tube, You Tube, Everybody Tubes: Analyzing the World’s Largest User Generated Content Video System,” inIMC ’07: Proc. of the 7th ACM SIGCOMM conference on Internet
measurement. New York, NY, USA: ACM, 2007, pp. 1–14.
[5] M. Zink, K. Suh, Y. Gu, and J. Kurose,
“Characteristics of YouTube Network Traffic at a Campus Network - Measurements, Models, and Implications,”Comput. Netw., vol. 53, no. 4, pp. 501–514, 2009.
[6] M. Allman, V. Paxson, and E. Blanton, “RFC 5681 -TCP Congestion Control,” September 2009.
[7] J. Postel, “RFC 793 - Transmission Control Protocol,” September 1981.
[8] WAND Network Research Group, “WITS,” http://www.wand.net.nz/wits/.
[9] “KAREN: Kiwi Advanced Research and Education Network,” http://karen.net.nz/home/.
[10] T. Mori, R. Kawahara, H. Hasegawa, and
S. Shimogawa, “Characterizing traffic flows originating from large-scale video sharing services,” inTraffic Monitoring and Analysis: Second International Workshop, TMA 2010. Springer, 2010, pp. 17–31. [11] WAND Network Research Group, “tcpcsm,”
http://research.wand.net.nz/software/tcpcsm/. [12] S. Ostermann, “tcptrace,” http://www.tcptrace.org/. [13] S. Ghemawat, H. Gobioff, and S.-T. Leung, “The
Google File System,”SIGOPS Oper. Syst. Rev., vol. 37, no. 5, pp. 29–43, 2003.
[14] M. Handley, J. Padhye, and S. Floyd, “RFC 2861 -TCP Congestion Window Validation,” June 2000. [15] X. Cheng, C. Dale, and J. Liu, “Statistics and social
network of youtube videos,” inProc. of IEEE IWQoS, 2008.
[16] P. Gill, M. Arlitt, Z. Li, and A. Mahanti, “YouTube Traffic Characterization: a View from the Edge,” in
IMC ’07: Proceedings of the 7th ACM SIGCOMM conference on Internet measurement. New York, NY, USA: ACM, 2007, pp. 15–28.
[17] L. Plissonneau, T. En-Najjary, and G. Urvoy-Keller, “Revisiting Web Traffic from a DSL Provider Perspective: the Case of YouTube,” inProc. of the 19th ITC Specialist Seminar, 2008.