Do Developers Feel Emotions?
An Exploratory Analysis of Emotions
in Software Artifacts
Alessandro Murgia
Parastou Tourani
Bram Adams
Marco Ortu
University of Antwerp, Belgium École Polytechnique de Montréal, Canada University of Cagliari, Italy
{parastou.tourani,bram.adams}@polymtl.ca
ABSTRACT
Software development is a collaborative activity in which de-velopers interact to create and maintain a complex software
system. Human collaboration inevitably evokes emotions
like joy or sadness, which can affect the collaboration either positively or negatively, yet not much is known about the individual emotions and their role for software development stakeholders. In this study, we analyze whether development artifacts like issue reports carry any emotional information about software development. This is a first step towards veri-fying the feasibility of an automatic tool for emotion mining in software development artifacts: if humans cannot deter-mine any emotion from a software artifact, neither can a tool. Analysis of the Apache Software Foundation issue tracking system shows that developers do express emotions (in partic-ular gratitude, joy and sadness). However, the more context is provided about an issue report, the more human raters start to doubt and nuance their interpretation of emotions. More investigation is needed before building a fully automatic emotion mining tool.
Categories and Subject Descriptors
D.2.9 [Management]: Programming teams; H.5.3 [Group
and Organization Interfaces]: Web-based interaction
General Terms
Human Factors, Measurement
Keywords
Emotion Mining, Issue Report, Empirical Software Engineer-ing
1.
INTRODUCTION
In July 2013, the Linux kernel mailing list was shaken up by an agitated discussion between Linus Torvalds and a senior developer [6]: “I am serious about this. Linus, you’re one of the
Permission to make digital or hard copies of all or part of this work for personal or classroom use is granted without fee provided that copies are not made or distributed for profit or commercial advantage and that copies bear this notice and the full citation on the first page. To copy otherwise, to republish, to post on servers or to redistribute to lists, requires prior specific permission and/or a fee.
MSR’14, May 31 - June 1, 2014, Hyderabad, India Copyright 2014 ACM 978-1-4503-2863-0/14/05 ...$15.00.
worst offenders when it comes to verbally abusing people and publicly tearing their emotions apart.” Other people joined her, noting “scolding people [...] is not likely to encourage people to want to become senior developers” and “Thanks for standing up for politeness/respect. If it works, I’ll start doing Linux kernel dev. It’s been too scary for years.” On the other hand, Linus defended himself, claiming “not telling people clearly enough that I don’t like their approach, they go on to re-architect something, and get really upset when I am then not willing to take their work.”
This example suggests that a rational view of software de-velopment only provides a partial picture of how stakeholders really behave: the developers may underperform if they do not feel safe and happy. Positive emotions like happiness help people to be more creative [15], which is essential for successful software design [7]. If not, fear, or absence of courage, could refrain developers from changing or refactoring their code [1]. These effects of emotions are similar to other domains, where people have found that feelings and emotions dictate to a large extent our actions and decisions [33]. For example, consumer opinions on retailer sites influence potential buyer decisions [31]. The mood of people, evaluated through tweets, correlates with changes in the activity of buying or selling in the stock market [5].
Since even the most talented developer could underperform and eventually leave the project just because she is unhappy with her environment or colleagues it is important to support managers and project leads in detecting emotions in their team. Mining emotions from discussion boards is relevant when face-to-face meetings are not feasible or efficient. For example, in distributed development (both open and closed source), projects have almost no personal interaction except for sporadic conference calls. In such environments, gauging emotions across geographical locations is essential for man-agers to become immediately aware of new problems and be able to take typical managerial action to defuse the situation. They can then organize conference calls focused on the rea-sons of a developer’s unhappiness (e.g., sexual harassment), or schedule a special meeting if developers suddenly became anxious (e.g., for issue due to an OS update).
Since awareness of emotions in a team currently is a manual activity, we want to use messages posted on a project’s public discussion boards (i.e., one of the major means of communica-tion) tominedeveloper emotions. In particular, as a first step towards building a tool for automatic emotion mining, we performed a pilot study (with the four authors) and a full user study (with 16 participants) to determine whether emotions can actually be detected from typical software maintenance artifacts like issue reports, and, if so, whether humans can
actually agree on the emotions identified and how much infor-mation (context) they need for that. Without such agreement, automated tools would not make sense to build. In particular, we analyzed a significant sample of 792 developer comments (400 in the pilot study, 392 in the full study) of the Apache projects using Parrott’s emotional framework [30] to answer the following research questions:
RQ1) Can human raters agree on the presence or absence of emotions in issue reports?
We found that raters agree the most on the absence of an emotion, followed by the presence of love(i.e., gratitude) and (less strongly)joyandsadness. Hav-ing more than two raters does not significantly improve agreement.
RQ2) Does context improve the agreement of human raters on the presence of emotions in issue reports?
We found that providing human raters with more con-text about an issue seems to cause doubt (i.e., nuances) instead of more confidence in the identified emotions. Having more than two raters makes ratings more ro-bust to this.
To our knowledge, this is the first feasibility study of emo-tion mining in development artifacts like issue reports. Based on our findings, issue comments have potential as data source for emotion mining, yet more work is needed to fully under-stand the role of context on the identification of emotions.
In the remainder of this paper, we first describe the back-ground notions for emotion mining (Section 2). Next, we describe the experimental setup (Section 3), followed by a discussion up front of mined developer emotions (Section 4). We then address the two research questions (Section 5) and discuss our findings (Section 6). After a discussion of the threats to validity (Section 7) and related work (Section 8), we finish with conclusions (Section 9).
2.
BACKGROUND
This section provides background about emotion mining, the Parrott emotional framework, and the development artifacts (i.e., issue reports) studied in this paper.
2.1
Emotion Mining
Emotion mining tries to identify the presence of human emotions likejoyorfearfrom text, voice and video artifacts produced by humans. As such, it is different from sentiment analysis, which instead evaluates a given emotion as being positive or negative [29]. The field of sentiment analysis as a whole is currently moving towards emotion mining, since this provides more detailed insight into the behavior of people [39]. Since these research areas affect the decision-making process of people [29], a diverse range of actors, from marketing departments and investors to politicians make use of their techniques.
In software engineering, emotion mining applied to text artifacts could be used to provide hints on factors responsi-ble forjoy and satisfaction amongst developers (e.g., new release), or fear and anger (e.g., deadline or a recurring bug). Moreover, it provides a different perspective to inter-pret productivity and job satisfaction. Since several studies show that it is possible to “contract” emotions from others
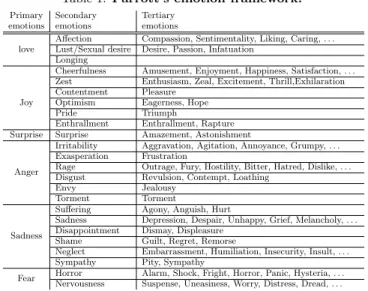
Table 1:Parrott’s emotion framework.
Primary Secondary Tertiary emotions emotions emotions
love
Affection Compassion, Sentimentality, Liking, Caring, . . . Lust/Sexual desire Desire, Passion, Infatuation
Longing
Joy
Cheerfulness Amusement, Enjoyment, Happiness, Satisfaction, . . . Zest Enthusiasm, Zeal, Excitement, Thrill,Exhilaration Contentment Pleasure
Optimism Eagerness, Hope Pride Triumph
Enthrallment Enthrallment, Rapture Surprise Surprise Amazement, Astonishment
Anger
Irritability Aggravation, Agitation, Annoyance, Grumpy, . . . Exasperation Frustration
Rage Outrage, Fury, Hostility, Bitter, Hatred, Dislike, . . . Disgust Revulsion, Contempt, Loathing
Envy Jealousy Torment Torment Sadness
Suffering Agony, Anguish, Hurt
Sadness Depression, Despair, Unhappy, Grief, Melancholy, . . . Disappointment Dismay, Displeasure
Shame Guilt, Regret, Remorse
Neglect Embarrassment, Humiliation, Insecurity, Insult, . . . Sympathy Pity, Sympathy
Fear Horror Alarm, Shock, Fright, Horror, Panic, Hysteria, . . . Nervousness Suspense, Uneasiness, Worry, Distress, Dread, . . .
through computer-mediated communication systems [18, 21], development artifacts like mailing lists or the discussion board of an issue tracking system could be a promising source for mining developer emotions during software evolution.
2.2
Parrott’s Framework
Emotion is a “psychological state that arises spontaneously rather than through conscious effort and is sometimes ac-companied by physiological changes” [22]. General types of emotions arejoy,sadness,anger,surprise,hateand fear. However, many other categories and sub-categories can be identified. Since there is not one standard emotion word hierarchy, many studies in the cognitive psychology do-main [36] have focused on research about emotions, resulting in various proposals for categorizing emotions [35, 32, 30].
One of the more recent classifications of emotions is Par-rott’s framework [30], which classifies human emotions into a tree structure with 3 levels, as is shown in Table 1. Each level refines the granularity of the previous level, making abstract emotions more concrete. For example, level-1 of this classifi-cation consists of six primary-emotions, i.e.,love,sadness, anger,joy,surpriseandfear.
The concise and intuitive nature of the primary emotions make Parrott’s classification easy to understand by different stakeholders. In particular, the classification is not just aimed at the people rating a particular artifact as describing a partic-ular emotion, but also appeals to people like team leads trying to benefit from the emotional classification to understand the emotions of their team members. In this paper, we only consider the six primary emotions, but in future work we plan to extend our results to secondary and tertiary emotions for the most popular primary emotions.
2.3
Issue Tracking System
The issue tracking system is a repository used by software companies to organize software maintenance and evolution. Such repositories, like Jira1, provide a shared environment where team members can submit and discuss issues (e.g., bugs and feature requests), ask for advice and share opinions useful for maintenance activities or design decisions. These
1
Table 2:Apache Software foundation statistics.
Projects Issues Comments Users Start Date End Date 117 81,523 271,416 20,537 10/2000 07/2013
discussions reveal how committers feel towards a bug, feature, project or even other members of the community.
An issue report is characterized by standard fields useful for its processing (e.g., priority, status etc.). In particular, the report contains a list of comments used by developers to discuss and share ideas about the issue resolution. These comments (see for example Figure 1) are the ones analyzed in our study.
3.
EXPERIMENTAL SETUP
In our experiment, we analyze emotions reported in issue reports extracted from open source systems. This section dis-cusses the data set used in our analysis, the general procedure used to rate issue report comments, and finally how pilot and full study where organized.
3.1
Dataset
We mined the issue repository of the Apache software foun-dation2, since such a type of repository contains a significant amount of information related to a project’s dynamics [20]. The mined issue reports belong to 117 open source projects, ranging from large, long-lived projects such as Tomcat3, and Lucene4, to smaller projects like RAT5. For the experiment, we use a random sample of the project’s comments, so the larger the project the higher the chance that we analyzed some of its comments. Given this wide range of projects, we believe that this data source provides a representative overview of open source issue reports.
We parsed Apache’s Jira-based repository in July 2013, fetching all the issue reports since the 19th of October 2000. For each issue report, we extracted the developers’ comments, as well as the standard issue report fields mentioned in Sec-tion 2.3. Table 2 reports the statistics for our dataset.
Since an issue comment can consist of multiple sentences, and an issue report of multiple issue comments, we decided to perform our analyses at the level of issue comments to avoid a too coarse granularity. Given the large number of issue comments, we sampled enough issue comments to obtain a confidence level of 95% and confidence interval of 5%. This means that a proportion ofX% in our sample of issue com-ments actually corresponds toX±5% in the population of issue comments. For this reason, we obtained samples of 392 or more comments (out of 271,416 comments).
Note that we only focus on publicly available communication data (in particular, issue reports). Even in an industry setting, similar publicly available data can be found to use as input for emotion mining, without privacy concerns.
3.2
Emotion Mining
In order to rate a particular issue comment as having a par-ticular emotion, each rater identified the emotions associated to each sentence of the comment. We use Parrott’s six primary emotions, i.e.,love,joy,surprise,anger,sadnessand fear, since we did not know the distribution of emotions 2 https://issues.apache.org/jira/secure/Dashboard.jspa 3 http://tomcat.apache.org/ 4 http://lucene.apache.org/ 5 http://creadur.apache.org/rat/
[...] I’m not so convinced that moving all the static methods out is useful (Fear). How is a bunch of static methods on a utility class easier than a bunch of static methods within the HtmlCalendarRenderer better? (Anger)
[...] the risk of introducing new bugs for no great benefit (Fear).
Specific feedback regarding this specific patch: (1) There is significant binary incompatibility (Neutral).
[...] Previously almost all these helper methods were private; this patch makes them all public [...] (Neutral)
Figure 1: Example of issue comments with identified emo-tions for each sentence.
Table 3: Interpretation of Cohen and Fleissκ values.
κvalue interpretation <0 poor 0–0.20 slight 0.21–0.40 fair 0.41–0.60 moderate 0.61–0.80 substantial 0.81–1.0 almost perfect
across comments beforehand. Future work could specialize emotions like sadness towards deeper levels. The rating process was based on (1) each rater’s personal interpretation of emotions, and (2) a common understanding of Parrott’s framework. For the latter, we first explained and illustrated such a framework (Section 2.2) to all participants.
Figure 1 shows an example comment belonging to issue 1235 of the Tomahawk project where a developer reveals his opinions about the risk of moving towards static methods (which he believes would be useless). To show his dislike, he uses wordings associated withangerandfear, interspersed with neutral phrases where the author expresses an objective evaluation of the patch. Although not shown, a sentence can express more than one emotion. Based on the sentences’ individual emotions, a rater would mark the entire issue
com-ment as containing anger and fear. We ignore Neutral
annotations, since those correspond to absence of emotions. Since we have no ground truth, each research question considers agreement on a particular comment’s emotions as a “correct” classification. Agreement boils down to a majority vote of two raters out of two or three or more raters out of four agreeing on the presence or absence of a particular emotion for a given issue comment. This is of course a threat to validity, but the only objective way to decide which emotions are “correct”, since retrospectively asking the author of a comment about a potentially identified emotion is bound to generate unreliable results.
To measure the degree of inter-rater agreement on identified emotions, we calculate either Cohen’sκvalue [10] (two raters) or Fleiss’κvalue [14] (more than two raters). Both values can be interpreted according to Table 3. In order to determine whether inter-rater agreement values differ statistically signif-icantly, we also provide the values’ corresponding confidence interval (withαvalue of 0.05). If this interval overlaps with another value’s interval, we cannot conclude that the two agreement values are significantly different. In addition to these statistical agreement values, we also provide the more basic percentage of cases for which raters agree on a particular emotion or set of emotions.
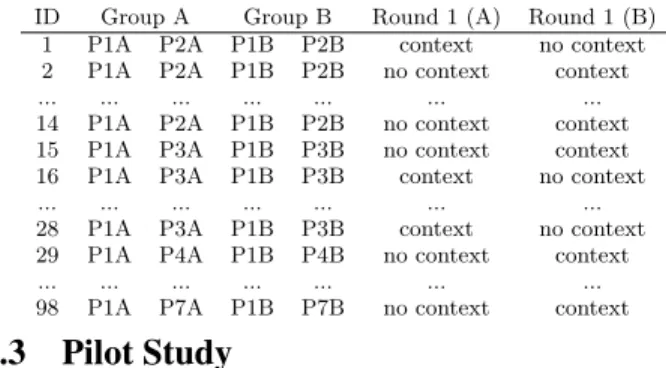
Table 4: Comments assigned to person 1 of Group A (P1A) and person 1 of Group B (P1B). Their assign-ments for round 2 switch presence/absence of con-text.
ID Group A Group B Round 1 (A) Round 1 (B) 1 P1A P2A P1B P2B context no context 2 P1A P2A P1B P2B no context context ... ... ... ... ... ... ... 14 P1A P2A P1B P2B no context context 15 P1A P3A P1B P3B no context context 16 P1A P3A P1B P3B context no context ... ... ... ... ... ... ... 28 P1A P3A P1B P3B context no context 29 P1A P4A P1B P4B no context context ... ... ... ... ... ... ... 98 P1A P7A P1B P7B no context context
3.3
Pilot Study
The pilot study is used in RQ1 to investigate (1) the type of emotions in issue reports and (2) the level of agreement that human raters can achieve on the identified emotions. We randomly selected 400 issue report comments from the Apache issue reports. Then, we arbitrarily assigned each comment to two authors of the paper, randomly making sure that authors are not paired up with the same person all the time (contrary to the full study, we did not enforce that everyone shares exactly the same number of comments with every other rater). Eventually, each author received a file containing 200 issue report comments. Each author then went through his or her list of comments to mark all Parrot’s emotions that he or she was able to identify.
3.4
Full Study
In addition to the pilot study, we also performed a larger (“full”) study to verify the consistency of the RQ1 results, as well as to investigate the influence of context on emotion rating in RQ2. A comment’s context in an issue report is the list of comments of that report that were submitted before that comment. We are interested in validating whether or not knowing the context of a comment makes rating the emotions in that comment easier. If it is, then one should always consider this context when rating emotions.
From the Apache issue reports we randomly selected 392 issue comments (confidence interval of 5%) that have at least one comment of context. Contrary to the pilot study, we only analyzed the closing comments of issue reports, since those have a higher chance of having context.
We then selected 4 Master’s students, 10 PhD students and 2 research associates from Polytechnique Montr´eal and University of Antwerp. We organized two groups A and B, both with the same number of master and PhD students. Table 4 illustrates how we assigned comments to group mem-bers. First of all, each group should rate each comment twice (both groups together rate each comment four times), while we also wanted to limit the bias caused by the wide variety in experience, nationalities and culture of participants. For these reasons, each group member rated 14 comments in common with each other group member.
Second, in order to compare both groups’ ratings, we mapped each member in group A to a member in group B with similar experience (for example, person 1 of group A (p1A) and person 1 of group B (p1B)). In order to compare the ratings between two groups, each couple like (p1A,p1B) received the same assignment (modulo random reordering).
Third, since we want to verify the influence of context on emotion rating, we divided the experiment in two rounds
where the participants rate each of the comments assigned to them twice: once without its context and once with. So, given a particular couple’s assignment, we randomly added context for some of the comments in one round, while we added context for the other comments in the second round, as shown in Table 4.
Fourth, to reduce the impact of seeing first a comment with or without context, we made it such that the assignment of p1A (after randomly adding context) for round 1 corresponds to the assignment of p1B in round 2, while the assignment of p1A in round 2 corresponds to the assignment of p1B in round 1. In each round, all participants rate 98 comments (and each group 392 comments).
Finally, to counter the learning effect and at the same time obfuscate the goal of the study, the two rounds where sepa-rated by a time gap of at least 6 days in between submitting the results of the first round and starting the second round.
Similar to the pilot study, in each round each participant received a file with comments. As a means of training, he or she received an explanation about the Parrot framework as well as examples of each emotion based on the results of the pilot study (Section 4). Then, the participants analyzed the list of comments to mark all Parrot emotions that they were able to identify. For comments with context, the participants rate only the emotions in the comment (not the other com-ments of the context). The dataset of all expericom-ments will be available by contacting the authors6.
4.
DEVELOPER EMOTIONS ON ISSUE
COMMENTS
This section presents the typical emotions that we identified in issue reports during the pilot case. We opted to discuss these emotions up front in order to provide a better understanding of the emotional content of issue reports. For each of the six primary Parrott emotions, we report the most representative text snippets as well as an explanation of why the snippet contains that emotion. Whenever appropriate, we also report the secondary (e.g.,shame) or tertiary (e.g.,guilt) emotion.
Love
1. Thanks for your input! You’re, like, awesome 2. Thanks very much! I appreciate your efforts 3. [I] would love any
Loveis generally presented in sentences that express gratitude, i.e., a developer exhibits that he “likes” the person (example 1), the person’s activity (example 2) or the software artifact delivered (e.g., patch). Lovecan be expressed also as a kind of desire(example 3). In issue comments,loveis oriented primarily towards co-workers.
Joy
1. I’m happy with the approach and the code looks good 2. great work you guys!
3. Hope this will help in identifying more usecases
Joy is normally associated to positive achievements, in
the form of satisfaction (example 1) or enthusiasm
(example 2). In the first case, the text reports keywords like “good” or “great”. In the second case, the phrase ends with
6
a “!”. A less common case of joyisoptimismexpressed by a positive outlook for a successful achievement (example 3). Joyis expressed towards software artifacts or co-workers. Surprise
1. I still question the default, which can lead to surprisingly huge memory use
2. I also documented an unexpected feature with the SlingServletResolver
3. Oops. It needs to be added to Makefile
Surpriseis expressed for unexpected, generally negative, behavior of the software (example 1 and 2). A second case is represented by mistakes introduced accidentally by a developer and discovered later on (example 3). We did not document any case wheresurprisereferred to co-workers.
Anger
1. I will come over to your work and slap you
2. WTF, a package refactoring and class renaming in a patch?
3. This is an - ugly - workaround
Angergenerally goes along with menaces (e.g., “slap” or “kill”), negative adjectives (e.g., “ugly”) or profanity (e.g., “WTF”). These emotions revealhostilityand bullying towards co-workers (example 1) ordisliketowards software artifacts (examples 2 and 3).
Sadness
1. Sorry for the delay Stephen.
2. Sorry of course printStackTrace() wont work
3. wish i had pay more attention in my english class .... now its pay back time .... :-(
4. Apache Harmony is no longer releasing. No need to fix this, as sad as it is.
Sadnessis generally expressed by developers that feelsguilty, i.e., they apologize for a delay (example 1) or for the unsatisfac-tory code produced (example 2). Sadnesscan be expressed also for reasons not dependent on the issue handled (example 3), or on the developer actions (example 4).
Fear
1. I’m worried about some subtle differences between char and Character
2. I’m most concerned with some of the timeouts 3. I suspect that remove won’t work either in this case. Fear is expressed by a developer in a state of worryor anxiety. This emotion is expressed explicitly using the keyword “worry” or its synonyms like “concern” (example 1 and 2). Another common case is to express a negative outlook with respect to a particular development choice (example 3). We observed thatfear, differently from other emotions, is limited to software artifacts only.
Issue comments contain emotional content of develop-ers. Some emotions can refer to software artifacts and co-workers (e.g., joy, anger and sadness), while others target only software artifacts (e.g., surprise andfear) or co-workers (e.g.,love).
Table 5:Percentage of comments in which raters agreed on presence or absence of all 6 emotions, as well as the number of those comments with at least one emotion present.
pilot round 1 round 2 study group A group B group A group B #common 165 215 193 127 207 %common 41.25±5 54.85±5 49.23±5 32.40±5 52.81±5 #common present 20 36 36 16 40 %common present 5.00±5 9.18±5 9.18±5 4.00±5 10.00±5
5.
EXPERIMENTAL RESULTS
For each research question, we first discuss its motivation, followed by the approach we used and our results.
RQ1. Can human raters agree on the presence or absence of emotions in issue reports?
Motivation. Emotion mining from software development artifacts like issue reports, emails or change logs is not trivial, since such artifacts consist of unstructured data [2, 3]. I.e., they are relatively short, written in an informal way with emoticons, and, contrary to regular text parsed in sentiment analysis, they typically contain technical content like stack traces or code snippets interleaved with regular text. Because of this, it could prove to be difficult to glance emotional content from software development artifacts, let alone agree between different human raters.
Approach. We use the comment ratings of the pilot study and full study to address this research question. As a first step, we measured the percentage of agreement on the presence and absence of emotions. As a second step, we used Cohen’sκto calculate agreement across all raters for each comment. For the full study, we measured the agreement (a) for each pair of (round, group), and (b) across both groups. In the latter case, we merge the corresponding ratings of(round 1, group A)with(round 2, group B), and of(round 1, group B)with (round 2, group A). Comparing cases (a) and (b) allows to evaluate whether agreement changes when having two, three or four raters for a comment.
Findings. Only in on average 46.11±5% of the com-ments, both raters had the same rating for all 6 emo-tions. Table 5 shows for each study the number and per-centage of comments for which both raters assigned to the same comment agreed on all 6 emotions. The highest number of such agreement occurred for group A in round 1, while the same group obtained the lowest agreement in round 2, statistically significantly lower than in the four other cases (except for the pilot study). Since (round 1, group A) and (round 2, group B) both considered the same comments (and context), that configuration of comments and context seems more easy for raters to agree on.
Furthermore, on average for 7.47±5% of the comments for which raters agreed on all 6 emotions, at least one emotion
Table 6:Percentage of agreement (absolute number in parentheses) and Cohenκvalues (with confidence intervals) for each emotion in RQ1 (pilot study).
%agreement %agreed %agreed lower Cohen upper (#) presence (#) absence (#) κ κ κ love 90.75±5 (363) 5.75±5 (23) 85.00±5 (340) 0.38 0.51 0.64 joy 69.75±5 (279) 6.50±5 (26) 63.25±5 (253) 0.11 0.19 0.27 surprise 96.75±5 (387) 0.00±5 (0) 96.75±5 (387) -0.02 -0.01 0.00 anger 90.75±5 (363) 0.50±5 (2) 90.25±5 (361) -0.07 0.06 0.19 sadness 80.75±5 (323) 3.50±5 (14) 77.25±5 (309) 0.06 0.18 0.29 fear 93.25±5 (373) 0.50±5 (2) 92.75±5 (371) -0.07 0.10 0.26
Table 7: Percentage of agreement (absolute number in parentheses) and Cohenκ values (with confidence intervals) for each emotion in RQ1 (full study).
(a) (round one, group A)
%agreement %agreed %agreed lower Cohen upper (#) presence (#) absence (#) κ κ κ love 89.03±5 (349) 7.91±5 (31) 81.12±5 (318) 0.40 0.53 0.65 joy 86.48±5 (339) 3.06±5 (12) 83.42±5 (327) 0.10 0.24 0.38 surprise 89.80±5 (352) 1.28±5 (5) 88.52±5 (347) -0.00 0.15 0.30 anger 90.82±5 (356) 1.28±5 (5) 89.54±5 (351) 0.00 0.17 0.33 sadness 93.62±5 (367) 2.04±5 (8) 91.58±5 (359) 0.16 0.36 0.55 fear 93.11±5 (365) 1.28±5 (5) 91.84±5 (360) 0.05 0.24 0.43
(b) (round one, group B)
%agreement %agreed %agreed lower Cohen upper (#) presence (#) absence (#) κ κ κ love 92.35±5 (362) 5.61±5 (22) 86.73±5 (340) 0.41 0.55 0.69 joy 82.40±5 (323) 3.83±5 (15) 78.57±5 (308) 0.07 0.20 0.33 surprise 89.54±5 (351) 0.77±5 (3) 88.78±5 (348) -0.06 0.07 0.21 anger 90.56±5 (355) 0.26±5 (1) 90.31±5 (354) -0.10 0.00 0.10 sadness 91.58±5 (359) 3.57±5 (14) 88.01±5 (345) 0.25 0.41 0.58 fear 87.76±5 (344) 1.02±5 (4) 86.73±5 (340) -0.05 0.08 0.21
(c) (round two, group A)
%agreement %agreed %agreed lower Cohen upper (#) presence (#) absence (#) κ κ κ love 85.71±5 (336) 6.38±5 (25) 79.34±5 (311) 0.27 0.40 0.52 joy 82.91±5 (325) 4.08±5 (16) 78.83±5 (309) 0.11 0.23 0.36 surprise 90.82±5 (356) 0.00±5 (0) 90.82±5 (356) -0.05 -0.03 -0.01 anger 92.86±5 (364) 0.77±5 (3) 92.09±5 (361) -0.04 0.14 0.32 sadness 93.88±5 (368) 1.79±5 (7) 92.09±5 (361) 0.14 0.34 0.54 fear 93.62±5 (367) 0.51±5 (2) 93.11±5 (365) -0.06 0.11 0.28
(d) (round two, group B)
%agreement %agreed %agreed lower Cohen upper (#) presence (#) absence (#) κ κ κ love 92.35±5 (362) 3.57±5 (14) 88.78±5 (348) 0.27 0.44 0.61 joy 82.40±5 (323) 5.61±5 (22) 76.79±5 (301) 0.16 0.29 0.41 surprise 89.29±5 (350) 0.77±5 (3) 88.52±5 (347) -0.06 0.07 0.21 anger 92.86±5 (364) 0.51±5 (2) 92.35±5 (362) -0.07 0.09 0.25 sadness 88.78±5 (348) 3.32±5 (13) 85.46±5 (335) 0.17 0.32 0.47 fear 91.58±5 (359) 1.02±5 (4) 90.56±5 (355) -0.01 0.15 0.32
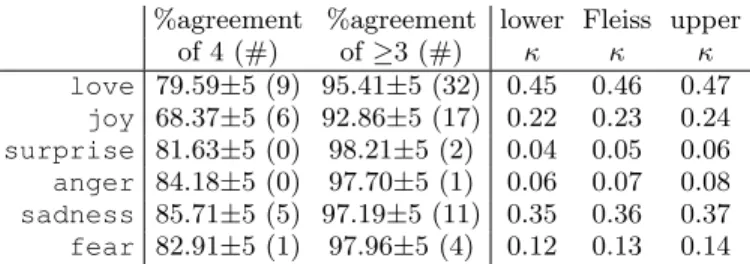
Table 8: Percentage of agreement for the full study between four (2nd column) and at least three (3rd column) raters, together with the Fleiss κ inter-rater agreement and confidence intervals (4th to 6th column). In parentheses the number of analyzed cases of a particular emotion in which raters agreed on the presence of the emotion.
(a) (round 1, group A) and (round 2, group B)
%agreement %agreement lower Fleiss upper
of 4 (#) of≥3 (#) κ κ κ love 82.91±5 (13) 94.39±5 (24) 0.48 0.49 0.50 joy 69.90±5 (5) 93.88±5 (19) 0.23 0.25 0.26 surprise 78.83±5 (0) 97.19±5 (2) 0.05 0.06 0.07 anger 85.20±5 (2) 96.94±5 (2) 0.15 0.16 0.17 sadness 84.18±5 (7) 96.17±5 (10) 0.34 0.35 0.36 fear 85.97±5 (1) 98.21±5 (7) 0.22 0.23 0.24
(b) (round 1, group B) and (round 2, group A)
%agreement %agreement lower Fleiss upper
of 4 (#) of≥3 (#) κ κ κ love 79.59±5 (9) 95.41±5 (32) 0.45 0.46 0.47 joy 68.37±5 (6) 92.86±5 (17) 0.22 0.23 0.24 surprise 81.63±5 (0) 98.21±5 (2) 0.04 0.05 0.06 anger 84.18±5 (0) 97.70±5 (1) 0.06 0.07 0.08 sadness 85.71±5 (5) 97.19±5 (11) 0.35 0.36 0.37 fear 82.91±5 (1) 97.96±5 (4) 0.12 0.13 0.14
was present. Typically, raters agreed on absence of emotions for dry comments like “committed” and “done”.
Only forlove, the raters achieved moderate agree-ment, whilejoyandsadnessobtained fair agreement.
Table 6 and Table 7 show the percentage and Cohenκ val-ues (with confidence interval) of agreement for each emotion individually, for the pilot and large study respectively. Love clearly obtains the highestκagreement, corresponding to a moderate value. Except for the pilot study,joyandsadness have a strong fair agreement. Fear,angerand (especially) surpriseonly obtained poor/slight agreement. These num-bers are more or less stable across the five cases, with some fluctuations. For example, group A did not have any agree-ment at all forsurprisein round 2, contrary to most of the other cases.
The percentage of agreement for joy in the pilot study was the lowest, with 30.25±5% of the comments containing disagreement. However, all other emotions and cases had less disagreement than 19.25±5% (sadnessin pilot study).
At most 7.91±5% (love) of the comments agreed on the presence of a particular emotion, whereas up to 96.75±5% (surprise) agreed on the absence of a particular emotion. Table 6 and Table 7 indeed show that most of the comments were rated as not having a particular emotion (an agreed presence of 0% means that there were no comments where an emotion was present). This is the reason why, despite the high percentage of general agreement, the correspondingκvalues are low. The emotions with the lowest κvalues (fear,angerandsurprise) sometimes have only 0, 1 or 2 agreed occurrences, while the most frequently agreed emotion (love) had up to 31 occurrences (group A, round 1).
Only for joy, three raters agree significantly more on an emotion than only two raters. Table 8 breaks these percentages down for each individual emotion, together with the Fleissκvalue of agreement across the four raters. Agreement between all four raters obtains lower percentage values than requiring at least three raters to agree. In fact, the Fleissκvalues for four-rater agreement are in the same ballpark as for the case of two raters (Table 6 and Table 7). However, the agreement between at least three raters overall is higher than in the case of two (or four) raters, but only in the case of joythere really is a significant improvement. Hence, having more than two raters does not seem to make a significant difference.
While some emotions obtain higher agreement than
others, onlylove,joyandsadnessobtained at least fair agreement. Although comments clearly contain emotions, raters agree the most on the absence of an emotion. Having more than two raters does not change the agreement significantly.
RQ2. Does context improve the agreement of human raters on the presence of emotions in issue reports?
Motivation. Rating a comment without its context can be compared to eavesdropping on a group conversation and only catching the last phrase of the conversation. It is likely that the interpretation of that phrase depends on the previous discussion (i.e., context) of the conversation. For example, the sentence “yeah, right” can have a different meaning (both sarcastically and otherwise) [38], when following a sentence
Table 10: How often raters changed their rating from the one in a row (comment without context) to the one in a column (comment with context). 0 means that a particular emotion was not selected, while 1 means that it was selected.
context love joy surprise anger sadness fear
0 1 0 1 0 1 0 1 0 1 0 1 A 0 650 28 658 46 711 28 719 29 722 32 730 21 1 29 77 30 50 32 13 21 15 13 17 21 12 B 0 701 18 644 36 712 28 730 23 691 32 712 25 1 16 49 32 72 21 23 14 17 23 38 22 25
Table 11: How often raters went from disagreement (d) to agreement (a) or vice versa when comparing the set of comments without context (rows) to the set of comments with context (columns), for groups A, B, and when combining both groups (at least three raters agreeing).
love joy surprise anger sadness fear
d a d a d a d a d a d a group A d 26 18 26 28 9 26 13 15 5 13 6 19 a 29 319 40 298 32 325 23 341 26 348 21 346 group B d 15 12 42 24 19 21 16 13 17 18 19 20 a 18 347 30 296 24 328 20 343 25 332 23 330 3-rater d 9 8 9 8 1 9 3 8 4 8 1 7 a 14 361 26 349 7 375 7 374 10 370 6 378
like “with java 8 we fix all problems” than when following “breaking backward compatibility is risky”. However, due to the technical and unstructured nature of software development artifacts, the impact of context might be different than in literary English documents. Here, we want to analyze the impact of context on agreement between raters.
Approach. This research question only considers the full study. Since each group considers 392 comments once without and once with context (they were randomly distributed across two rounds), here we merge the results of both rounds such that, for each group, we can compare the ratings without and with context. For this comparison, we calculate similar agree-ment percentage and Cohenκvalues as for RQ1. Furthermore, we measure how often raters made a different decision for a particular emotion when seeing context or not, and whether such different decisions led from agreement to disagreement, disagreement to agreement or did not have any net effect.
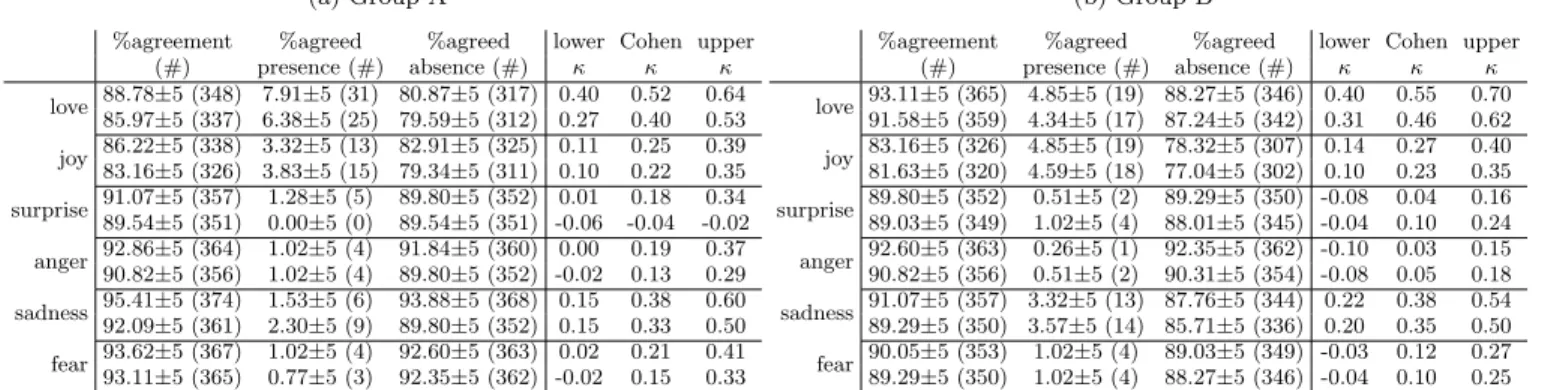
Findings. Adding context slightly reduces rater agreement, but not significantly. Table 9 compares, for each group, the agreement amongst the rating results of the comments without context (odd rows) and those with context (even rows). Except forsurprisein group A, theκ agree-ment is not significantly different (the confidence intervals still overlap) with or without context, even though the actual κvalues seem lower with context than without. Similarly, the percentages of agreement seem lower with context, but not in a significant way. Sometimes context finds more evidence of the presence of emotion than without context, while some-times the inverse situation holds. Similar to RQ1, both groups have similar results, except foranger, for which group B had a much lower agreement (since less occurrences were agreed upon).
Most of the raters pick the same answer without or with context, yet they tend to switch more from absence to presence of an emotion than the other way around. Table 10 shows for both groups how many raters picked a different answer for an emotion in the absence or
presence of context. Clearly, in most cases (between 90.3% to 95.7% of the time) raters did not change their rating, which suggests that (1) ratings for a particular comment are fairly stable, and (2) context does not add substantially new information for the interpretation of a particular comment.
At the same time, we can also see that if a rater changes his or her mind, he or she rather tends to mark a previously (i.e., without context) absent emotion as present, than the other way around (except forlove,surpriseandfearin group A). In the case of sadness the relative difference between both cases goes from 50% to more than 100%. This would suggest that although context does not play a major role in agreement, in cases when it does, raters become less sure and tend to mark an additional emotion as being present.
The change of mind due to context pushes more pairs of raters from agreement to disagreement than the other way around. Table 11 shows for each comment and emotion whether the raters’ change of mind has an impact on the agreement between the raters. Even though the vast majority of cases did not change agreement/disagreement, the results also show for all emotions and both groups that more raters went from agreement to disagreement when showing context (row “a”, column “d”), than the other way around (row “d”, column “a”). Again, context does not seem to have a major impact, but when it does, it causes more uncertainty (disagreement) than agreement.
This observation is less pronounced when using agreement between at least three raters, as shown in the bottom two rows of Table 11. Only forloveandjoy, there is still more agreement turning into disagreement than the inverse, but for the other four emotions, the usage of three or more raters makes the results more robust to fluctuations introduced by context. Hence, even though more raters do not significantly improve agreement (RQ1), they make ratings more robust.
Context does not play a significant role in the rating of emotions in issue comments, but when it does, it seems to cast more doubt than confidence, unless more raters are used.
6.
DISCUSSION
This section discusses our findings in more detail.
6.1
Impact of Context
At first sight, our findings for RQ2 seem counter-intuitive: while one would expect that the addition of context strength-ens agreement due to the availability of more information, we seem to observe quite the opposite, i.e., raters starting to doubt and changing their mind. Although more experiments are needed to confirm and understand this phenomenon, we briefly discuss a couple of hypotheses.
The worst case scenario would be that emotion mining is so subjective and nuanced that even for humans it is impossible to correctly determine the presence of a specific emotion in an issue report. However, we believe that the truth is more subtle. For example, in RQ2 we only rated the last comment of an issue report, and reports with context contain (by definition) the viewpoint of multiple commenters, for which it is not always clear how they relate to the last commenter’s viewpoint.
Consider a hypothetical example of the following three com-ments by three different commenters: “Class FooBar is a total
Table 9: Percentage of agreement and Cohenκvalues (with confidence intervals) for comments without and with context (RQ2). The percentages are relative to the 392 comments without and with context, respectively odd and even
rows.
(a) Group A
%agreement %agreed %agreed lower Cohen upper (#) presence (#) absence (#) κ κ κ love 88.78±5 (348) 7.91±5 (31) 80.87±5 (317) 0.40 0.52 0.64 85.97±5 (337) 6.38±5 (25) 79.59±5 (312) 0.27 0.40 0.53 joy 86.22±5 (338) 3.32±5 (13) 82.91±5 (325) 0.11 0.25 0.39 83.16±5 (326) 3.83±5 (15) 79.34±5 (311) 0.10 0.22 0.35 surprise 91.07±5 (357) 1.28±5 (5) 89.80±5 (352) 0.01 0.18 0.34 89.54±5 (351) 0.00±5 (0) 89.54±5 (351) -0.06 -0.04 -0.02 anger 92.86±5 (364) 1.02±5 (4) 91.84±5 (360) 0.00 0.19 0.37 90.82±5 (356) 1.02±5 (4) 89.80±5 (352) -0.02 0.13 0.29 sadness 95.41±5 (374) 1.53±5 (6) 93.88±5 (368) 0.15 0.38 0.60 92.09±5 (361) 2.30±5 (9) 89.80±5 (352) 0.15 0.33 0.50 fear 93.62±5 (367) 1.02±5 (4) 92.60±5 (363) 0.02 0.21 0.41 93.11±5 (365) 0.77±5 (3) 92.35±5 (362) -0.02 0.15 0.33 (b) Group B
%agreement %agreed %agreed lower Cohen upper (#) presence (#) absence (#) κ κ κ love 93.11±5 (365) 4.85±5 (19) 88.27±5 (346) 0.40 0.55 0.70 91.58±5 (359) 4.34±5 (17) 87.24±5 (342) 0.31 0.46 0.62 joy 83.16±5 (326) 4.85±5 (19) 78.32±5 (307) 0.14 0.27 0.40 81.63±5 (320) 4.59±5 (18) 77.04±5 (302) 0.10 0.23 0.35 surprise 89.80±5 (352) 0.51±5 (2) 89.29±5 (350) -0.08 0.04 0.16 89.03±5 (349) 1.02±5 (4) 88.01±5 (345) -0.04 0.10 0.24 anger 92.60±5 (363) 0.26±5 (1) 92.35±5 (362) -0.10 0.03 0.15 90.82±5 (356) 0.51±5 (2) 90.31±5 (354) -0.08 0.05 0.18 sadness 91.07±5 (357) 3.32±5 (13) 87.76±5 (344) 0.22 0.38 0.54 89.29±5 (350) 3.57±5 (14) 85.71±5 (336) 0.20 0.35 0.50 fear 90.05±5 (353) 1.02±5 (4) 89.03±5 (349) -0.03 0.12 0.27 89.29±5 (350) 1.02±5 (4) 88.27±5 (346) -0.04 0.10 0.25 waste of time, just nuke it!”, “We do have users relying on
its features, I’m afraid we should fix this bug” and “I share your view, working on it”. Although the first comment clearly containsangerand the second onesadness, the third one is quite ambiguous regarding which view is shared. Without context, the comment might be neutral, while with context
it might be neutral, anger, sadness or a combination.
As such, context does not necessarily filter the set of possi-ble emotions. On the contrary, it enriches the nuances on the emotions perceived by a rater and can lead to different interpretations.
Another hypothesis is that using a simple yes/no decision as rating is too large a simplification. Maybe one should provide multiple ratings, which would allow to model uncertainty in a rating.
6.2
Do Emotions Matter for Issue Reports?
Our premise was that, similar to other domains, emotions could have an impact on software development activities like bug fixing or development of new features. To get an initial impression of whether this claim contains a grain of truth, we performed a short analysis with data stemming from this study and from a smaller, preliminary one made internally. Here, we check whether reports with different emotions tend to be fixed faster, have more comments or have more people following (’watching’) the issue report.
Our analysis uses the three most frequent emotions (love, joyandsadness) on which raters agree. For the full study, we included emotions with at least three agreeing raters. This yields a total of 207 comments: 73 forlove, 62 forjoyand 72 for sadness (note that the same report can feature in multiple emotions). We then looked up the corresponding issue reports’ fix time, number of comments and number of watchers.
We check the null hypothesis that the reports for the three emotions either have the same average fix time, number of comments or number of watchers. For this reason, we per-formed (non-parametric) Kruskal-Wallis tests: if the null hypothesis was rejected (α value of 0.05), i.e., at least one emotion has a different average value for one of the three mea-sured attributes, we performed post hoc tests to determine the emotion with significantly different property values.
We found a significant difference for the number of com-ments, i.e., reports with a comment rated aslovetend to have a lower number of comments (median value of 5) than joy(median value of 7.5) orsadness(median value of 12). Similarly, the number of watchers of reports with a comment
rated aslovehas a median value of 0 whereas forsadness the median value is 1, i.e., less people monitor the former reports. Although not strictly significantly different, the Kruskal-Wallis test for the fixing time of reports obtained a low p-value of 0.057, with reports containing alovecomment taking a median number of 20 days to be resolved, compared to 53.5 forjoyand 68.5 forsadness.
Of course, more analysis is needed to fully investigate the link between emotions on software development, however our initial findings for number of comments, watchers and (to a lesser degree) fixing time suggest that there might indeed be a link.
7.
THREATS TO VALIDITY
Threats to internal validity concern confounding factors that can influence the obtained results. We assume a causal relationship between a developer’s emotions and what he or she writes in issue report comments, based on empirical evidence (in another domain) [29]. Moreover, since developer communication has as first goal information sharing, removing or disguising emotionsmaymake comments less meaningful and cause misunderstanding. Since the comments used in this study were collected over an extended period from developers not aware of being monitored, we are confident that the emotions we mined are genuine. This is also why we could not involve the authors of the comments in our study.
Threats to construct validity focus on how accurately the observations describe the phenomena of interest. Rating of emotions from textual issue report comments presents some difficulties due to ambiguity and subjectivity. To reduce these threats, the authors adopted Parrott’s framework as a reference for emotions. Finally, to avoid bias due to personal interpretation, in all experiments each commit was analyzed by at least two participants.
Threats to external validity correspond to the generalizabil-ity of our experimental results [8]. In this study, we manually analyze a sample of issue reports belonging to 117 open source projects. We chose the projects as a representative sample of the universe of open source software projects, with different development teams and satisfying different customers’ needs. Replications of this work on other open source systems and on commercial projects are needed to confirm our findings.
Threats to reliability validity correspond to the degree to which the same data would lead to the same results when repeated. This research is the first attempt to manually investigate emotions of developers from issue reports, hence no ground truth exists to compare our findings. We defined
the ground truth through agreement or disagreement of the raters. Since we involved 16 people with a wide variety in experience, nationalities and culture, other groups of raters might obtain agreement on different emotions and comments, possibly leading to different results. However, RQ2 showed that both groups of the full study and, to some extent, the pilot study obtained similar levels of agreement.
This study is focused on text written by developersfor de-velopers. To correctly depict the emotions embedded in such comments, it is necessary to understand the developers’ dic-tionary and slang. This assumption is supported by Elfenbein and Nalini’s work that provided evidence that for members of the same cultural and social group it is easier to recognize emotions than for people belonging to different groups [13]. Since all the participants of this study have a background in computer science, we are confident that participants may interpret the issue comments in the same manner as the de-velopers. We did not involve raters with different background (such as linguists or psychologists), because they may make
oversights or misinterpret the terms used by developers.
8.
RELATED WORK
Software development is a collaborative activity dependent on human interaction between developers towards the timely completion of a high quality software system [26]. Existing software development studies are not focused on the analysis of individual feelings, even though the morale and emotions of individuals can impact on the collaboration process and subsequently the success of a product [6, 1]. In this paper, emotions are the first-class object, we study how developers feel towards software artifacts and/or colleagues.
A project that is not appealing and unable to motivate developers to join, can be destined to fail [16]. For this reason, there has been a great deal of research on the reasons of developers joining and leaving a software project. Sim et. al have investigated dynamic strategies and conditions that characterize the joining process of software immigrants in a software development team [37]. Ducheneaut analysed the socialization process of new developers by visualizing the dynamic networks of both human and material resources incorporated in the email and code databases of open source software [11]. Herraiz et al. studied the duration and basic characteristics of the joining process for the developers and found two groups with clearly different joining patterns: new professionals and volunteer developers [23]. They could relate those patterns to the different behavior of volunteers and hired developers.
Rigby et al. analyzed the five big personality traits [27] of software developers in the Apache httpd server mailing list [34]. They analyzed the personality of four top developers, assessing the personality of two top developers who have left the project. Bazelli et al. replicated Rigby’s work on Stack Overflow to analyze the personality traits of different authors [4]. Although both studies deal with the behaviour of developers, they do not consider the emotions of project members and how these impact the motivation of project members.
Typically, emotion and sentiment mining studies focus on emotions that people convey through twitter, question and answer sites and product reviews [28, 24, 25]. Choudhury et al. [9] applied sentiment analysis on microblogging data of a large global Fortune 500 software corporation used to “disseminate product/service updates to the larger enterprise
community, such as details of new upcoming features, news about future team meetings, releases or trade shows”. They found that there is a potential for building systems that assess feelings of employees in an enterprise.
To improve emotional awareness in software development teams, Guzman et al. proposed a sentiment analysis approach for discussions in mailing lists and web-based software collab-oration tools like Confluence [19]. They used Latent Dirichlet Allocation to find the topics discussed in email and web dis-cussions of students in the context of a class project, then use lexical sentimental analysis to obtain an average emotion score for each of the topics. Dullemond et al. [12] extended a mi-croblogging tool with a happiness indicator, then deployed the tool across distributed teams in a company. Employees used the tool to share their message and emotions with their col-leagues in order to stay more connected and be aware of each other while collaborating. G´omez, using a grep-like approach, mined GitHub for extracting developers commit messages [17]. In his blog he collected several expressions ascribable as anger, joy and surprise, used during coding activity by developers.
Differently from sentiment analysis on high-level feature and meeting announcements, this paper performs emotion mining on technical artifacts, i.e., the comments of issue reports. Although emails and web discussions contain more technical details than the microblogging data sources, issue reports contain even more technical detail, since they are used by team members to ask for advice, express opinion and share opinions related to software maintenance and evolution. In contrast to sentiment analysis on a given emotion, we tried to identify and mine the different types of emotions.
9.
CONCLUSION
Emotions influence human behavior and interaction. Soft-ware development, as collaborative activity of developers, cannot be considered exempt from such influence. Emotion mining, applied to developer issue reports, can be useful to identify and monitor the mood of the development team, allowing project leaders to anticipate and resolve potential threats in their team as well as discover and promote factors that bring serenity and productivity in the community.
As a first step towards evaluating the feasibility of a tool for automatic emotion mining, we performed an exploratory study of developer emotions in almost 800 issue comments during software maintenance and evolution. Our study confirms that issue reports do express emotions towards design choices, maintenance activity or colleagues. Regarding agreement amongst human raters, we found that some emotions like love, joy and sadness are easier to agree on, but that additional context can cause doubt for raters, unless more raters are used.
Our findings suggest that forlove,joyandsadnessit makes sense and eventually might be feasible to automate emotion mining. However, some challenges, such as the impact of context, need to be studied more closely. Moreover, more systems and data sources need to be taken into account.
10.
ACKNOWLEDGMENTS
This work is sponsored by the Institute for the Promotion of Innovation through Science and Technology in Flanders through a project entitled Change-centric Quality Assurance (CHAQ) with number 120028. Regione Autonoma della Sardegna (RAS), Re-gional Law No. 7-2007, project CRP-17938, “LEAN 2.0”
11.
REFERENCES
[1] S. Ambler.”Agile modeling: effective practices for extreme programming and the unified process”. John Wiley & Sons, Inc. New York, 2002.
[2] A. Bacchelli, M. Lanza, and R. Robbes. Linking e-mails and source code artifacts. InProc. of the 32nd ACM/IEEE Intl. Conf. on Software Engineering - Volume 1 (ICSE), pages 375–384, 2010.
[3] A. Bacchelli, T. D. Sasso, M. D’Ambros, and M. Lanza. Content classification of development emails. InProc. of the 34th Intl. Conf. on Software Engineering (ICSE), pages 375–385, 2012.
[4] B. Bazelli, A. Hindle, and E. Stroulia. On the personality traits of stackoverflow users. InProceedings of the 2013 IEEE International Conference on Software Maintenance, ICSM ’13, pages 460–463, Washington, DC, USA, 2013. IEEE
Computer Society.
[5] J. Bollen, H. Mao, and X. Zeng. Twitter mood predicts the stock market.Journal of Computational Science, 2(1):1–8, 2011.
[6] J. Brodkin. Linus Torvalds defends his right to shame Linux kernel developers. http://www.webcitation.org/6O2zErgzE, July 2013.
[7] F. P. Brooks, Jr. No Silver Bullet Essence and Accidents of Software Engineering.Computer, 20(4):10–19, Apr. 1987. [8] D. T. Campbell and J. C. Stanley.Experimental and
quasi-experimental designs for generalized causal inference. Houghton Mifflin, 1963.
[9] M. D. Choudhury and S. Counts. Understanding affect in the workplace via social media. InProc. of the intl. conf. on Computer Supported Cooperative Work (CSCW), pages 303–316, 2013.
[10] J. Cohen. A coefficient of agreement for nominal scales. Educational and psychological measurement, 20(1):37–46, 1960.
[11] N. Ducheneaut. Socialization in an open source software community: A socio-technical analysis.Computer Supported Cooperative Work (CSCW), 14(4):323–368, 2005.
[12] K. Dullemond, B. v. Gameren, M.-A. Storey, and A. v. Deursen. Fixing the ’out of sight out of mind’; problem: one year of mood-based microblogging in a distributed software team. InProc. of the 10th Working Conf. on Mining Software Repositories (MSR), pages 267–276, 2013. [13] H. A. Elfenbein and N. Ambady. On the universality and
cultural specificity of emotion recognition: a meta-analysis. Psychological bulletin, 128(2):203, 2002.
[14] J. L. Fleiss. Measuring nominal scale agreement among many raters.Psychological bulletin, 76(5):378, 1971.
[15] B. L. Fredrickson. The role of positive emotions in positive psychology: The broaden-and-build theory of positive emotions.American psychologist, 56(3):218, 2001. [16] R. A. Ghosh and V. V. Prakash. The orbiten free software
survey.First Monday, 5(7), 2000.
[17] R. G´omez. Exploring Expressions of Emotions in GitHub Commit Messages. http://www.webcitation.org/6N9nD4IQN, May 2012.
[18] J. Guillory, J. Spiegel, M. Drislane, B. Weiss, W. Donner, and J. Hancock. Upset now?: emotion contagion in distributed groups. InProc. of the SIGCHI Conf. on Human Factors in Computing Systems (CHI), pages 745–748, 2011.
[19] E. Guzman and B. Bruegge. Towards emotional awareness in software development teams. InProc. of the 2013 9th Joint Meeting on Foundations of Software Engineering
(ESEC/FSE), pages 671–674, 2013.
[20] A. Guzzi, A. Bacchelli, M. Lanza, M. Pinzger, and A. van Deursen. Communication in open source software
development mailing lists. InThe 10th Working Conference on Mining Software Repositories, pages 277–286, 2013. [21] J. T. Hancock, K. Gee, K. Ciaccio, and J. M.-H. Lin. I’m sad
you’re sad: emotional contagion in CMC. InProc. of the 2008 ACM conf. on Computer Supported Cooperative Work (CSCW), pages 295–298, 2008.
[22] A. Heritage Dictionary.The American Heritage science dictionary. http://dictionary.reference.com/browse/, 2005. [23] I. Herraiz, G. Robles, J. J. Amor, T. Romera, and J. M.
Gonz´alez Barahona. The processes of joining in global distributed software projects. InProc. of the 2006 intl. workshop on Global software development for the practitioner (GSD), pages 27–33, 2006.
[24] O. Kucuktunc, B. B. Cambazoglu, I. Weber, and H. Ferhatosmanoglu. A large-scale sentiment analysis for Yahoo! answers. InProceedings of the fifth ACM international conference on Web search and data mining, pages 633–642. ACM, 2012.
[25] Y. Lu, P. Tsaparas, A. Ntoulas, and L. Polanyi. Exploiting social context for review quality prediction. InProc. of the 19th intl. conf. on World Wide Web (WWW), pages 691–700, 2010.
[26] I. Mistr`ık, J. Grundy, A. Hoek, and J. Whitehead, editors. Collaborative Software Engineering. Springer, 2010. [27] D. J. Ozer and S. P. Reise. Personality assessment.Annual
review of psychology, 45(1):357–388, 1994.
[28] A. Pak and P. Paroubek. Twitter as a Corpus for Sentiment Analysis and Opinion Mining. InLREC, 2010.
[29] B. Pang and L. Lee. Opinion Mining and Sentiment Analysis. Foundations and Trends in Information Retrieval,
2(1-2):1–135, Jan. 2008.
[30] W. Parrott.Emotions in Social Psychology. Psychology Press, 2001.
[31] C. Piller. Everyone is a critic in cyberspace.Los Angeles Times, 3(12):A1, 1999.
[32] R. Plutchik. The Nature of Emotions Human emotions have deep evolutionary roots, a fact that may explain their complexity and provide tools for clinical practice.American Scientist, 89(4):344–350, 2001.
[33] R. Plutchik and H. Van Praag. The measurement of suicidality, aggressivity and impulsivity.Progress in Neuro-Psychopharmacology and Biological Psychiatry, 13:S23–S34, 1989.
[34] P. C. Rigby and A. E. Hassan. What Can OSS Mailing Lists Tell Us? A Preliminary Psychometric Text Analysis of the Apache Developer Mailing List. InProc. of the 4th Intl. Workshop on Mining Software Repositories (MSR), pages 23–, 2007.
[35] M. D. Robinson. Personality as Performance Categorization Tendencies and Their Correlates.Current Directions in Psychological Science, 13(3):127–129, 2004.
[36] S. N. Shivhare and S. Khethawat. Emotion detection from text.Computer Science, Engineering and Applications, 2012. [37] S. Sim and R. Holt. The ramp-up problem in software
projects: a case study of how software immigrants naturalize. InProc. of the Intl. Conf. on Software Engineering (ICSE), pages 361–370, 1998.
[38] J. Tepperman, D. Traum, and S. S. Narayanan. Yeah right”: Sarcasm recognition for spoken dialogue systems. InProc. of InterSpeech, pages 1838–1841, Sept. 2006.
[39] J. Zaino. Analysis Goes From Sentiment to Emotion. http://www.webcitation.org/6N9n9NJEF.