Implementation of Anomaly Based Network Intrusion Detection
by Using Q-learning Technique
Richa Srivastava
PG Research Scholar Department of Computer Science and Engineering, LNCT, Bhopal (M.P.),India E-mail - [email protected]
Vineet Richhariya
Prof. & Head Department of Computer Science and Engineering, LNCT, Bhopal (M.P.) E-mail - [email protected]
Abstract
Network Intrusion detection System (NIDS) is an intrusion detection system that tries to discover malicious activity such as service attacks, port scans or even attempts to break into computers by monitoring network traffic. Data mining techniques make it possible to search large amounts of data for characteristic rules and patterns. If applied to network monitoring data recorded on a host or in a network, they can be used to detect intrusions, attacks or anomalies. We proposed “machine learning method”, cascading Principal Component Analysis (PCA) and the Q-learning methods to classifying anomalous and normal activities in a computer network. This paper investigates the use of PCA to reduce high dimensional data and to improve the predictive performance. On the reduced data, representing a density region of normal or anomaly instances, Q-learning strategies are applied for the creation of agents that can adapt to unknown, complex environments. We attempted to create an agent that would learn to explore an environment and collect the malicious within it. We obtained interesting results where agents were able to re-adapt their learning quickly to the new traffic and network information as compare to the other machine learning method such as supervised learning and unsupervised learning.
Keywords: Intrusion, Anomaly Detection, Data Mining, KDD Cup’99, PCA, Q-learning.
1. INTRODUCTION
Network intrusion detection systems (NIDS) are most efficient way of shielding against network-based attacks intended at computer systems [1, 2]. Basically, there are two main types of intrusion detection systems: signature-based (SBS) and anomaly-based (ABS). SBS systems [3, 4] rely on pattern recognition techniques. ABS systems [5] build a statistical model describing the normal network traffic, and any abnormal action that deviates from the model is recognized. A network anomaly by malicious or unauthorized users can cause harsh interruption to networks. Hence the development of a robust and reliable network anomaly detection system (ADS) is progressively more important. Anomaly Detection System (ADS) monitors the performance of a system and flag major deviations commencing the normal activity as an anomaly.
In this work our goal is to make anomaly-based intrusion feasible. In our experiment, we used KDD Cup 1999 dataset [6]. The dataset consisted of 494,021 records single connection vectors each of which contains 41 features. Each record is labeled as either normal or attack type, with precisely one specific attack type. The space and time complexities of largely classifiers used are exponential function of their input vector size [7]. Additionally, the demand for the number of samples for the training the classifier develops exponentially with the dimension of the feature space. This limitation is called the ‘curse of dimensionality’. Pragmatic studies specify that feature reduction technique is capable of reducing the dimension of dataset. In this work we aim to sort out superfluous information and extensively reduce number of computer resources, both memory and CPU time vital to detect attacks. This paper propose Principal Component Analysis (PCA) as a reduction tool and Q-learning algorithm as a Q-learning tool for the developed system, firstly we reduce the features and then apply the learning algorithm. Q-learning will help to identify the unknown attacks [8].
1.1 Plan of the Paper
This paper planned as follows, in the second section we give an introduction to Intrusion Detection Systems (IDS), section three gives the introduction Data Mining classifications methods for Anomaly Detection Systems (ADS), section four give information about techniques of feature reduction, section fifth explains the proposed algorithm, section sixth shows the experimental result, finally in section seventh conclusion and future work are shown.
2. INTRUSION DETECTION SYSTEM
Intrusion Detection System (IDS) is software that automates the intrusion detection process and detects possible intrusions. IDS serve three essential security functions: they monitor, detect, and respond to unauthorized activity by insiders and outsider intrusion. An ID is a system for detecting intrusions and reporting them
precisely to the suitable authority. 2.1 Types of IDS
These are the following types of Intrusion detection systems: 2.1.1. Network Intrusion Detection System
NIDS examines the behavior of a specified environment and make a decision whether these activities are malicious (intrusive) or legitimate (normal) based on system integrity, confidentiality and the availability of information resources [9]. NIDS does this by reading all incoming packets and endeavoring to find number of TCP connection demands to a huge number of different ports is detected, one could suppose that there is someone conducting a port scans of some or all of the computers in the network. It typically tries to detect incoming shell codes in the same approach that a usual intrusion detection system does. Frequently examining precious information about an ongoing intrusion can be learned from outgoing or local traffic and also work with other systems as well. For example renew some firewalls blacklist with the IP address of computers used by intruder.
2.1.2. Host-based Intrusion Detection System
Host-based intrusion detection system (HIDS) examines elements of the dynamic behavior and the status of computer system, vigorously inspects the network packets [9]. A HIDS also check that proper regions of memory have not been modified, for example- the system-call table comes to mind for Linux and various v table structures in Microsoft Windows. For each object in question typically remember its attributes and create a checksum of some kind (an MD5, SHA1) for the substances, this information gets stored in a protected database for later comparison (checksum-database). At installation time- whenever any of the observed objects change legitimately- a HIDS have to initialize its checksum database by examining the proper objects. Persons in charge of computer security need to control this process tightly in order to prevent intruders making unauthorized changes to the database.
2.2 IDS Techniques
There are two complementary trends in intrusion detection [10]: 2.2.1. Misuse detection
The search for evidence of attacks based on the knowledge collected from known attacks and is referred to as misuse detection or detection by appearance.
2.2.2. Anomaly detection
The search for deviations from the model of unusual behavior based on the observations of a system during a normal state and is referred to as anomaly detection or detection by behavior.
3. DATA MINING TECHNIQUES FOR ADS
Data mining is extracting facts, secret information in large degrees of raw data. Typical tasks of data mining are detecting fraud and abuse in insurance and finance, predict peak load of a network. Hence Data Mining-based anomaly detection is become widespread in essence. Intrusion is an action that tries to destroy that secrecy, integrality and usability of network information, which is unlicensed and exceed authority. Data mining can be supervised, unsupervised supervised or reinforcement learning is to use the available data to build one particular variable of interest in terms of rest of data.
Anomaly detection refers to discovering patterns in a given dataset that deviates from an established normal behavior. The patterns as a result detected are called anomalies and turn to critical and actionable information in several application domains. Anomalies are also known as outlier, surprise deviation etc. Anomaly detection algorithms require a set of normal data to train the model and implicitly consider that anomalies can be treated as patterns not observed before. An outlier may be defined as a data point which is very different from the rest of the data, based on some measure; we use several detection methods in order to see how efficiently these methods may deal with the problem of anomaly detection. The statistics community has studied the concept of outliers widely. In these techniques, the data points are modeled using a stochastic distribution and points are verified to be outliers depending upon their relationship with this model. On the other hand with increasing dimensionality, it becomes gradually more difficult and inaccurate to estimate the multidimensional distributions of the data points.
Profile based methods: This method is similar to rule based method but in this profile of normal behavior is built for different types of network traffics, users, and all devices and deviance from these profiles means intrusion.
Statistical based methods: Statistical methods observe the user/network behavior by measuring explicit variables statistics over time [11].
Distance based methods: These methods try to conquer restraints of statistical outlierdetection approach when the data are difficult to estimate in themultidimensional distributions [12].
State transition: In this approach IDSs try to indentify intrusion by using a finite state machine that deduced from network. IDS states communicate to dissimilar states of the network and an event make transfer in this finite state machine. An activity identifies intrusion if state transitions in the FSM of network reflect to continuation state.
Model based methods: Other approaches based on deviation normal and abnormal behavior is modeling them but without creating several profile for them .In model based methods, researchers effort to model the normal and/or abnormal behaviors and divergence from this modelmeans intrusion.
Signature based: Matching available signatures in its database with collecteddata from activities for identifying intrusions.
Neural Network Based: This Neural Network model solved normal attack patterns and the type of the attack. When given data was presented to the model.
4. FEATURE REDUCTION TECHNIQUES
In machine learning and statistics, dimension or feature reduction is the process of reducing the number of random variables under consideration, and can be divided into feature selection and feature extraction. Feature reductions concern with the mapping of the multidimensional space into lower space dimensions [13]. Feature extraction includes features construction, sparse representations, space dimensionality reduction, and feature selection all these techniques are used as pre-processing to machine learning and statistics tasks of prediction, including pattern recognition. Though such problems have been tackled by researchers, there has been recently a renewed interest in feature extraction. The reduced feature space truly contributes to classification that cuts pre-processing costs and minimizes the effects of the ‘peaking phenomenon’ in classification [14], thus improving the overall performance of IDS. The frequently used dimensionality reduction techniques consist of supervised approaches such as Linear Discriminant Analysis (LDA), Random projection, unsupervised ones such as Principal Component Analysis (PCA), and added spectral and manifold learning methods. One inadequacy of the supervised methods is that attribute that describe examples of infrequent classes tend to be easily removed as a result of dimensionality reduction making use of the class distribution.
5. PROPOSED ALGORITHM
A NIDS monitor and analyze network traffics, and use multiple sensors for detecting intrusions from internal and external networks. NIDS explores the information assembled by the sensors, and returns a synthesis of the input of the sensors to system administrator or intrusion prevention system. System administrator carries out the instructions organized by the intrusion detection system. In our proposed anomaly based NIDS, two algorithms namely principal component analysis (PCA) and Q-learning are used shown in figure 1. In this approach, firstly dataset dimensions are reduced by the principal component analysis and finally the anomaly is detected from the reduced dataset by Q-learning method. As q-learning is based on off-policy control hence, it gives an optimized result as an output.
Principal Component Analysis is used for dimension reduction and Q-learning is used as a classifier of reduced data. The description of PCA and Q-learning are given below.
5.1 Principal Component Analysis (PCA)
In our network intrusion detection system we have used PCA for dataset reduction. For testing the NIDS system we have used KDDCup99 dataset [15]. Initially in KDDCup99 dataset there is 41 attributes. When we apply the PCA on KDDCup99 dataset, it reduces 41 attributes into 26 attributes. PCA is an unsupervised feature selection based on multivariate statistics and its basic scheme is to search for a projection that represents the data in a best possible way in a least-square sense to provide dimensionality reduction. PCA is a useful statistical technique manly in fields such as face recognition and image compression, and is a common technique for finding patterns in high dimensional data. The intact focus of statistics is based on around the idea that you have this big set of data, and you want to analyze that set terms of the relationships between the individual points in that set [16]. PCA is way of identifying patterns in data, and expressing the data in such a way as to emphasize their similarities and differences [17][18].
PCA Algorithm
Suppose , , … are N×1 vectors. Step 1: Calculate mean = ∑ Step 2: Subtract the mean = −
Step 3: From the matrix = [ , ,…… ] (N *M matrix), then compute covariance:
= ∑ =
(Sample covariance matrix, N*N, characterizes the scatter of the data) Step 4: Compute the Eigen values
: > > ... Step 5: Compute the eigenvectors : , , ,…….
As C is symmetric , , ,……. structure a basis, (i.e., any vector x or actually (x− ), can be written as a linear combination of the eigenvectors):
(x− ) = + +… = ∑
Step 6: Keep only the terms corresponding to the K largest Eigen values: (dimensionality reduction step) (x− ) = ∑
What is the criterion to choose principal components?
- To choose K, use the following criterion ∑∑ = Threshold (e.g. 0.47 or 0.95)
5.2 Q-learning Technique
One of the most important advances in reinforcement learning was the growth of an off-policy Temporal Difference (TD) control algorithm known as Q-learning. It can be used to discover an optimal action-selection mapping, known as policy (π), for finite Markov Decision Process (MDP) [19]. It learns an action-value function that finally gives the expected value of taking a given action in a given state and following the optimal policy through agents subsequently. A history of an agent is a sequence of <state – action – reward>. When such an action-value function is learned, the optimal policy can be created by simply selecting the action with the highest value in each state. Q-learning is able to evaluate the expected utility of the available actions without requiring a model of the environment. It can handle problems with stochastic transitions and rewards, without requiring any alterations. Q-learning is an off-policy scheme that can be run on top of any approach wandering in the MDP. It uses the information studied to approximate the optimal function, from which one can construct the optimal policy. Q-learning does converge to the optimal Q function, under very mild conditions and for proofs are present for this [20].
Optimal result depends on three factors i.e. initial condition (s0, a0), discount factor (0≤γ≤1) and learning rate
(0<α≤1). Mathematically, it can be shown as:
!" (#!, $!) = &1 − (!&#!, $!)) × ! &#!, $!) + (!&#!, $!) × +,!" +γ max0
α
! &#!" , $)
12222222322222224567896: ;75<6 =
Where,
&1 − (!&#!, $!)) : inverse learning rate ! &#!, $!) : old value (state, action)
(!&#, $) : learning rate
,!" : Reward γ : discount factor
max0 α
! &#!" , $) : estimate of optimal future value
Proposed Algorithm:
Algorithm Anomaly Intrusion Detection Input: Classified training dataset S, and the set of attributes.
Load dataset
Input/Define Threshold Range [0-1] FOR every training data
IF current value of > is nearest to neighbor ?@=> B &>C#D) // feature id
Or
?@<= &1 − ()>$D$#FD + ( > ELSE
Generate new feature id. END IF
END FOR
The above step works as a feature reduction for the input dataset.
Now when intrusion is available in the dataset /population then apply discrete state for it. FOR Attribute (all) && Tuple (all)
Attr (ε attribute, a finite state) //for a-learning state AND a (ε Attr , a finite state)
B&G) = ∑K!!LM HI G&$DDG, $DDGHI)JK!!L,K!!LM HI &$DDG_OFP) //reward
END FOR
Now, to check the probability of a action, that where the action should be attached (i.e. choose the next attribute).
JQ!!L $& DDG_OFP) && JQ!!L$&GFP$G>)
//after taking action in old attribute, lead to attr_new WHILE features do not reach to EOF
FOR each predetermined ?@ FIND { SDCTO = U& DDG) JV= JQ!!LV & SDCTO) } END FOR
Now Reward will be updated as, i=1
, = G + DDG G" + DDG G" + ⋯ … … … + DDG G " Finding best Optimization Policy,
FOR each pair of $&$DDG, $SDCTO) FOR all DDG&XD$DF#)
FOR all SDCTO
Y$D$#FD&$DDG, $SDCTO) = ∑ , JK!!L$SDCTO&,) + DD_OFP Z& DDG_OFP) JK!!L$SDCTO&$DDGHI) Z&$DDG) ≔ \$ ] B SDCTOY$D$#FD&$DDG, $SDCTO)
END FOR END FOR END FOR
Remove some features have worst optimal policy.
Now count the selected pairs of feature of the dataset/population.
Now assign the identification id of each feature of the new dataset/new population. END WHILE LOOP
6. EXPERIMENT AND RESULTS
Test Data: The training set employed for this analysis is the “10% KDD” (kddcup_data_gz file) dataset and converted into excel form or in matrix form. It consists of 41 feature attributes out of which 3 are symbolic and 38 are numeric. Hence each connection is given by 41 features set. There are 65536 sample of connection described in 41 dimensions, from which 39298 are normal and 26238 are attacks. The 42nd field can be a label
generalized as Normal, DoS, Probing, U2R, and R2L. The training data is made up of 22 different attacks. The known attack types are those present in the training dataset while the novel attacks are those attacks which are present in the test datasets but not available in the training datasets. Generally, there are four categories of attacks. They are :
DoS (denial-of-service), for example, ping- of death, syn flood, etc. Probe, surveillance and probing, for example, port-scan, ping-sweep, etc.
R2L, unauthorized access from a remote machine, for example, is guessing password.
U2R, unauthorized access to local super user rights by a local unprivileged user, for example, various buffer overflow attacks.
Training data: 10% of training data is selected randomly from the 10% of kddcup’99 dataset. Training data contains half the no. of normal data and half of the abnormal data, i.e. 3600 samples for each.
Performance Evaluation and Results
We are emphasizing on the following performance measures which are considered to evaluate the efficiency of the Proposed IDS technique:
The true positive rate (TPR) is the proportion of examples which were classified as class x, among all examples which truly have class x, i.e. how much part of class were captured. It is equivalent to detection rate or sensitivity. In case of information recovery, it is called as Recall.
The false positive rate (FPR) , which is also known as false alarm rate is the proportion of examples which were classified as class x, but belong to a different class, among all examples which are not of class x.
Precision is another information retrieval term, which is often paired with recall. It is defined as the proportion of examples which truly have class x among all those which were classified as class x.
F-value combines the TPR and precision into a single value function after obtaining their harmonic mean. Building time is the time taken by the classifier to build the model in seconds.
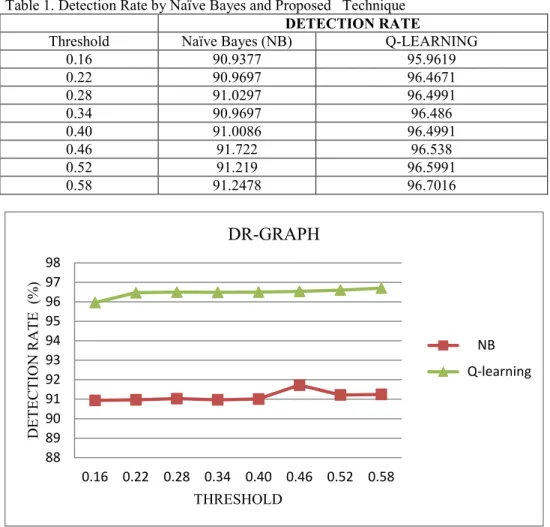
While experimenting on different threshold values in the proposed IDS technique, we got the results of the parameters as following:
Table 1. Detection Rate by Naïve Bayes and Proposed Technique
DETECTION RATE
Threshold Naïve Bayes (NB) Q-LEARNING
0.16 90.9377 95.9619 0.22 90.9697 96.4671 0.28 91.0297 96.4991 0.34 90.9697 96.486 0.40 91.0086 96.4991 0.46 91.722 96.538 0.52 91.219 96.5991 0.58 91.2478 96.7016
Figure 2. Comparison of Detection Rate of Naïve Bayes and Proposed Technique
Now, taking maximum absolute error as our experimental parameter, we get a better output as compared with the
88 89 90 91 92 93 94 95 96 97 98 0.16 0.22 0.28 0.34 0.40 0.46 0.52 0.58 D E T E C T IO N R A T E (% ) THRESHOLD
DR-GRAPH
NB Q-learningexisting Naïve Bayes method. It is given as below
Table 2. Maximum Absolute Error (MAE) by Naïve Bayes and Proposed Technique
MAXIMUM ABSOLUTE ERROR
Threshold Naïve Bayes (NB) Q-LEARNING
0.16 3.12226 2.249562 0.22 3.154306 2.598009 0.28 3.214294 2.620109 0.34 3.154306 2.611017 0.4 3.193135 2.620109 0.46 3.356732 2.646888 0.52 3.403621 2.66148 0.58 3.43243 2.759713
Figure3. Comparison of Maximum absolute error of Naïve Bayes and Proposed Technique
7. CONCLUSION AND FUTURE WORK
In this paper a general unsupervised (PCA) and reinforcement learning (Q-learning) methods have been used for classifying anomaly instance in large and complex network datasets. An explanation mechanism to explain the normal or anomalies results was explained. The precise approaches of the anomaly based detection systems learning are characterized. Based on cascading two machine learning techniques i) Principal Component Analysis and, ii) the Q-learning, we developed an anomaly based network intrusion detection technique. Firstly Principal Component Analysis (PCA) is used to reduce the features of KDDCup99. Then we have applied the learning algorithm, Q-learning to identify the novel and complex attacks decision space into classification regions; there by improving the system classification performance.Our future direction is to employ dataset as a tuple to this anomaly based network intrusion detection technique to increase the different measuring parameters
References
[1] Hazem M. El-Bakry, Nikos MastorakisA, “Real-Time Intrusion Detection Algorithm for Network Security,WSEAS Transactions on communications, Issue 12, Volume 7, December 2008.
[2] Debar.H, Dacier.M and Wespi.A, “A Revised Taxonomy of Intrusion-Detection Systems” Annales des Telecommunications 55(7–8) (2000) 361–378.
[3] Roesch.M, “Snort - Lightweight Intrusion Detection for Networks” 13th USENIX Conference on System Administration, USENIX Association (1999) 229–238.
[4] Sourcefire: Snort Network Intrusion Detection System web site (1999) URL http://www.snort.org.
[5] Wang. K and Stolfo.S.J, “Anomalous Payload-Based Network Intrusion Detection” 7th Symposium on Recent Advances in Intrusion Detection, Volume 3224 of LNCS., Springer-Verlag (2004) 203–222
[6] KDDcup99, Dataset: kdd.ics.uci.edu/databases/kddcup99/kddcup99.htm
0 0.5 1 1.5 2 2.5 3 3.5 4 0.16 0.22 0.28 0.34 0.4 0.46 0.52 0.58 M A E (s ) THRESHOLD MAE-GRAPH NB Q-LEARNING
[7] R.O.Duda,P.E.Hart, and D.G.Stork, Pattern Classification, vol. 1. New York: Wiley, 2002 [8] Watkins,C. Learning from Delayed Rewards, Thesis, University of Cambridge, England 1989.
[9]. A. Macgregor, M.Hall, P.Lorier and J.Bruskill, “Flow clustering using machine learning techniques”, In PAM 2004, Antibes-Juan-Les-Pins, France, LNCS. pp. 205-214, 2004.
[10] S. Kumar, Classification and Detection of ComputerIntrusions, Ph.D. Thesis, Purdue University. [11] White paper, Intrusion Detection: A Survey,ch.2, DAAD19-01, NSF, 2002
[12] K. Scarfone, P. Mell, Feb. 2007. Guide to Intrusion Detection and Prevention Systems (IDPS), NIST Special Publication, 800-94.
[13] Gopi K. Kuchimanchi,Vir V. Phoha, Kiran S.Balagani, Shekhar R.Gaddam, Dimension Reduction Using Feature Extraction Methods for Real-time Misuse Detection Systems, Proceedings of the IEEE on Information, 2004.
[14] Anil K. Jain,Robert P.W. Duin, and Jianchang Mao,“Statistical Pattern Recognition” IEEE transactions on pattern analysis and machine intelligence, VOL. 22, NO. 1,January 2000.
[15]. KDD Cup 1999 Data: http://kdd.ics.uci.edu/databases/ kddcup99/
[16] Lindsay I Smith A tutorial on Principal Components Analysis February 26,2002.
[17] S. Gong et al., Dynamic Vision: From Images to Face Recognition, Imperial College Press, 2001 (pp. 168-173 and Appendix C: Mathematical Details.
[18] Shilpa Lakhina et. al. Feature Reduction using Principal Component Analysis for Effective Anomaly–Based Intrusion Detection on NSL-KDD, International Journal of Engineering Science and Technology Vol. 2(6), 2010, 1790-1799.
[19] Arturo Lev Servin , Multi-Agent Reinforcement Learning for Intrusion Detection ,Department of Computer Science United Kingdom June 2009
[20] Bertsekas and Tsitsiklis, 1996, Tsitsiklis, 1994, Watkins and Dyan, 1992, Littman and Szepesv´ari, 1996, Jaakkola et al., 1994, Borkar and Meyn, 2000.