Volume II: Technology
Overview, Detailed Analyses,
and Appendices
The Delaware Valley Regional Planning Commission is dedicated to uniting the region’s elected officials, planning professionals, and the public with a common vision of making a great region even greater. Shaping the way we live, work, and play, DVRPC builds consensus on improving transportation, promoting smart growth, protecting the environment, and enhancing the economy. We serve a diverse region of nine counties: Bucks, Chester, Delaware, Montgomery, and Philadelphia in Pennsylvania; and Burlington, Camden, Gloucester, and Mercer in New Jersey. DVRPC is the federally designated Metropolitan Planning Organization for the Greater Philadelphia Region — leading the way to a better future.
The symbol in our logo is adapted from the official DVRPC seal and is designed as a stylized image of the Delaware Valley. The outer ring symbolizes the region as a whole while the diagonal bar signifies the
Delaware River. The two adjoining crescents represent the Commonwealth of Pennsylvania and the State of New Jersey.
DVRPC is funded by a variety of funding sources including federal grants from the U.S. Department of Transportation’s Federal Highway
Administration (FHWA) and Federal Transit Administration (FTA), the Pennsylvania and New Jersey departments of transportation, as well as by DVRPC’s state and local member governments. The authors, however, are solely responsible for the findings and conclusions herein, which may not represent the official views or policies of the funding agencies.
DVRPC fully complies with Title VI of the Civil Rights Act of 1964 and related statutes and regulations in all programs and activities. DVRPC’s website (www.dvrpc.org) may be translated into multiple languages. Publications and other public documents can be made available in alternative languages and formats, if requested. For more information, please call (215) 238-2871.
Acknowledgements
This material is based upon work supported by the U.S. Department of Energy (DOE) under Award Number DE-EE0005587. This award was one of a number of Clean Cities’ Community Readiness and Planning for Plug-In Electric Vehicles (EVs) and Charging Infrastructure grants provided by DOE.
ICF International assisted DVRPC with the preparation of this plan under contract with DVRPC. Disclaimer
This report was prepared as an account of work sponsored by an agency of the United States Government. Neither the United States Government nor any agency thereof, nor any of their employees, makes any
warranty, express or implied, or assumes any legal liability or responsibility for the accuracy, completeness, or usefulness of any information, apparatus, product, or process disclosed, or represents that its use would not infringe privately owned rights. Reference herein to any specific commercial product, process, or service by trade name, trademark, manufacturer, or otherwise does not necessarily constitute or imply its endorsement, recommendation, or favoring by the United States Government or any agency thereof. The views and opinions of authors expressed herein do not necessarily state or reflect those of the United States Government or any agency thereof.
Ready to Roll! Southeastern Pennsylvania’s Regional Electric Vehicle Action Plan is presented in two volumes, and is accompanied by an online information clearinghouse. Volume I,
available for download at no charge via www.dvrpc.org, includes the regional readiness plan, comprised of:
Projections for EV deployment by individuals and fleets;
Projections for residential, workplace, private access, and public access EVSE deployment;
Projected opportunities for EVSE integration with the smart grid;
Estimates for potential costs associated with EVs and EVSE, as well as funding opportunities to offset these costs;
Barriers to EV and EVSE deployment in the region and recommendations to overcome these barriers; and
An overview of stakeholders and partners involved in the preparation of the readiness plan, including a discussion of the roles and responsibilities of each stakeholder. Volume II (this volume) provides an in-depth overview of electric vehicle technology, detailed analysis of projected electric vehicle sales and usage in southeastern Pennsylvania, as well as further discussion of the policies and recommendations covered in Volume I.
Table of Contents
1 Electric Vehicle (EV) and Infrastructure Overview ... 1
1.1
EV Characteristics ... 3
1.2
Review of EV Architecture ... 3
1.3
Battery Technology and Cost Review ... 4
1.4
Overview of EV Ownership Costs ... 6
1.5
Vehicle Technology and Regulatory Trends in the Near, Mid, and Long Term ... 8
2 Charging Technology Overview ... 21
2.1
EVSE Types ... 22
2.2
EV Charging Times ... 23
2.3
Strategies and Technologies to Accommodate Increasing Electricity Demand Due to EV Charging ... 24
3 EV Consumer Overview ... 29
3.1
EV Consumer Demographics ... 29
4 EV Market Segment Overview... 33
4.1
Personal Vehicles ... 33
4.2
Commercial Fleets ... 34
4.3
Government Fleets ... 34
4.4
Local Fleet Survey ... 35
4.5
Detailed Findings... 36
5 EV and EVSE Deployment in Southeastern Pennsylvania ... 39
5.1
Current EV Availability in Southeastern Pennsylvania ... 39
5.2
Current EV Deployment in Southeastern Pennsylvania ... 41
5.3
Estimated EV Demand in Southeastern Pennsylvania ... 44
5.4
2012-2015 Projections of EV Deployment in Southeastern Pennsylvania ... 61
5.5
EV Ownership Costs in Southeastern Pennsylvania ... 64
5.6
Incentives and Initiatives to Promote EV Deployment in Southeastern Pennsylvania . 68
6 EVSE Installation Considerations and Processes ... 71
6.1
EVSE Installation Process... 71
6.2
Economics of EVSE Acquisition, Installation, and Operation ... 74
7
Regulatory Framework to Facilitate EVSE Deployment ... 79
7.1
Building and Electrical Codes... 79
7.2
Zoning Codes ... 83
7.3
Permitting and Inspection Processes ... 86
7.4
Parking Rules ... 97
7.5
Signage Standards ... 99
7.6
Procurement Policies ... 103
8
Education, Outreach, and Marketing Plan for Southeastern Pennsylvania ... 107
8.1
Examples of E&O for Consumers ... 107
8.2
Examples of E&O for Other Stakeholders ... 110
8.3
Plan to Develop an EV Training Program ... 113
8.4
Plan for Developing an EV Education, Outreach, and Marketing Campaign ... 118
9 Best Practices for Incentives & Programs to Enhance Demand for EVs and EVSE .. 123
9.2
Best Practices for Incentives and Programs ... 128
9.3
Current Federal, State, Local, and Private Incentives in Southeastern Pennsylvania ... 131
10
Utility Policies and Plans to Accommodate EVs ... 135
10.1
Pennsylvania Electricity Market and PECO ... 137
10.2
PECO’s Involvement in EV Deployment in Southeastern Pennsylvania ... 138
10.3
Research on Grid Impacts from EV Deployment ... 139
10.4
Plans to Minimize Grid Impacts from EV Deployment ... 147
10.5
Summary of Potential Grid Impacts and Plans to Accommodate EVs in Southeastern Pennsylvania ... 158
Glossary of Terms, Abbreviations, and Acronyms ... 159
Bibliography ... 167
General Online Resources ... 167
Key Documents ... 168
Appendix A. EV Cost Model - Universal Inputs ... A-1 Appendix B. EV Cost Model: Maintenance Cost Assumptions (For Vehicle Lifetime) .. B-1 Appendix C. EV Cost Model: EV and ICE Equivalent Models ... C-1 Appendix D. “Garage-Free” Electric Vehicle Summit 2012: Meeting Proceedings ... D-1 Appendix E. Philadelphia June 2012 Draft Residential Permitting Process Overview . E-1 Appendix F. Philadelphia June 2012 Draft Commercial Permitting Process Overview F-1 Appendix G. Raleigh Residential EVSE Installation Process ... G-1 Appendix H. Regulation Governing the Establishment of EV Parking Spaces Pursuant to Section 12-1131 of The Philadelphia Code ... H-1 Appendix I. Example State and Municipal Regulations ... I-1 Appendix J.
Summary of NEC Adoption by State ... J-1
Appendix K.
Sample EV Incentives & Programs ... K-1
Appendix L.
Utility EVSE Guidance Documents ... L-1
List of Figures Figure 1. Simplified Explanation of Different Drivetrain Configurations ... 4
Figure 2. LDV CAFE Targets for MYs 2012-2025 ... 9
Figure 4. Areas With the Highest Potential for EV Ownership in Southeastern
Pennsylvania ... 55
Figure 5. Projected EV Distribution in Southeastern Pennsylvania ... 56
Figure 6. Projected Percentage of Vehicles that are EVs, 2020 ... 57
Figure 7. Percentage of Vehicles Parked at Work, for Specified Time Intervals ... 59
Figure 8. Areas with Highest Potential for Public and Workplace Charging ... 60
Figure 9. Projected PHEV and AEV Sales ... 64
Figure 10. PECO EV Checklist ... 71
Figure 11. City of Houston Residential EVSE Installation Process Flow Chart... 94
Figure 12. D9-11b (Alternate) Interim Approved Symbol ... 100
Figure 13. Advance Directional Arrow Signs as Designated in MUTCD ... 101
Figure 14. EV Parking Stall with D9-11b (Alternate) Symbol on Pavement ... 101
Figure 15. ECOtality “No Parking” sign (left), Combined “No Parking” and MUTCD 9D-11b (Alternate) Sign ... 102
Figure 16. Michigan Model Regulatory Signage ... 103
Figure 17. Model Regulatory Signage from PSRC ... 103
Figure 18. Projected EVs by PECO Major Index Grid Areas ... 141
Figure 19. PECO Summer Peak Load Profile ... 144
Figure 20. Peak Day Load for the Oak Park Circuit ... 144
Figure 21. Additional Hourly Demand at Highland Park Substation Transformer ... 145
Figure 22. Highland Park Circuit Service Transformers Experiencing Overload... 146
Figure 23. ECOtality Data: Electricity Demand due to EV Charging in Philadelphia ... 149
Figure 24. Summer Peak Load Profile for California ... 149
Figure 25. ECOtality Data: 2012 Quarter 4 Weekday Residential Charging Demand in San Diego and Nashville ... 150
List of Tables Table 1. Comparison of EV and Comparable Conventional Vehicle MSRP ... 6
Table 2. Comparison of EV and Comparable Conventional Vehicle Cost Per Mile ... 7
Table 3. Estimates of Fuel Economy Improvements by Select Conventional Technologies ... 10
Table 4. Estimated Increased Costs for a Midsize Sedan with V6 Engine in 2009 ... 11
Table 5. Vehicle Multiplier Credits for Model Year 2012-2021 ... 14
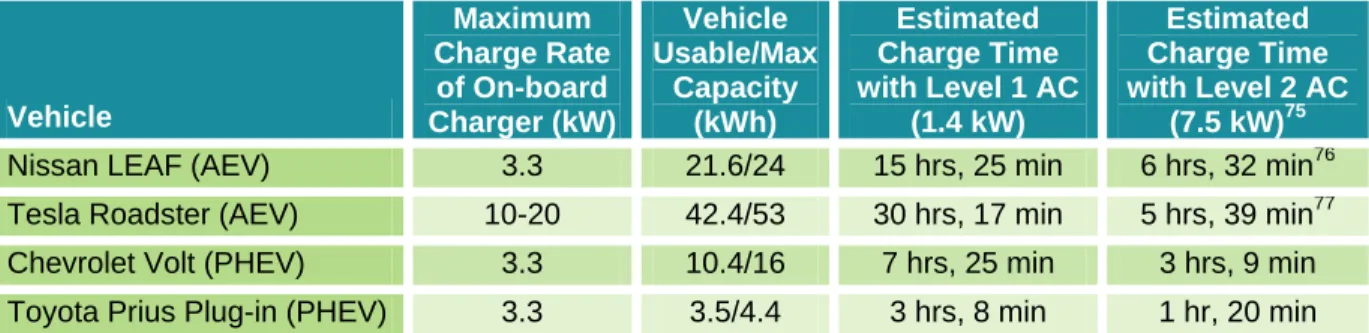
Table 7. Estimated Charging Times by EV Model ... 24
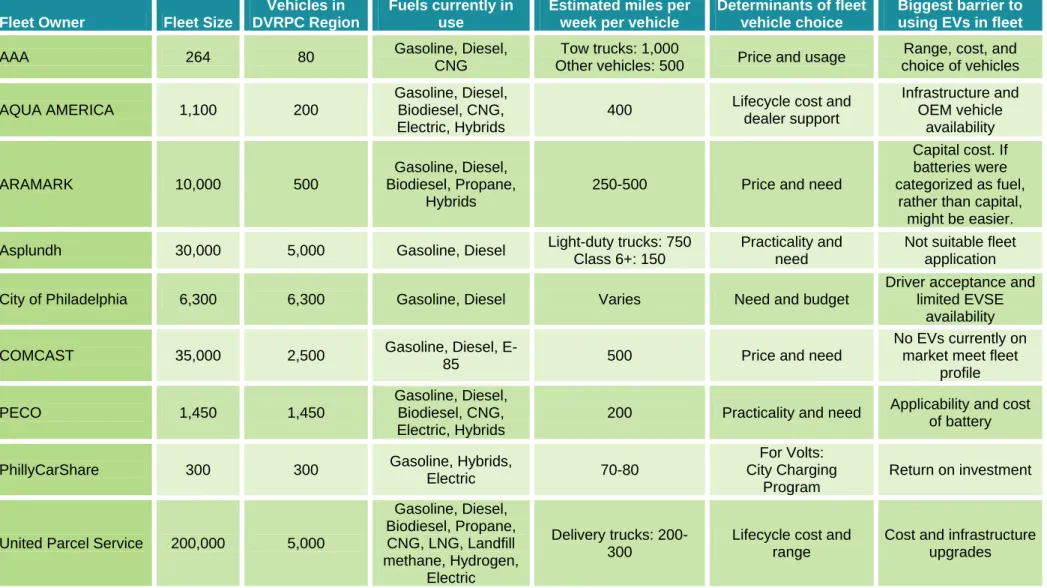
Table 8. Overview of DVRPC Fleet Survey Participant Profiles and EV Concerns/Considerations ... 37
Table 9. Prospectus of Current and Future EVs Available in Southeastern Pennsylvania ... 40
Table 10. Southeastern Pennsylvania Dealerships Selling and Servicing EVs ... 41
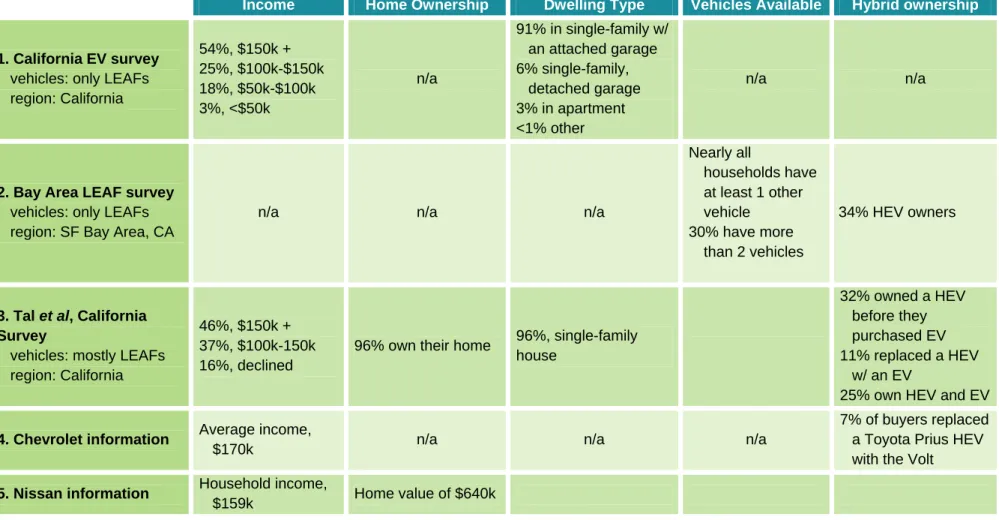
Table 11. Early EV Adopter Survey Statistics ... 46
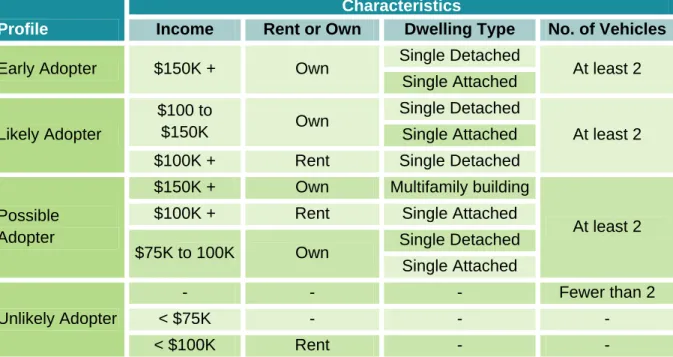
Table 12. Early, Likely, Possible, and Unlikely EV Adopter Characteristics ... 48
Table 13. Early, Likely, Possible, and Unlikely Adopters in Southeastern Pennsylvania based on DVRPC Travel Survey ... 49
Table 14. Vehicle Circuit Lengths in Miles Derived from DVRPC Travel Survey ... 50
Table 15. Income Groupings Assessed in EV Demand Analysis ... 52
Table 16. Data Elements for PennDOT Data on Passenger Vehicles Registered in Southeastern Pennsylvania ... 52
Table 17. HEV Ownership Groups Considered in EV Demand Analysis ... 53
Table 18. Summary of Notable EV Market Share and Sales Forecasts ... 62
Table 19. Comparison of CAR Forecast and Actual EV Sales ... 63
Table 20. Challenges to installation of EVSE at MUDs ... 72
Table 21. Estimated Costs for Single-Family Home Level 2 EVSE ... 74
Table 22. Estimated costs for MUD and Workplace EVSE Installations ... 76
Table 23. Installation Options for ADA Accessible EVSE from Ready, Set, Charge California! ... 97
Table 24. Recommended Roles and Responsibilities of Stakeholders Engaged in Stakeholder Education and Outreach ... 113
Table 25. Recommended Training Content by Audience ... 114
Table 26. Training Costs by Audience ... 117
Table 27. Utility Pilot Programs with Special EV Rates and/or EVSE Incentives ... 136
Table 28. Results from Existing EV Grid Impact Studies ... 143
Table 29. Summary of Time-variant Utility Rate Structures ... 151
1 Electric Vehicle (EV) and Infrastructure
Overview
Electric vehicles (EVs) support three domestic goals: greenhouse gas (GHG) emissions
reduction, energy security and independence, and economic development. With regard to GHG emissions reduction, EVs are considered zero- to low-emission vehicles because they produce low levels of tailpipe emissions (if any) per mile, as compared to a conventional vehicle powered by an internal combustion engine (ICE). One analysis indicates that many but not all regions of the United States would experience decreased pollution as a result of EV deployment.
Specifically, 61 percent of the U.S. population would experience decreased ozone levels as a result of a “medium” EV deployment of 50 percent of new car sales by 2035.1
The life-cycle emissions reduction associated with an EV as compared to a conventional vehicle depends on the sources of electricity used to charge the battery. EVs using electricity produced from renewable energy sources (e.g., hydroelectric, wind, and solar) provide greater emissions reductions than EVs using electricity produced from fossil fuels. Southeastern Pennsylvania is ranked among the best regions in the country for EV deployment because of the relatively clean mix of resources used to generate electricity use in the region.2
With regard to energy security, most U.S. electricity is produced from a mix of domestic coal, nuclear energy, natural gas, and renewable resources, all of which can be sourced
domestically. Because EVs can operate solely on electric power, they can help reduce U.S. reliance on imported petroleum, thus increasing energy security.
With regard to economic development, EVs present many opportunities to contribute to job growth in the United States. Advanced lithium-ion batteries, the primary battery type used in EVs, provide an opportunity for the country to revitalize its manufacturing base. While the United States commanded only two percent of the global advanced battery industry in 2008, a
Deutsche Bank study shows that the nation is responsible for upwards of 16 percent of the world’s lithium-ion battery manufacturing capacity and is projected to contain 40 percent of global capacity by 2015.3 One report predicts that this battery manufacturing and other EV-related industrial developments may result in a net employment gain of 130,000 to 350,000 jobs in the United States by 2030.4 A study of EV deployment in California determined that light-duty vehicle (LDV) electrification could contribute up to 100,000 additional jobs in the state by 2030,
1
Charles Zhu, “Plug-in Electric Vehicle Market Overview,” accessed June 2013, http://www.c2es.org/docUploads/pev-market-size.pdf.
2
Don Anair and Amine Mahmassani, “State of Charge: Electric Vehicles’ Global Warming Emissions and Fuel-Cost Savings across the United States,” Union of Concerned Scientists, accessed June 2013,
http://www.ucsusa.org/assets/documents/clean_vehicles/electric-car-global-warming-emissions-report.pdf, 19-20.
3
DOE, “The Recovery Act: Transforming America’s Transportation Sector – Batteries and Electric Vehicles,” accessed June 2013, http://www.whitehouse.gov/files/documents/Battery-and-Electric-Vehicle-Report-FINAL.pdf.
4
Thomas Becker, “UC Berkeley Study Finds Separate Battery Ownership Accelerates Mass-Market Adoption of Electric Cars,” accessed June 2013, http://www.prweb.com/releases/UCBerkeley/Electricvehiclestudy/prweb2628184.htm.
assuming EV deployment is accelerated to 45 percent of the new LDV fleet by 2030.5
Additionally, a New York State Energy Research and Development Authority (NYSERDA) study assessed the economic impacts associated with large-scale EV deployment in New York State. Under a scenario in which EVs achieve approximately 40 percent of new car sales by 2025, NYSERDA estimated that New York would benefit by $4.45 to $10.75 billion per year and experience net job creation between 19,800 and 59,800.6
Deploying EVs and electric vehicle supply equipment (EVSE) in southeastern Pennsylvania will require stakeholder involvement. Federal, state, and local decision-makers are well positioned to establish a regulatory environment conducive for EV and EVSE deployment. Utilities and regulatory authorities, such as public utility commissions (PUCs), are necessary to distribute electricity to EV owners, EVSE owners and operators, and other energy suppliers. Property owners can install both public and private charging infrastructure. EV and EVSE manufacturers, retailers, distributors, and installers are necessary to ensure that the technology is available, affordable, deployed, and maintained. Finally, education and advocacy groups, such as Clean Cities coalitions, have the informational resources and connections to educate fleet managers and the general public about the technology so more people are aware of its benefits.
The Delaware Regional Valley Planning Commission (DVRPC) led a year-long effort with stakeholders to create Ready to Roll!. DVRPC established close partnerships with a variety of stakeholders, including the City of Philadelphia’s Mayor’s Office of Sustainability, PECO Energy Company (PECO), and Greater Philadelphia Clean Cities (GPCC), as well as other
stakeholders that were engaged through the DVRPC EV Advisory Group. As discussed in Volume I, the City of Philadelphia’s Mayor’s Office of Sustainability provided DVRPC with data to aid the planning process and coordinate with decision-makers in various city agencies, such as the Streets Department and Office of Fleet Management, and identified opportunities to streamline the permitting process for EVSE installation. PECO has created partnership programs with federal, state, and local governments and organizations to advance early
adoption of EVSE and EVs in its southeastern Pennsylvania service territory. PECO served as a liaison between DVRPC, its partners, and the Pennsylvania Public Utility Commission (PA PUC) to provide valuable data throughout the project. GPCC has played an active role in EV
deployment in the region and received two Electric Vehicle Infrastructure Grants from the Pennsylvania Department of Environmental Protection (PA DEP). GPCC recruited additional partners and stakeholders, performed outreach to fleets, and assisted in data collection for the project. DVRPC and ICF International (ICF) conducted in-depth telephone interviews with representatives of original equipment manufacturers (OEMs) Nissan, General Motors (GM), Ford, and Tesla Motors.
5
David Roland-Holst, “Plug-in Electric Vehicle Deployment in California: An Economic Assessment,” accessed June 2013, http://are.berkeley.edu/~dwrh/CERES_Web/Docs/ETC_PEV_RH_Final120920.pdf.
6 NYSERDA and EPRI, “Transportation Electrification in New York State,”, accessed June 2013,
http://www.nyserda.ny.gov/en/Publications/Research-and-Development/~/media/Files/Publications/Research/Transportation/epri-phev.ashx
The subsequent sections address key technical characteristics of EVs; review EV owner
characteristics and behaviors in early adopter regions; summarize existing EV market research; provide ordinance, development, and enforcement guidance; and evaluate utility tariff
structures.
1.1 EV
Characteristics
Electricity is used as transportation fuel in three types of vehicles:
Hybrid electric vehicles (HEVs), which use both an ICE and an electric motor for propulsion. A current example is the Toyota Prius.
All-electric vehicles (AEVs), which only use an electric motor for propulsion and have a battery that charges solely by plugging into an external source (e.g., the electrical grid). A current example is the Nissan LEAF.
Plug-in hybrid electric vehicles (PHEVs), which use both an ICE and an electric motor with a battery that recharges by plugging into an external source. A PHEV operates as an AEV until the battery has been discharged, at which time the vehicle continues to operate as an HEV. A current example is the Toyota Prius Plug-in.
Extended-range electric vehicles (EREV), which are a subset of PHEVs. Like PHEVs, EREVs use both an ICE and an electric motor with a battery that recharges by plugging into an external source. However, once the battery of an EREV has been discharged, the vehicle’s ICE powers an electric generator to add ‘extended-range’ driving. A current example is the Chevrolet Volt. It is also considered by some industry observers to be a marketing term for this subset of PHEVs.
This report uses the term EV to refer to vehicles that use electricity from an external source– PHEVs, AEVs, and EREVs.
Until very recently, EVs were limited to niche market sales, demonstration programs, aftermarket conversions, or legacy vehicles from deployment in the 1990s. In the past few years, however, the number of commercially available EV models has increased. For instance, both the Nissan LEAF and the Chevrolet Volt have been available since early 2011, and Ford, Mitsubishi, Tesla, and Toyota have introduced additional new EV models as of early 2013.7
1.2 Review of EV Architecture
While both PHEVs and AEVs use an electric motor for propulsion, the two vehicle types have different architectures. Most PHEVs provide an all-electric driving range of 10 to 40 miles per charge (meaning that they can travel 10 to 40 miles using only battery power). As mentioned above, when the battery’s charge falls to a predetermined level, the system switches to the ICE. PHEVs have lower battery costs than AEVs because of the smaller battery, but this is offset by the expense of outfitting a vehicle with two powertrains (electric and internal combustion).
7
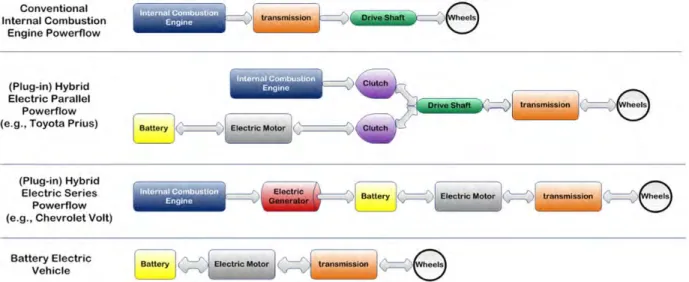
PHEVs have either a series or parallel configuration. The series PHEV is designed for electric motor propulsion only, with the ICE acting as a backup generator. As of June 2013, the only commercially available series PHEV on the market is the Chevrolet Volt. The parallel PHEV has two powertrains (electric and internal combustion), like an HEV, with additional battery capacity and a higher power electric system to extend its electric range. Ford and Toyota currently offer parallel PHEV models, and most OEMs other than Chevrolet and Cadillac are expected to use the parallel configuration.
AEVs operate solely on an electric powertrain and are therefore equipped with large battery packs. Mainstream AEVs typically have a driving range of less than 100 miles per charge.8 AEVs may be less expensive than comparable PHEVs, but they cannot be operated if they are not charged, and therefore require the availability of charging infrastructure. Figure 1 (below) illustrates the different drivetrain configurations of EVs and conventional vehicles.
Figure 1. Simplified Explanation of Different Drivetrain Configurations9
Source: Monica Ralston and Nick Nigro, “Plug-In Electric Vehicles: Literature Review,” accessed June 2013, http://www.c2es.org/docUploads/PEV-Literature-Review.pdf, p. 8.
1.3 Battery Technology and Cost Review
The current generation of EVs uses lithium-ion batteries (the same chemistry used in cell phone and laptop batteries). Lithium-ion batteries are rechargeable, relatively lightweight, and have high energy content. Older battery chemistries used in EVs include lead acid and nickel metal hydride.
EV battery technology has been in development for over a decade, but several factors have prevented widespread deployment, including limitations in battery stability, energy capacity, and energy density. Despite recent advances in rechargeable lithium-ion battery technology,
8
EPA and DOE, “Electric Vehicles: Compare Side-by-Side,” accessed June 2013, http://www.fueleconomy.gov/feg/evsbs.shtml.
9
gasoline provides a car with about 50 to 100 times as much useful energy10 per pound as do the batteries used in current EVs.
Researchers are exploring ways to double or triple battery energy density through technologies such as lithium-sulfur systems, solid-state batteries, and silicon anodes in lithium batteries. These technologies may begin to appear in vehicles over the next decade as a result of
extensive research funded by U.S. Department of Energy (DOE) grants. Toyota demonstrated a prototype solid-state battery in 2010 and may introduce this technology into a vehicle by 2020.11 Solid-state batteries are similar to lithium-ion batteries, but they use a solid electrolyte (as supposed to the liquid electrolyte used in lithium-ion batteries). This results in a smaller, lighter battery. Panasonic is working with Tesla to develop a new generation of silicon anode-based batteries. Its Generation 1B battery systems, which may become available in 2017, will improve energy density by 30 percent relative to current cells.12
In addition to limitations in battery stability, energy capacity, and energy density, the current cost of battery production presents a significant barrier to EV deployment. As of 2012, the
unsubsidized cost of an EV battery was approximately $750 to $800 per kilowatt-hour (kWh).13 Nissan estimates its battery costs to be approximately $500 per kWh, but the company receives subsidies toward capital equipment and manufacturing plant construction (capital costs are approximately 10 to 12 percent of total battery costs).14 Because nearly 72 percent of the remaining costs associated with battery production (e.g., materials, purchased items, labor, and variable overhead) are considered variable costs, economies of scale are expected to bring the cost of the cell down as production of LEAFs, Volts, and other EVs increases. DOE also
estimates that if a battery plant expands production from 10,000 to 100,000 units per year, it can reduce battery costs by 30 to 40 percent.15 Costs of battery cells may therefore fall to $300 per kWh by 2025, as knowledge, scale of production, and size of the market increases.16
Over time, battery costs are also expected to decrease in conjunction with performance increases as a result of technology advancements. For example, the use of lithium-sulfur chemistry in next-generation batteries may increase the energy density of the battery pack and improve the driving range of EVs, while also diminishing potential safety hazards. Advances in battery technology are commonly cited as a prerequisite for widespread adoption of EVs
because they will assist in decreasing vehicle cost, improving electric drive range, and ensuring vehicle reliability.
10
Between 70 and 75 percent of the energy in gasoline is lost between the engine and the wheels (as heat, friction, driving pumps, etc.). EVs are inherently much more efficient and lose only about 20 percent of the electrical energy between the battery and the wheels.
11
Nikkei Electronics, “Toyota Announces 4-layer All-solid-state Battery,” accessed June 2013, http://techon.nikkeibp.co.jp/english/NEWS_EN/20101122/187553/.
12
Generation 1A battery systems are the initial batteries being currently produced. Generation 1B has the same chemistry as Generation 1A but with improved designs.
13
K.G. Duleep et al., “Assessment of Electric Vehicle and Battery Technology,” ICF and Ecological Institute, 2011, 5.
14 K.G. Duleep et al., “Assessment of Electric Vehicle and Battery Technology,” 11. 15
DOE, “The Recovery Act: Transforming America’s Transportation Sector – Batteries and Electric Vehicles.”
16
1.4 Overview of EV Ownership Costs
Primary EV ownership costs include the purchase price and operation and maintenance costs. Consumers’ willingness to pay for new technology currently plays a large role in EV deployment. Nearly 70 percent of consumer survey respondents consider the manufacturer’s suggested retail price (MSRP) to be the most important factor in their vehicle purchase decision.17
Consumers expect EVs to be cost competitive with similar ICE models, with a majority desiring a sticker price under $30,000.18
Consumers’ willingness to pay a premium for EVs depends on how much they value the features and benefits associated with the vehicles, as compared to ICE models. As of March 2013, for many consumers, the additional willingness to pay does not equal the difference in price (incremental cost) between an EV and a comparable ICE or HEV model.19 Table 1 provides a comparison of EV and similar ICE counterpart MSRP. Incentives for EV purchases can help address this price gap (for further discussion of EV incentives, see Section 9).
Table 1. Comparison of EV and Comparable Conventional Vehicle MSRP
EV MSRP Conventional Counterpart MSRP Federal Tax Credit Price Difference Without Credit Price Difference with Tax Credit Chevrolet Volt $39,995 Chevrolet Cruze ECO $21,685 $7,500 $18,310 $10,810 Ford Focus Electric $39,200 Ford Focus Titanium $24,200 $7,500 $15,000 $7,500 Nissan
LEAF S $28,800 Nissan Versa SL $18,590 $7,500 $10,210 $2,710 Toyota Prius
PHEV $32,000
Toyota Prius
Three $25,765 $2,500 $6,235 $3,735
Source: Chevrolet, 2013; Ford Motor Company, 2013; Nissan USA, 2013; Toyota, 2013.
Industry observers generally agree that the production cost of EVs will decrease over time, but they disagree as to how much vehicle pricing will change. The retail price of the EVs, especially for early models, does not necessarily correlate directly with the manufacturer’s cost to produce the vehicle. It is possible that Nissan and Chevrolet are willing to sell their EV models (LEAF and Volt, respectively) at a loss initially in order to gain market share for the vehicles. The OEMs may hope that increased sales will lead to decreased unit production costs, which will enable the companies to recoup any initial losses in later years without changing the price of the vehicle.
17
Deloitte Consulting, “Gaining Traction: A Customer View of Electric Vehicle Mass Adoption in the U.S. Automotive Market,” accessed June 2013,
http://www.deloitte.com.br/publicacoes/2007/MFG.Gaining_Traction_customer_view_of_electric_vehicle_mass_adoption.pdf, 14.
18
Deloitte Consulting, “Gaining Traction: A Customer View of Electric Vehicle Mass Adoption in the U.S. Automotive Market,” 14.
19
It is possible that the incremental cost of EVs as compared to conventional vehicles will also change even if EV purchase prices remain constant. Conventional vehicles will likely become more expensive, as manufacturers comply with more stringent fuel economy and emissions standards.20 The price increase for conventional vehicles will decrease the incremental cost for EVs.
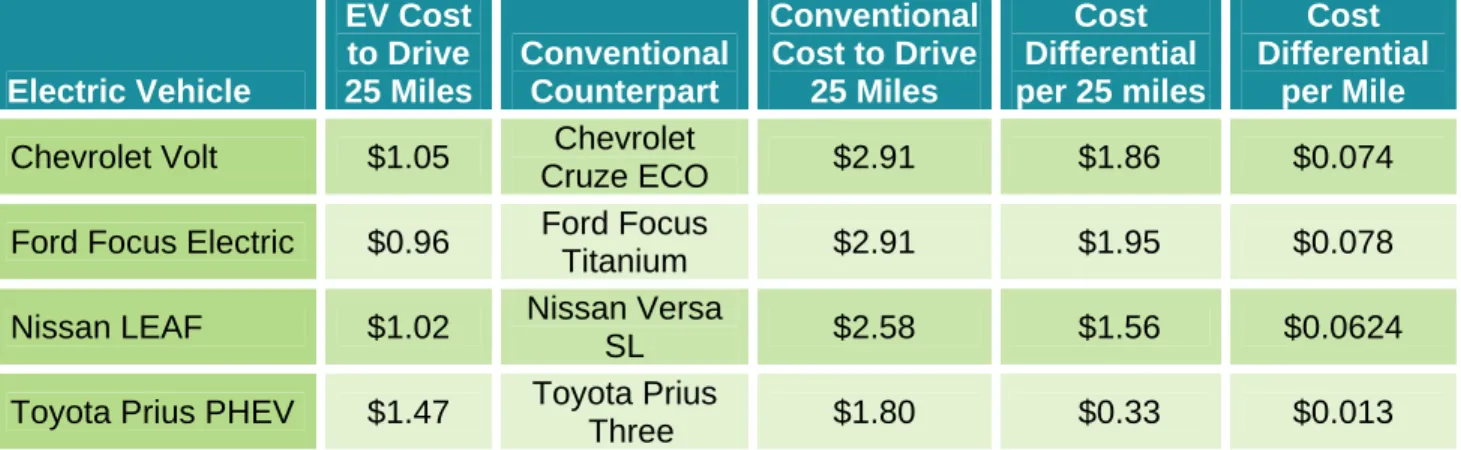
Once individuals have purchased their vehicles, they incur vehicle operation (i.e., fuel) and maintenance costs. As illustrated in Table 2, EVs have significantly lower fuel costs as compared to similar conventional vehicles. However, the cost savings realized from EV
operation (approximately $0.10 per mile for AEVs, as compared to conventional vehicles) may decrease as manufacturers improve the fuel economy of conventional vehicles.
Table 2. Comparison of EV and Comparable Conventional Vehicle Cost Per Mile 21
Electric Vehicle EV Cost to Drive 25 Miles Conventional Counterpart Conventional Cost to Drive 25 Miles Cost Differential per 25 miles Cost Differential per Mile
Chevrolet Volt $1.05 Chevrolet
Cruze ECO $2.91 $1.86 $0.074
Ford Focus Electric $0.96 Ford Focus
Titanium $2.91 $1.95 $0.078
Nissan LEAF $1.02 Nissan Versa
SL $2.58 $1.56 $0.0624
Toyota Prius PHEV $1.47 Toyota Prius
Three $1.80 $0.33 $0.013
Source: EPA and DOE, “Compare Side-by-Side,” accessed June 2013, http://www.fueleconomy.gov/feg/Find.do?action=sbsSelect.
The fuel cost savings from substituting electricity for gasoline are dependent upon the cost structure for electricity in a given region. Studies often estimate EV fuel costs based on fixed electricity prices (e.g., $0.10 to $0.12 per kWh). The price of electricity in the Northeast is typically high relative to the rest of the nation–New England states have average prices ranging from $0.13 to $0.20 per kWh.22 Consumers may receive varying rates depending on their residential load and charging patterns. Although they might incur additional charges by
increasing their residential loads, they might also be able to charge their EVs at off-peak times in areas with lower overnight electricity rates. Thus, electricity costs might be lower or higher than estimated. In addition, analysts forecast a lower rate of inflation for electricity than for
20
EPA and NHTSA, "2017 and Later Model Year Light-Duty Vehicle Greenhouse Gas Emissions and Corporate Average Fuel Economy Standards," 40 CFR Parts 85, 86 and 600; 49 CFR Parts 523, 531, 533, 536 and 537, August 28, 2012.
21
Estimates are for the following 2013 vehicle models: LEAF (automatic) and Nissan Versa (1.8L, 4 cyl, automatic – variable gear ratios; Chevrolet Volt (1.4 L, 4 cyl, automatic) and Chevrolet Cruze Eco (1.4L, 4 cyl, automatic); Ford Focus Electric (front-wheel drive (FWD) – variable gear ratios) and Ford Focus (FWD, 2.0L, 4 cyl, automatic); Toyota Prius Plug-in Hybrid (1.8L, 4 cyl, automatic – variable gear ratios) and Toyota Prius Three (1.8L, 4 cyl, automatic - variable gear ratios).
22
Charles Zhu and Nick Nigro, “Plug-In Electric Vehicle Deployment in the Northeast: A Market Overview and Literature Review,” accessed June 2013, http://www.georgetownclimate.org/sites/default/files/TCI-EV-Lit-Review-1.pdf.
gasoline.23 The use of electricity as a transportation fuel reduces consumer exposure to volatility in the petroleum markets. For a detailed discussion of utility rate structures, see Section 10. Another potential source of savings associated with EVs is reduced vehicle maintenance costs. EVs typically have regenerative braking, which requires significantly less maintenance (e.g., brake pad replacements) than normal braking. EVs without an ICE also do not require oil
changes. Based on an interview with Ford representatives, EV owners save approximately $200 to $300 per year in avoided maintenance costs.24
1.5 Vehicle Technology and Regulatory Trends in the Near, Mid, and Long
Term
President Obama has called for an “all-of-the-above” strategy to promote energy independence, including reducing energy consumption and increasing domestic energy production. Although EV deployment would help achieve the goal of energy independence, other vehicle and fuel policies and technologies have also been deployed to help meet this goal:
In the near term, OEMs can install fuel-saving technology to increase the fuel efficiency of conventional ICE vehicles;
In the midterm, natural gas–increasingly abundant both nationally and in Pennsylvania– could support deployment of natural gas vehicles (NGVs); and
In the long term, hydrogen fuel cells and other technologies could provide a breakthrough innovation that surpasses battery innovations.
This section presents an overview of the regulatory landscape and potential competitors and alternatives to EV deployment in the near, mid, and long term.
1.5.1 Near-Term Outlook
In the near term, EVs will primarily face competition from conventional fuel-saving technologies. Development in vehicle technologies will likely be driven by the Corporate Average Fuel
Economy (CAFE) and GHG standards established by the National Highway Traffic Safety Administration (NHTSA) and the U.S. Environmental Protection Agency (EPA).
In the CAFE and GHG standards for vehicle model years (MY) 2012 to 2016, NHTSA and EPA increased the average fleet fuel economy requirements by approximately five percent per year. For MY 2016, the CAFE standards are estimated to increase fleet-average fuel economy to an average of 34.1 miles per gallon (mpg).
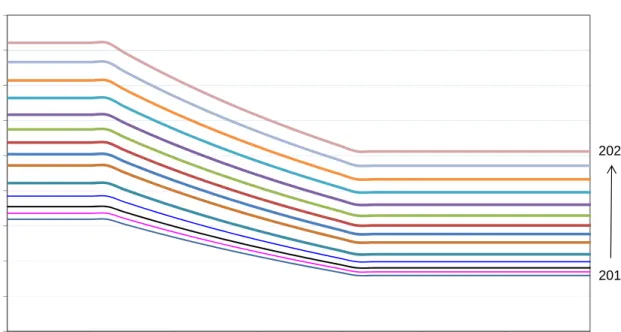
The CAFE standards use a formula based on a vehicle’s footprint or area, which is determined by multiplying the track width by the wheelbase. A vehicle with a smaller footprint must meet a higher fuel economy than a vehicle with a larger footprint. Figure 2 illustrates the increasing
23 EIA, “Annual Energy Outlook 2013: Table 3. Energy Prices by Sector and Source - United States,” accessed June 2013,
http://www.eia.gov/forecasts/aeo/data.cfm#enprisec.
24
stringency of the standards for LDVs from MY 2012 to 2025. The CAFE targets illustrated by these curves are designed so they do not favor small vehicles over large vehicles in order to maintain a variety of vehicle sizes and not limit consumer choice.
Figure 2. LDV CAFE Targets for MYs 2012-2025
Source: EPA and NHTSA, "2017 and Later Model Year Light-Duty Vehicle Greenhouse Gas Emissions and Corporate Average Fuel Economy Standards," 40 CFR Parts 85, 86 and 600; 49 CFR Parts 523, 531, 533, 536 and 537, August 28, 2012.
The CAFE and GHG standards for MY 2017 to 2025 were finalized in August 2012. NHTSA and EPA estimate that the CAFE standards will require a LDV and a light-duty truck combined average of approximately 41 mpg in MY 2021 and approximately 49 mpg in MY 2025. EPA projects its GHG standards, which are harmonized with NHTSA’s CAFE standards, to limit emissions of carbon dioxide (CO2) to163 grams per mile in MY 2025. The regulations do include
some flexibility (e.g., credits for technologies like active aerodynamics). Furthermore, NHTSA and EPA will conduct a midterm review in 2017, during which OEMs are expected to advocate for a reduction in the stringency of the 2025 standards.
In the near term, OEMs will likely minimize compliance costs by implementing “conventional” fuel-saving technologies to meet the CAFE standards. OEMs have already introduced
inexpensive technologies, such as low-friction lubricants, and well-known technologies, such as turbocharging, into their vehicles.
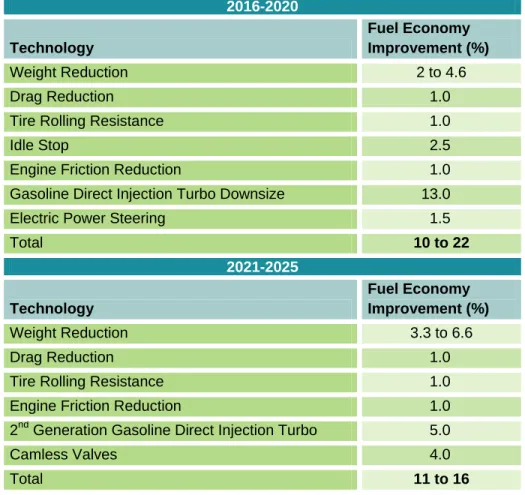
Table 3 (below) lists several technologies that, when combined, could improve fuel economy by over 20 percent by 2020, as well as additional innovations that could provide up to 16 percent additional improvement in fuel economy by 2025. These technologies may allow OEMs to
20 25 30 35 40 45 50 55 60 65 35 40 45 50 55 60 65 70 MP G Footprint (sq ft) 2025 2012
achieve compliance for ICE vehicles, while researching and developing more advanced fuel economy technologies. Note that improvements may not necessarily be additive.
Table 3. Estimates of Fuel Economy Improvements by Select Conventional Technologies 2016-2020 Technology Fuel Economy Improvement (%) Weight Reduction 2 to 4.6 Drag Reduction 1.0
Tire Rolling Resistance 1.0
Idle Stop 2.5
Engine Friction Reduction 1.0
Gasoline Direct Injection Turbo Downsize 13.0
Electric Power Steering 1.5
Total 10 to 22 2021-2025 Technology Fuel Economy Improvement (%) Weight Reduction 3.3 to 6.6 Drag Reduction 1.0
Tire Rolling Resistance 1.0
Engine Friction Reduction 1.0
2nd Generation Gasoline Direct Injection Turbo 5.0
Camless Valves 4.0
Total 11 to 16
Source: H-D Systems, "Major OEM 2020-2025 CAFE and GHG Compliance Strategies," March 2012.
Table 4 documents the additional costs associated with implementing fuel-saving technologies that may be used in MY 2017 to 2025 vehicles. NHTSA and EPA estimated these figures to determine the feasibility of OEMs achieving the CAFE standards. All technologies included in the table are currently available, and every OEM produces at least one vehicle that uses one or more of the technologies. Mainstream adoption of these technologies is expected in the near to midterm.
Technology 2017 ($/Car) 2018 ($/Car) 2019 ($/Car) 2020 ($/Car) 2021 ($/Car) 2022 ($/Car) 2023 ($/Car) 2024 ($/Car) 2025 ($/Car) Conv ention a l Technologi es Low-Friction Lube 4 4 4 4 4 4 4 4 4
Low-Rolling Resistance Tires 6 to 72 6 to 72 6 to 60 6 to 60 6 to 50 6 to 48 6 to 47 6 to 46 6 to 43
8-speed from 6-speed Transmission 80 78 71 70 69 68 67 66 65
Engine Friction Reduction 87 to
182 87 to 182 84 to 182 84 to 182 84 to 182 84 to 182 84 to 182 84 to 182 84 to 175 Cylinder Deactivation 192 189 173 170 167 165 162 160 157 Idle-Stop 394 to 446 385 to 436 348 to 395 340 to 385 332 to 376 324 to 368 317 to 359 310 to 351 303 to 343
Gasoline Direct Injection 413 407 370 364 359 353 348 343 338
Turbocharging 877 864 785 773 761 749 738 727 716 Conversion to Diesel 2,936 to 3,596 2,893 to 3,544 2,627 to 3,218 2,587 to 3,169 2,547 to 3,120 2,509 to 3,073 2,471 to 3,026 2,433 to 2,980 2,397 to 2,936 Mild Hybrid 3,116 to 3,944 3,053 to 3,864 2,554 to 3,233 2,496 to 3,160 2,440 to 3,089 2,386 to 3,021 2,334 to 2,954 2,283 to 2,890 2,234 to 2,827 Full Hybrid 4,947 to 5,352 4,881 to 5,281 4,111 to 4,448 4,049 to 4,381 3,989 to 4,315 3,930 to 4,251 3,872 to 4,188 3,815 to 4,127 3,759 to 4,067 Electric Powertrains
PHEV 20-mile range* 12,296 11,084 10,333 9,356 9,302 9,248 9,195 9,144 7,605
PHEV 40-mile range* 15,900 13,100 12,349 10,969 10,914 10,860 10,807 10,756 8,894
AEV 75-mile range* 17,773 15,280 15,256 13,258 13,236 13,214 13,200 13,187 9,782
AEV 150-mile range* 26,983 23,106 23,083 19,977 19,955 19,934 19,920 19,907 14,716
Source: EPA and NHTSA, “DRAFT: Rulemaking for 2017-2025 Light-Duty Vehicle Greenhouse Gas Emission Standards and Corporate Average Fuel Economy Standards,” 2011, 3-74 - 3-136.
25
At present, the fuel-savings technologies that OEMs incorporate into a conventional powertrain vehicle costs less than $1,000 per technology. The most expensive technologies–turbocharging and gasoline direct injection–are also typically the most effective. Turbocharging technology consists of a fan that harnesses power from engine exhaust and forces compressed air into the cylinder. This compressed air injects additional fuel, producing more power. Turbocharging allows the vehicle to use a smaller engine without sacrificing performance. For instance, a turbocharged four-cylinder engine is estimated to have the same horsepower as a naturally aspirated six-cylinder engine. Turbocharging currently costs approximately $700 to $900 per vehicle and increases fuel economy by seven to eight percent.26
Combining a turbocharged engine with gasoline direct injection (GDI) further increases the vehicle’s fuel efficiency. A typical ICE mixes gasoline with air in a port and pumps that air/fuel mixture into the cylinder. GDI systems, by comparison, inject fuel directly into the cylinder to control the timing and shape of the fuel mist. This allows higher compression ratios and more efficient fuel intake, which deliver higher performance with lower fuel consumption. As Table 3 notes, combining GDI and turbocharging could result in a 13 percent fuel economy improvement and a combined cost of approximately $1,300 per engine.
Using a diesel engine rather than a gasoline engine adds up to $3,600 to the vehicle costs. Diesel engines are inherently more fuel efficient than conventional gasoline engines, and diesel fuel has higher energy density than gasoline. However, despite these benefits, diesel has four main barriers to market success. First, although diesel-powered vehicles typically have a higher fuel economy than gasoline vehicles, diesel fuel has greater carbon content on a volumetric basis than gasoline (resulting in approximately 15 percent greater GHG emissions) and thus is less attractive in the context of GHG standards. Second, compliance with nitrogen oxide (NOx) emissions regulations requires installation of expensive emissions reductions technologies.27 Third, because diesel vehicles were plagued with performance and reliability issues in the 1980s, diesel has low consumer acceptance.28 Fourth, the historically lower price of gasoline as compared to diesel has discouraged installation of diesel fueling infrastructure. As a result, the market share for diesel vehicles has consistently hovered around one percent of the total LDV market.29, 30 Currently, only German OEMs offer diesel vehicles in the United States, but more offerings may emerge in the next few years from U.S. manufacturers, including Chevrolet and Jeep. Diesel trucks, on the other hand, have dominated the heavy-duty market in the United States, and that trend will continue through the midterm. With future advances in gasoline engine technologies, diesel vehicles may not be cost competitive with other LDVs in the United States.
26
DOE and EPA, “Engine Technologies,” accessed June 2013, http://www.fueleconomy.gov/feg/tech_engine_more.shtml#dfi.
27
U.S. Tier 2 emissions fleet average requirement of bin 5 require roughly 45 to 65 percent more NOx reduction compared to the Euro VI standards. EPA and NHTSA. “Rulemaking for 2017-2025 Light-Duty Vehicle Greenhouse Gas Emission Standards and Corporate Average Fuel Economy Standards,” 3-94.
28 EIA, “Light-Duty Diesel Vehicles: Efficiency and Emissions Attributes and Market Issues,” accessed June 2013,
http://www.eia.gov/oiaf/servicerpt/lightduty/execsummary.html.
29
EIA, “Light-Duty Diesel Vehicles: Efficiency and Emissions Attributes and Market Issues.”
30
NHTSA, “New Passenger Car Fleet Average Characteristics,” accessed June 2013, http://www.nhtsa.gov/cars/rules/CAFE/NewPassengerCarFleet.htm.
Another option for improving fuel economy in the near term is increasing the use of HEVs. This report groups HEV architectures into two general systems: mild hybrids and full hybrids, which add up to $4,000 and $5,400 to the base price of a conventional vehicle, respectively. An example of a mild hybrid is the Honda Civic’s Integrated Motor Assist system. The Integrated Motor Assist system comprises an electric motor that connects to the engine’s crankshaft and to the transmission through a torque converter or clutch. It provides sufficient torque for brake energy recovery. The motor also acts as the starter for the engine. However, unlike a full hybrid, a mild hybrid’s motor cannot launch a vehicle on its own. An example of a full hybrid is the Toyota Prius. A full hybrid can operate on gasoline, a combination of gasoline and electricity, or on electricity alone for limited periods of time and can launch itself with only electric power. Supplementing gasoline with electricity recovered from vehicle operations allows the
manufacturer to use a smaller ICE. Both types of HEVs provide emissions reduction benefits relative to comparable conventional ICE vehicles. Mild hybrids can reduce CO2 emissions by 20
to 30 percent, and full hybrids can reduce CO2 emissions by 20 to 35 percent.31 With these
reductions, OEMs can comply with the GHG and CAFE regulations in the near to midterm, while keeping vehicle costs low relative to PHEVs and AEVs.
Because OEMs have a number of fuel-saving technologies they can use in the near term to comply with CAFE and GHG standards, experts do not expect a large increase in the market share of EVs in the near term. OEMs require, on average, a five-year lead time to design, develop, and test a new model, and OEM plans have already been determined through 2016. OEMs will add mature technologies into a vehicle’s redesign cycle, gradually adding more advanced technologies to minimize costs and disruptions to the redesign cycle. As a result of this design cycle, the market share of new EVs will likely not increase dramatically in the near term.
CAFE and GHG standards could also have an indirect negative effect on EV deployment by affecting consumer buying patterns. Although NHTSA and EPA expect the standards to result in net cost savings for consumers due to lower fuel use, they do expect the average LDV purchase price to increase by $154 to $287 for MY 2017 and $1,461 to $1,836 for MY 2025.32 The
increase in purchase price may encourage consumers to purchase a new vehicle before the regulations take effect. If consumers worry about the reliability of new EV technology and choose to purchase more familiar technology, EV market penetration may suffer. Alternatively, consumers may choose to purchase less expensive used vehicles or delay purchase of a new vehicle. As illustrated in Table 1 above, the price of an EV approaches double that of a
comparable ICE without tax credits or other incentives. Although EVs save about $2 in fuel costs per 25-mile trip, these savings may not make up the price difference for many drivers, and cost-sensitive consumers may purchase less expensive used or new conventional vehicles.
31 EPA and NHTSA, “Rulemaking for 2017-2025 Light-Duty Vehicle Greenhouse Gas Emission Standards and Corporate Average
Fuel Economy Standards,” 3-114 - 3-116.
32
EPA and NHTSA, "2017 and Later Model Year Light-Duty Vehicle Greenhouse Gas Emissions and Corporate Average Fuel Economy Standards," accessed June 2013, http://www.nhtsa.gov/staticfiles/rulemaking/pdf/cafe/2017-25_CAFE_Final_Rule.pdf, 1015 and 1503-1505.
The future sustainability and growth of EV sales is uncertain. For instance, Nissan fell short of its goal of 20,000 LEAF sales in 2012–the company recorded only 9,819 sales.33, 34 Thus, OEMs will likely continue to focus on designing vehicles with conventional fuel-saving technologies, supplemented by low-volume EV production. Increasing fuel economy of conventional vehicles may pose significant competition to EV deployment.
1.5.2 Midterm Outlook
In the midterm, CAFE and GHG standards will continue to influence vehicle technology development. In addition, regulations and incentives that encourage natural gas development could influence the vehicle market, and EVs could face competition from NGVs.
In the MY 2017 to 2025 GHG and CAFE standards, EPA adopted temporary manufacturer incentives to encourage AEVs, PHEV, NGVs, and fuel cell vehicles (FCVs). These incentives build upon the MY 2012 to 2016 multiplier incentive, which allows OEMs to count EVs, FCVs, and NGVs as more than one vehicle in CAFE fleet calculations. For MY 2012 to 2016, the multipliers are 2.0 for AEVs and FCVs, 1.2 for PHEVs, and 0 for NGVs. For MY 2017 to 2021, the multipliers range from 1.3 to 2.0, as summarized in Table 5 (below). EPA will not offer multiplier incentives after 2021.
Table 5. Vehicle Multiplier Credits for Model Year 2012-2021
Model Year(s) AEVs and FCVs PHEVs NGVs
2012-2016 2.00 1.20 0
2017-2019 2.00 1.60 1.6
2020 1.75 1.45 1.45
2021 1.50 1.30 1.30
Source: US EPA and NHTSA, "2017 and Later Model Year Light-Duty Vehicle Greenhouse Gas Emissions and Corporate Average Fuel Economy Standards," 669, 680.
Natural gas presents many opportunities as a fuel for vehicles. It is both abundant and inexpensive in the United States. Because of the abundant supply, natural gas prices have dropped significantly during the years immediately preceding this study’s publication. Prices will likely remain low in the foreseeable future.35
Pennsylvania, in particular, may benefit from NGV deployment because it has a large supply of natural gas. According to the U.S. Energy Information Administration (EIA), Pennsylvania’s natural gas production increased from approximately 500 thousand cubic feet per day (Mcfd) to 3,500 Mcfd between 2008 and 2011 due to horizontal drilling with hydraulic fracturing in the Marcellus, Utica, and Geneseo/Burket shale formations.36 The Pennsylvania Department of Conservation and Natural Resources estimates that the Marcellus Shale contains between two
33
Crain Communications, Inc., "U.S. light-vehicle sales by nameplate, December and YTD 2012," Automotive News, June 6, 2013.
34
Lindsay Chappell, “A big bet on EVs,” accessed June 2013,
http://www.autonews.com/apps/pbcs.dll/article?AID=/20121008/OEM01/310089981/a-big-bet-on-evs.
35 EPA and NHTSA, "2017 and Later Model Year Light-Duty Vehicle Greenhouse Gas Emissions and Corporate Average Fuel
Economy Standards," 678-9.
36
EIA, “Horizontal drilling boosts Pennsylvania’s natural gas production,” accessed June 2013, http://www.eia.gov/todayinenergy/detail.cfm?id=6390.
trillion cubic feet (Tcf) and 500 Tcf of natural gas,37 and the State of Pennsylvania has issued close to 12,000 well permits in the Marcellus Shale formation alone.38 A study by Penn State University estimates that during 2010, natural gas drilling and production in the Marcellus Shale added $11.2 billion to the regional economy and created 140,000 jobs. The study forecasts that by 2020, Marcellus Shale will have added $20.2 billion to the regional economy and created 256,000 jobs.39 However, because of the increase in supply and resulting decrease in natural gas prices, drilling companies have reduced operations in Pennsylvania. Drilling began on 618 new natural gas wells between January and April 2012. This represents a decline from the previous year, when drilling began on over 700 new natural gas wells in that same timeframe.40 Promoting NGV deployment could help stimulate the demand for natural gas production in Pennsylvania and provide benefits for the Commonwealth’s economy.
EPA estimates that natural gas may reduce tailpipe GHG emissions by approximately 20 percent relative to gasoline.41 However, it is critical to note that natural gas primarily consists of methane, which is a GHG with a 100-year global warming potential that is 21 times that of CO2.42 Thus, even a small leak of natural gas into the atmosphere during extraction,
transmission, fueling, or storage (in or out of the vehicle) significantly reduces and can even outweigh its other GHG benefits.
Although natural gas is a fossil fuel, NGVs can also be fueled with methane captured from landfills and animal waste, or methane purposely made from other biological sources. This so-called biogas can provide a renewable source of fuel for NGVs.
Another benefit of natural gas is its well-developed distribution infrastructure in the United States. Approximately 300,000 miles of interstate pipelines and 1.2 million miles of distribution lines exist throughout the nation.43 Where no distribution lines exist, trucks can transport natural gas to fueling locations. Many homes have access to natural gas, which could enable home vehicle refueling. BRC FuelMaker offers a home refueling option for LDVs. However, sales of these devices have been low. Honda, which once promoted the $4,500 unit, now recommends that owners of its NGV (the Civic GX) avoid refueling at home because of concerns regarding moisture and contaminants, which may void the vehicle’s warranty.44 NGV deployment would
37 Pennsylvania Department of Conservation and Natural Resources, “Marcellus Shale,” accessed June 2013,
http://www.dcnr.state.pa.us/topogeo/econresource/oilandgas/marcellus/marcellus_faq/marcellus_shale/index.htm.
38
Pennsylvania Department of Conservation and Natural Resources, “Marcellus Shale.”
39
Timothy J. Considine, Robert W. Watson, and Seth Blumsack, "The Pennsylvania Marcellus Shale Natural Gas Industry: Status, Economic Impacts and Future Potential," accessed June 2013, http://marcelluscoalition.org/wp-content/uploads/2011/07/Final-2011-PA-Marcellus-Economic-Impacts.pdf, 31.
40
EIA, “Horizontal drilling boosts Pennsylvania’s natural gas production,” accessed June 2013, http://www.eia.gov/todayinenergy/detail.cfm?id=6390.
41
EPA and NHTSA, "2017 and Later Model Year Light-Duty Vehicle Greenhouse Gas Emissions and Corporate Average Fuel Economy Standards," 677.
42 EPA, “Methane Emissions,” accessed June 2013, http://www.epa.gov/climatechange/ghgemissions/gases/ch4.html. 43 NGVAmerica. "Available NGV Aftermarket Conversion Systems," accessed June 2013,
http://www.ngvc.org/pdfs/Available_Vehicles_and_Engines.pdf.
44
American Honda Motor Company, Inc., “Frequently Asked Questions,” accessed June 2013, http://automobiles.honda.com/civic-natural-gas/faq.aspx.
therefore benefit from additional public fueling infrastructure. As of June 2013, there were 660 public natural gas fueling stations in the United States and 24 public stations in Pennsylvania.45 A hurdle to widespread light-duty NGV deployment is lack of demand and vehicle cost. In the United States, sales average only a few thousand vehicles per year, or about 0.02 percent of the total vehicle market. Only one compact car, the Civic GX, is marketed directly by an OEM. Honda sells approximately 1,500 to 2,000 units of the Civic GX per year.46 If sales do not
increase, experts anticipate that Honda will stop producing the vehicle by 2015. Ford introduced a compressed natural gas (CNG) version of its Transit Connect in 2011 and announced over 120 orders in Los Angeles and Chicago.47 Toyota expressed interest in CNG and showed a concept vehicle at the 2008 Los Angeles Auto Show. However, there is no indication that the concept vehicle will be produced. Overall, OEMs have not indicated support for the natural gas market in terms of LDV offerings. Aftermarket converters will likely offer most of the light-duty NGV products in the near to midterm.
Several aftermarket conversion companies specialize in CNG vehicle retrofits.48 In the light-duty market, conversions typically occur on larger vehicles because smaller vehicles sacrifice trunk space for the CNG fuel tank. Most conversions occur on large pickup trucks and cargo vans, such as the Ford F-Series, Chevrolet Silverado, and Dodge Grand Caravan. Conversion systems must achieve EPA and/or California Air Resources Board (CARB) certification, which requires time and money. However, in 2011, EPA revised regulations to allow conversions of vehicles older than two years to demonstrate compliance through test data of exhaust and evaporative emissions only without certification.49 This allowance may help reduce the cost of conversion certifications and, as a result, vehicle conversion.
Light-duty NGVs currently cost approximately $7,000 to 15,000 more than their gasoline counterparts; the MY 2012 Civic GX base model starts at $26,305, approximately $2,000 more than the Civic Hybrid and $10,000 more than the base gasoline-version Civic DX.50 There are state incentives that may reduce those incremental costs. For example, Pennsylvania’s
Alternative Fuels Incentive Grant (AFIG) Program offers a $1,000 tax rebate for qualified CNG vehicles.51
Medium- and heavy-duty vehicles (e.g., transit buses, delivery trucks, and tractor trailers) can also use CNG and liquefied natural gas (LNG) technology. In 2011, an estimated 52,000
45 CNGPrices.com, “Compressed Natural Gas (CNG) stations and prices for Pennsylvania (PA),” accessed June 2013,
http://www.cngprices.com/stations/CNG/PA.
46
AOL Autos, “Exclusive: Honda Confirms Next-Gen Civic GX Natural Gas Vehicle,” accessed June 2013, http://translogic.aolautos.com/2010/09/15/exclusive-honda-confirms-next-gen-civic-gx-natural-gas-vehicle/.
47
Ford Motor Company, “A Taxi Trend: Ford Transit Connect Compressed Natural Gas Taxis Heading to Los Angeles and Chicago,” accessed June 2013, http://media.ford.com/article_display.cfm?article_id=34802.
48
NGVAmerica, "Available NGV Aftermarket Conversion Systems," accessed June 2013, http://www.ngvc.org/pdfs/Available_Vehicles_and_Engines.pdf.
49
EPA, "EPA Announces Final Rulemaking for Clean Alternative Fuel Vehicle and Engine Conversions,” accessed June 2013, http://www.epa.gov/otaq/consumer/fuels/altfuels/documents/420f12058.pdf, 4.
50 American Honda Motor Company, Inc., “Options & Pricing,” accessed June 2013,
http://automobiles.honda.com/civic-sedan/price.aspx.
51
PA DEP, “Alternative Fuels Incentive Grant Program: Alternative Fuel Vehicle Rebates,” accessed June 2013,
medium- and heavy-duty CNG and LNG trucks were on the road in the United States.52 Natural gas vehicles can have a shorter range per fueling event when compared to a diesel fueled vehicle due to a combination of lower fuel economy and onboard fuel storage limitations. However, heavy duty natural gas engines do not require complex and expensive after-treatment emissions reduction technologies to meet stringent standards, such as diesel particulate filters and selective catalytic reduction catalysts. Heavy-duty natural gas trucks and buses typically cost $50,000 to $100,000 more than their diesel counterparts, depending on vehicle size and range requirements.53 However, PA DEP provides grants to reimburse purchases or retrofits of heavy-duty NGVs, with up to $20 million through 2015.54 DVRPC, together with several of the partners involved in the development of this plan, is managing the Pennsylvania Partnership to Promote Natural Gas Vehicles. This project, supported by DOE Clean Cities funding, will focus on CNG refuse and recycling vehicles, as well as school buses.
Natural gas provides a viable midterm solution to GHG emissions reductions because it is an inexpensive and abundant fuel with a well-developed distribution infrastructure. The market for NGVs is relatively small in the near and midterm, but product offerings could increase with supportive regulations and temporary incentives. Natural gas technology could also serve as a bridge to hydrogen FCV deployment.
1.5.3 Long-Term Outlook
In the long term, FCVs could present competition for EVs. One of the primary drivers for FCVs today is the potential compliance pathway for zero emission vehicle (ZEV) regulations in California.
There are currently several major challenges to deploying FCVs. For example, OEMs have stated that significant technological and economic gaps exist in the distribution of hydrogen from production facilities to fueling stations.55, 56 In order for FCVs to compete, expanded hydrogen distribution infrastructure will be necessary. Federal and state programs, together with the private sector, could provide the necessary investment.
Currently, hydrogen is distributed either as a compressed gas in cylinders or in liquefied form in tanker trucks. Compressed gas is space inefficient, requiring a large truck to carry 50 to 100 kg of hydrogen. Liquefaction and cryogenic storage are energy inefficient and expensive;
approximately one-third of the energy content of hydrogen is used in the liquefaction process. Because of these challenges, most hydrogen is produced in large facilities close to the where it is used. This approach works well for large commercial chemical applications, where the fuel is
52
EIA, “How many alternative fuel and hybrid vehicles are there in the U.S.?,” accessed June 2013, http://www.eia.gov/tools/faqs/faq.cfm?id=93&t=4.
53
Baytech (CNG Aftermarket Converter), phone interview, 2009.
54
PA DEP, “Natural Gas Vehicle Program,” accessed June 2013,
http://www.portal.state.pa.us/portal/server.pt/community/act_13/20789/natural_gas_vehicle_program/1157504.
55 USA Today, “Automakers take fresh look at hydrogen fuel cells,” accessed June 2013,
http://www.usatoday.com/story/driveon/2012/10/02/hydrogen-fuel-cells-2015/1605229/.
56
Angela G. Keane and Alan Ohnsman, “Fuel-Cell Frenzy Looks to Convert Obama Favoring Plug-Ins,” accessed June 2013, http://www.businessweek.com/news/2012-06-20/fuel-cell-frenzy-looks-to-convert-obama-favoring-plug-ins#p1.
consumed at a single facility. However, it is not well suited for distributed consumption at local fueling sites.
One method of hydrogen production–steam methane reforming using natural gas as a
feedstock fuel–shows promise for overcoming this distribution challenge. In this process, natural gas feedstock converts to hydrogen on site through high-temperature mixing with vaporized water, resulting in hydrogen and carbon dioxide. Further purification removes contaminants (e.g., sulfur) from the fuel to prevent damage to the FCV. However, gaps exist in several components of the on-site production cycle. EPA believes that investments in a natural gas infrastructure could lay the framework for the infrastructure necessary for on-site hydrogen production.57 Future fueling stations could produce hydrogen using natural gas that is already being delivered to the site.
An alternative option to balance production and distribution costs may be developing a network of small- to medium-scale production facilities close to the network of hydrogen stations. Such a network would reduce the burden of downstream distribution, while avoiding the costs of on-site production. However, it may be limited by production-level capacity. Large centralized facilities can produce approximately one million kg of hydrogen per day. In contrast, distributed facilities would produce only 5,000 to 50,000 kg of the fuel daily. This low-volume production could support the nascent hydrogen fuel market to 2020, but it would not be enough to support a large population of FCVs.
Vehicle production cost also presents a barrier to FCV deployment. The current production cost of an FCV in production volumes of 100 to 200 vehicles per year is estimated at approximately $100,000 (of which the fuel cell system alone accounts for about half the cost).58 If
manufacturers produce these vehicles at volumes of 10,000 to 20,000 a year, typical scale elasticities of -0.2 for the fuel cell system suggest vehicle prices in the $50,000 range. This price would still be too expensive for the mass market, even with the currently available federal tax credit. In addition, current fuel cell systems cannot last the life of a vehicle (typically 15 years), and the cost of replacement is very high. Hence, market entry requires substantial cost
reduction for fuel cell production.59
An additional challenge is on-board storage of hydrogen. Historically, vehicles stored hydrogen in high-pressure tanks at 350 bar pressure. This limited storage to about three kg of hydrogen, which provides approximately 200 miles of range. Newer vehicles use 700 bar storage, which allows storage of about five kg of hydrogen and increases vehicle range to approximately 350 to 400 miles. However, the carbon fiber-wrapped tanks to store five kg of hydrogen at 700 bar storage currently cost about $15,000 per vehicle and will be expensive even in high-volume production. Reducing the price of FCVs will require improvements in on-board hydrogen storage.
57 EPA and NHTSA, “2017 and Later Model Year Light-Duty Vehicle Greenhouse Gas Emissions and Corporate Average Fuel
Economy Standards," 679.
58
ICF, "Hydrogen Fuel Cell Vehicles: Latest Developments and Product Plans," August 2012.
59
OEMs have made improvements in all aspects of fuel cell technology, including size, durability, and cost, and they anticipate that they will have made sufficient progress on these issues to allow for low-scale production in 2015 to 2016. For example, Toyota plans to release a fuel-cell sedan in 2015.60
OEMs believe that FCV technology is the most economically feasible zero-emission technology for larger vehicles (EV battery size and weight pose disadvantages for larger applications). In the long term, OEMs like Toyota expect to produce AEVs for compact cars, PHEVs for midsize vehicles, and FCVs for light-duty to heavy-duty trucks.61
This overview of the near- to long-term outlook for clean vehicle technologies demonstrates that EVs are not the only pathway to a cleaner environment and petroleum independence. Other fuels and technologies, such as natural gas and fuel cells, could also provide viable solutions. The auto industry will continue to innovate and reduce the production costs of advanced technologies like batteries and fuel cells. In particular, if OEMs decrease production costs, and fuel producers and distributors expand the hydrogen fueling infrastructure, FCVs may
experience increased market penetration in the long term.
This overview also highlights the role of policy and regulations in the commercial success of emerging technologies. The GHG and CAFE regulations have already encouraged use of conventional ICE technologies to increase fuel economy and will likely require deployment of EVs for compliance in the midterm. In the long term, the CAFE and GHG regulation vehicle multiplier incentives could generate competition between EV and FCV technology. The
Commonwealth of Pennsylvania may add to these incentives by providing temporary tax credits and rebates for NGVs, which could increase natural gas demand and benefit the Pennsylvania economy.
60 Alisa Priddle, “Toyota to start selling hydrogen fuel-cell car in 2015,” accessed June 2013,
http://content.usatoday.com/communities/driveon/post/2012/08/toyota-to-start-selling-hydrogen-fuel-cell-car-in-2015/1#.UbD5EefV9c8.
61
Toyota Motor Corp, “Toyota's Strategy for Environmental Technologies,” accessed June 2013, http://www.toyota-global.com/innovation/environmental_technology/strategy_environmental_tech.html.