THE CO-EVOLUTION OF MICROSTRUCTURE FEATURES IN SELF-ION IRRADIATED HT9 AT VERY HIGH DAMAGE LEVELS
by
Elizabeth Margaret Getto
A dissertation submitted in partial fulfillment of the requirements for the degree of
Doctor of Philosophy
(Nuclear Engineering and Radiological Sciences) in The University of Michigan
2016
Doctoral Committee:
Professor Gary S. Was, Chair
Associate Research Scientist Zhijie Jiao Professor Amit Misra
Adjunct Professor Roger Stoller Professor Lumin Wang
Copyright © 2016 Elizabeth Margaret Getto
ii To my family
iii
ACKNOWLEDGEMENTS
I would first like to thank my thesis advisor, Dr. Gary Was. His insight, suggestions and input have been instrumental throughout my doctoral program. I would also like to thank my committee members, Dr. Roger Stoller, Dr. Lumin Wang, Dr. Zhijie Jiao and Dr. Amit Misra. Their input has greatly improved the quality of my thesis and has been invaluable.
I would like to thank the members of Was research group including Dr. Janelle Wharry, Dr. Anne Campbell, Dr. Mike McMurtrey, Dr. Cheng Xu, Dr. Gokce Gulsoy, Dr. Tyler Moss, Dr. Kale Stephenson, Dr. Shyam Dwaraknath, Stephen Raiman, Anthony Monterrosa, Justin Hesterberg, Stephen Taller, Gerrit Vancoervering, David Woodley, Drew Johnson, Rigel Hanbury and Rajan Bhambroo. The mentorship, help in the lab, moral support and camaraderie have been the best part of my graduate school experience. I especially would like to thank Gerrit Vancoervering for his aid in the modeling section of my dissertation. I am forever indebted to the staff at the Michigan Ion Beam Laboratory, Dr. Ovidiu Toader, Dr. Fabian Naab, Dr. Prabir Roy, Thomas Kubley and Dr. Ethan Uberseder, for support of many, many hours of ion irradiations and many emergency calls after midnight. I would also like to thank Dr. Kai Sun at the Michigan Center for Material Characterization and Dr. Zhijie Jiao for assistance in the microscopy required for both my research project and dissertation.
Without the support of Dr. Micah Hackett at TerraPower, LLC., this work would have never happened. Dr. Hackett’s insights, support and ideas helped shape the irradiation program
iv
that led to my final dissertation. To Dr. Alexander Barashev and Dr. Stas Golubov at Oak Ridge National Laboratory, I am truly thankful for all your patient assistance helping me with the modeling section of my thesis. A special thanks as well to Dr. Frank Garner for many enjoyable and insightful conversations and discussions about void swelling and radiation effects over the last five years.
I am grateful for the support of the Beering Scholarship at Purdue University, which started me off on my higher education journey. I am also grateful to the National Science Foundation Graduate Research Foundation for the funding of my first three years of graduate school.
To my parents, Anne and David Beckett, thank you for the love and support throughout my whole life. I am forever gratefully for you encouraging me to follow my dreams and for your constant love and prayers. I cannot imagine this journey without your support. Anchors aweigh! To Rob, Lynn, Eleanor and Philip Beckett, thank you for your love and support and making me laugh when I need it the most.
Finally, to my husband Josh: thank you for your love for all these years, always being my biggest fan, knowing just what to say when I’m about to give up, making me a better person and for all those burritos delivered to the lab at all hours of the day or night.
v
TABLE OF CONTENTS
DEDICATION….. ... ii
ACKNOWLEDGEMENTS ... iii
LIST OF TABLES ... x
LIST OF FIGURES ... xii
LIST OF APPENDICES ... xxvii
ABSTRACT……... ... xxviii
CHAPTER 1 INTRODUCTION ... 1
CHAPTER 2 BACKGROUND ... 1
2.1 Mechanisms of Void Swelling ... 2
2.1.1 Introduction to Void Swelling ... 2
2.2 Ferritic-Martensitic Alloys ... 4
2.2.1 Physical Metallurgy ... 5
2.3 Void Swelling Experiments in Ferritic-Martensitic Alloys ... 7
2.3.1 Void Swelling under Neutron Irradiation ... 8
2.3.2 Void Swelling under Ion Irradiation ... 12
2.3.3 Defect Partitioning ... 15
2.4 Dislocation Microstructure ... 16
2.4.1 Loop Character... 16
2.4.2 Dislocation Microstructure under Irradiation ... 17
2.5 Precipitation of Secondary Phases ... 19
2.5.1 Precipitate Types in HT9 ... 19
2.5.2 Precipitate Behavior under Irradiation ... 22
2.6 Other Irradiation Effects... 24
2.6.1 Radiation-Induced Segregation ... 24
vi
CHAPTER 3 OBJECTIVE... 48
CHAPTER 4 EXPERIMENTAL PROCEDURE ... 50
4.1 Sample Preparation ... 50 4.1.1 Sample Processing ... 50 4.1.2 Sample Preparation ... 51 4.2 Helium Preimplantation ... 52 4.3 Fe++ Irradiations ... 53 4.3.1 Irradiation Set-up ... 53
4.3.1.1 Copper Stage with Indium ... 54
4.3.1.2 Copper Stage with Indifoil ... 56
4.3.1.3 Nickel Stage with Copper Foil ... 56
4.3.2 Displacement Damage ... 57
4.3.3 Damage Calculation ... 58
4.3.4 Apertures and Beam Scanning ... 59
4.3.4.1 Stage Aperture System ... 59
4.3.4.2 Slit Aperture System ... 61
4.3.5 Temperature Control ... 63
4.3.5.1 Thermocouples ... 63
4.3.5.2 Thermal Imager ... 64
4.3.6 Irradiation Setup and Control... 64
4.4 5 MeV Fe++ Irradiation Results ... 65
4.5 Post-Irradiation Sample Preparation and Microstructure Characterization ... 67
4.5.1 TEM Specimen Preparation ... 67
4.5.2 Void Swelling Measurement and Characterization ... 68
4.5.2.1 Imaging Conditions ... 69
4.5.2.2 Void Counting and Determination of Region of Interest ... 71
4.5.2.3 Error Analysis ... 73
4.5.3 Precipitate Measurement, Characterization and Imaging ... 76
4.5.4 Dislocation Imaging ... 77
CHAPTER 5 RESULTS OF MICROSTRUCTURE EVOLUTION UNDER ION IRRADIATION ... 111
vii
5.1 Unirradiated Microstructure Characterization ... 111
5.2 Void Swelling Results ... 113
5.2.1 Determination of Valid Region of Interest ... 114
5.2.2 Damage Dependence at 440oC... 117
5.2.3 Temperature Dependence at 188 dpa ... 118
5.2.4 Damage Dependence at 460oC... 120
5.2.4.1 Grain to Grain Void Variation ... 123
5.2.5 High Swelling Correction ... 124
5.3 Secondary Phase Results ... 127
5.3.1 G Phase ... 127 5.3.2 M2X ... 129 5.4 Dislocation Microstructure ... 131 5.4.1 Dislocation Network ... 132 5.4.2 Dislocation Loops ... 132 CHAPTER 6 MODELING... 192 6.1 Modeling Methodology ... 192
6.1.1 Introduction to RIME Model ... 192
6.1.2 Description of Model Physics ... 194
6.1.2.1 Master Equations ... 194
6.1.2.2 Sink Strength Calculations ... 197
6.1.2.3 Defect Production Rates ... 198
6.1.2.4 Network Dislocation Evolution ... 198
6.1.2.5 Calculation of Radii/Swelling ... 200
6.1.2.6 Grouping Scheme ... 201
6.1.2.7 Consideration of Production Bias Model ... 202
6.1.3 Description of Main Sub Routines ... 202
6.1.4 Sensitivity Analysis ... 206
6.1.5 Input Parameter Selection ... 208
6.2 Adaptations to RIME Model for Void Growth-Dominated Microstructure ... 210
6.2.1 Pre-Existing Microstructure ... 211
viii
6.2.3 Carbon-Vacancy Interactions... 214
6.2.4 Precipitation ... 216
6.3 Development of Reference Cases ... 220
6.3.1 Comparison of Reference Cases to Experimental Data ... 221
6.3.1.1 Ref.0: Constant Network Density ... 221
6.3.1.2 Ref.1: Experimentally Input Dislocation Evolution ... 222
6.3.1.3 Ref.2: Dynamic Dislocation (DD) Evolution ... 223
CHAPTER 7 DISCUSSION: CO-EVOLUTION OF THE IRRADIATED MICROSTRUCTURE ... 257
7.1 Analysis Scope ... 257
7.1.1 Definitions of Modifications to Reference Cases ... 260
7.2 Effect of Dislocations on Voids ... 260
7.2.1 Summary of Dislocation and Void Evolution ... 262
7.2.2 Case Ref.0: Experimentally input network dislocations ... 263
7.2.3 Case Ref.1: Experimentally input network and loops ... 264
7.2.4 Case Ref.2: Dynamic Dislocation Treatment ... 265
7.2.5 Comparison of Model to Experiment ... 267
7.3 Effect of Precipitates on Voids... 271
7.3.1 G Phase ... 271
7.3.2 M2X ... 273
7.4 Effect of Precipitates on Dislocations ... 277
7.4.1 G Phase ... 277
7.4.2 M2X ... 279
7.5 Carbon Trapping ... 283
7.6 Combined Impact of Microstructure Features on Voids and Dislocations ... 289
7.7 Alternate Considerations Regarding Overall Microstructure Co-evolution ... 292
7.7.1 Discussion of Other Possible Interaction Mechanisms ... 292
7.7.1.1 Lower Effective Bias ... 292
7.7.2 Reconsidering Swelling Rates from Experiment ... 293
CHAPTER 8 CONCLUSIONS ... 337
ix
APPENDICES.. ... 343 REFERENCES… ... 379
x
LIST OF TABLES
Table 2.1: Summary of observed dislocation behavior in FM alloys. ... 28 Table 4.1 Chemical composition of HT9 in wt% [9]. ... 80 Table 4.2: Variables used in calculation of damage under 5 MeV Fe++ irradiation. ... 81 Table 4.3: List of samples utilized in this thesis, including target irradiation temperature, damage and date. ... 82 Table 4.4: Summary of irradiation data from 5 MeV Fe++ irradiations referred to in this thesis. 83 Table 5.1: As-received microstructure characterization of HT9 (84425). ... 137 Table 5.2: Void results from damage dependence study at 440oC and temperature dependence
study at 188 dpa. ... 138 Table 5.3: Summary of void data from damage dependence experiment performed at 460oC. . 139 Table 5.4: Summary of G phase and M2X behavior from damage dependence experiment
performed at 460oC. ... 140
Table 5.5: Summary of dislocation microstructure data from damage dependence study
performed at 460oC. ... 141
Table 6.1: Summary of sub routines in RIME model. Updates, changes and notes are included in the last column. ... 225 Table 6.2: Parameters used in a complete input file. Highlighted boxes in red are not used for the purpose of this work. Highlighted boxes in yellow have been adapted or changed. . 227 Table 6.3: Output file descriptions from RIME Model. ... 232 Table 6.4: Main input parameters used in sensitivity analysis. These inputs correspond to Ref.2
shown in Table 6.9. ... 236 Table 6.5: Significance calculated for swelling and swelling rate at 460oC, 21 and 100 dpa with
and without the addition of unbiased precipitates at experimental levels observed for G phase. (Ref.2) ... 237 Table 6.6: Significance of key input parameters in RIME model. ... 238
xi
Table 6.7: Main changes in parameterization from FCC to BCC alloys. ... 239 Table 6.8: Concentration [10] and diffusion coefficients at 500oC for minor alloying elements in
HT9. ... 240 Table 6.9: Definition of reference case input. Changes between each reference case highlighted
in yellow. ... 241 Table 7.1: Description of flags denoting modification of reference cases with various
microstructure treatments. ... 298 Table 7.2: Dislocation biases for interstitials reported in literature using a variety of approaches.
... 299 Table 7.3: Description of reference cases with modifications used to match void and dislocation
behavior to experiment. ... 300 Table 7.4: Summary of attempts to match microstructure behavior with precipitate and carbon
treatments. ... 301 Table 7.5: Comparison of relative effect on final swelling values at 650 dpa of each
microstructure treatment. ... 302 Table 7.6: Comparison of swelling rates calculated in the range of 188 to 650 dpa using nominal or fixed depth method [85]. ... 303
xii
LIST OF FIGURES
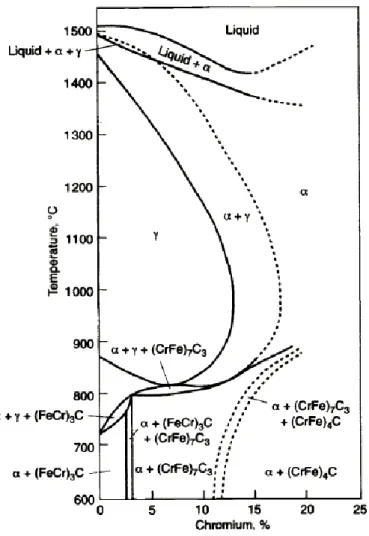
Figure 2.1: Expected swelling behavior as a function of damage. Adapted from [19]. ... 29 Figure 2.2: Effect of chromium on the constitution of Fe-Cr-C alloys with 0.1% carbon.
(CrFe)4C is the M23C6 carbide [3]. ... 30
Figure 2.3: Continuous cooling transformation (CCT) diagram for 12Cr-MoVNb martensitic steel where A refers to austenite, K refers to carbide, Sp-δ refers to trace ferrite, M refers to martensite, P=pearlite, AC1b is the start of austenite formation upon heating,
AC1e is the completion of austenite formation upon heating and λ is the cooling rate
(oC/min) from [3]. ... 31 Figure 2.4: a) Schematic [32] and b) micrograph of typical HT9 microstructure prior to
irradiation [3]. ... 32 Figure 2.5: Stress-free swelling of irradiated HT9 up to 165 dpa for 4 heat treatments. Heat 1 and
Heat 2 were subjected to the same heat treatment: 1038oC/5 min/air followed by 760oC/30 min/air cool. Heat 3 and 5 were subjected to 1100oC/2 min/air cool followed by 650o/120 min/air cool [4]. ... 33 Figure 2.6: Swelling in Fe-Cr alloys as a function of damage [33]. ... 34 Figure 2.7: Adjustment of damage levels in EBR-II results by Garner et al. [8] to data collected
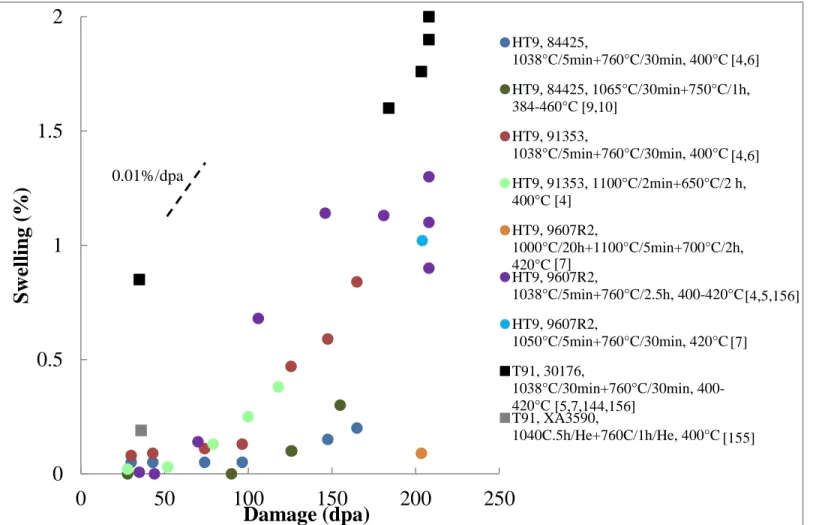
by Gelles [33]. ... 35 Figure 2.8: Summary of HT9 and T91 irradiated in-reactor up to 208 dpa. ... 36 Figure 2.9: a) Temperature dependence of void swelling in EM12 and HT9 irradiated to 150 dpa b) Damage dependence of swelling of EM12 and HT9 up to at 500oC [14]. ... 37
Figure 2.10: a) Temperature dependence of swelling in ferritic steel irradiated with 200 keV C+ ions to 150 dpa and b) damage dependence of swelling in ferritic steels irradiated with 200 keV C+ ions at 575°C [40]. ... 38
xiii
Figure 2.11: a) Damage dependence of commercial alloys up to 600 dpa at 450 or 480oC. b) Temperature dependence experiment at 100 dpa and 500 dpa on MA957 ODS ferritic steel [15]. ... 39 Figure 2.12: Summary of ion irradiations performed upon HT9 [14,15,40]. ... 40 Figure 2.13: Q analysis for various neutron irradiations [34]. ... 41 Figure 2.14 Temperature dependence of loop number density and diameter in 14 MeV
Ni-irradiated HT9 [35]. Note that loops of size of 800 nm would typically be classified as an unfaulted network. ... 42 Figure 2.15: A summary of dislocation loop results as a function of temperature in neutron and
ion irradiated HT9 [7,35]. ... 43 Figure 2.16: HT9 irradiated to a) 4 dpa at 505oC b) 28 dpa at 384oC c) 155 dpa at 443oC [10]. . 44 Figure 2.17: Formation of rod-like precipitates in 13Cr-2Mo-TiO2 after Cr irradiation at 500oC to
a) 30 dpa and b) 150 dpa [38]. ... 45 Figure 2.18: Representative stress/strain curves for Mod 9Cr-1Mo after irradiation in spallation
environment [56]. ... 46 Figure 2.19: Comparison of the behavior of martensitic steels in the tempered and as-quenched
conditions [59]. ... 47 Figure 4.1: Unirradiated HT9 (Heat 84425) imaged in STEM-BF. Sample made via FIB liftout
method ... 84 Figure 4.2 Sample geometry following EDM. Only one face will be irradiated. ... 85 Figure 4.3: Assembly used for electropolishing of samples. Samples polished in 90%
methanol/10% perchloric acid solution. ... 86 Figure 4.4: The helium profile (blue) is overlaid on the damage rate (red) and implanted ion
concentration (green) for 5 MeV Fe++ in Fe-12Cr calculated from SRIM [64]. ... 87 Figure 4.5 Schematic of irradiation stage and position of 2D thermal imager on beamline. ... 88 Figure 4.6: a) Schematic of hold-down bars and b) view of hold-down bars on the stage [32]. .. 89 Figure 4.7: a) “First generation stage” schematic where indium is used to ensure good thermal
contact and apertures were attached to the stage. b) “Second generation stage” schematic where a combination of indium and graphite foil were utilized to ensure good thermal conductivity and leak protection. ... 90 Figure 4.8: Stage design as viewed from the top [32]. ... 91
xiv
Figure 4.9: Completed stage after irradiation at 460oC to 130 dpa. ... 92 Figure 4.10: a) Schematic and b) stage image for temperature uniformity test. c) Results of the
24-hour test on the beamline. ... 93 Figure 4.11: Schematic of "third generation" stage configuration with a) stage and b) slit
apertures. Copper foil provided sufficient thermal contact and eliminated indium leaks. Slit apertures eliminated danger of aperture shift, which could occur during stage loading onto beamline. ... 94 Figure 4.12: Top view of stage design with slit aperture system. The aperture feedthrough was
replaced with an additional thermocouple feedthrough. ... 95 Figure 4.13: Schematic of tantalum aperture system. ... 96 Figure 4.14: Schematic of benchtop alignment setup of stage apertures [32]. ... 97 Figure 4.15: Path of raster scanned beam center across samples over irradiated area [13,32]. .... 98 Figure 4.16: a) Schematic of raster scanned beam area after beam sizing procedure with ceramic. b) Beam intensity profile due to Gaussian beam shape ... 99 Figure 4.17: Irradiation stage a) without and b) with alignment laser. ... 100 Figure 4.18: 2D thermal image from 460oC, 130 dpa irradiation. Two AOIs per samples were
placed on 5 samples with two guide bars bookending the samples. ... 101 Figure 4.19: Example temperature histogram for 5 MeV Fe++ irradiation of ACO3-460C-450dpa-10He-021615 showing approximately normal distribution in both areas of interest (top and bottom) on the sample and having 2σ well within ±10oC. ... 102
Figure 4.20: a) Platinum deposited on the surface of the irradiated sample b) trenching around the platinum protected surface c) under cut of the samples d) attaching the needle to the lamella using platinum e) attaching the lamella to the copper grid f) thinning using the Ga beam... 103 Figure 4.21: Schematic of cross-sectional liftout and resulting image in HAADF STEM. The PT
layer and irradiated surface are at the top of the image. Voids are dark circles. Sample irradiated at 460oC to 188 dpa with 10 appm He preimplanted. ... 104 Figure 4.22: Conventional BF (a) and STEM BF (b) images of voids in HT9 irradiated with 5
MeV Fe++ at 460oC to 375 dpa with 10 appm He preimplanted. Note that all voids are in focus in (b) while conventional images show some voids in over or under focus. 105
xv
Figure 4.23: STEM ADF (a) and BF (b) images of HT9 irradiated with 5 MeV Fe++ at 440oC to 140 dpa with 100 He preimplanted. Voids obscured by diffraction contrast in BF (b) are clearly observed in ADF (a) as black circles... 106 Figure 4.24: Example of STEM HAADF and BF images stitched together to show entire liftout.
(HT9, 440oC, 188 dpa, 10 appm He) ... 107
Figure 4.25: Depth profiles for void a) diameter b) number density and c) swelling in HT9 irradiated at 440oC to 140 dpa with 100 appm He preimplanted [12]. ... 108
Figure 4.26: Error for diameter, number density and swelling as a function of average void diameter. ... 109 Figure 4.27: Orientation and shapes of dislocation loops in FM alloys imaged along <001> axis
[32]. ... 110 Figure 5.1: As-received HT9 sample prepared via FIB liftout method showing representative
microstructure. ... 142 Figure 5.2: Optical micrograph of as-received HT9 after etching. The etchant used was Vilellas’s reagent which includes 1 g picric acid with 5 mL of hydrochloric acid in a solution of 100 mL [63]. ... 143 Figure 5.3: Indexed diffraction of bcc matrix of HT9. ... 144 Figure 5.4: Void formation in the a) irradiated area and b) near surface in HT9 preimplanted with
10 appm He then irradiated with 5 MeV Fe++ to 188 dpa at 440oC. ... 145 Figure 5.5: Void a) diameter b) number density c) and swelling profiles with depth in HT9
preimplanted with 10 appm He then irradiated with 5 MeV Fe++ to 188 dpa at 460oC. ... 146 Figure 5.6: Determination of location of onset of swelling increase after swelling peak near the
surface (from [12]). ... 147 Figure 5.7: Determination of location of onset of in swelling decrease at depths of 700 nm or
greater (from [12])... 148 Figure 5.8: HAADF images of HT9 preimplanted with 10 appm He then irradiated with 5 MeV
Fe++ at 440oC to a) 25 dpa b) 50 dpa c) 140 dpa and d) 188 dpa. ... 149
Figure 5.9: a) Diameter and b) number density of voids in HT9 preimplanted with 10 appm He then irradiated with 5 MeV Fe++ at 440oC up to 188 dpa. ... 150
xvi
Figure 5.10: Void swelling in HT9 preimplanted with 10 appm He then irradiated with 5 MeV Fe++ at 440oC up to 188 dpa. Swelling values are indicated above the data points. .. 151 Figure 5.11: HAADF images of HT9 preimplanted with 10 appm He then irradiated with 5 MeV Fe++ at a) 440 oC b) 460 oC and c) 480oC to 188 dpa. ... 152 Figure 5.12: Void a) diameter and b) number density (red) in HT9 preimplanted with 10 appm
He then irradiated with 5 MeV Fe++ to 188 dpa between 440 to 480oC. ... 153 Figure 5.13: Swelling in HT9 preimplanted with 10 appm He then irradiated with 5 MeV Fe++ to
188 dpa between 440 and 480oC. Micrographs of typical voids are included for each
temperature. ... 154 Figure 5.14: a) Diameter and b) number density as a function of damage for 440oC (red), 460oC
(blue) and 480oC (green). Dashed lines extrapolated expected damage evolution at 440oC and 480oC resolving peak diameter and number density observed at 460oC, 188 dpa. At 300 dpa, it is expected that diameter will increase with temperature and
number density will decrease as is predicted by theory since all three will be in void growth-dominated regime. ... 155 Figure 5.15: Void evolution as a function of damage in HT9 irradiated with 5 MeV Fe++ at 460oC
after preimplantation with 10 appm He. Voids are the dark circles and marked with red arrows. Orange rectangles denote the 500 to 700 nm region. ... 156 Figure 5.16: Void diameter as a function of damage in HT9 irradiated with Fe++ at 460oC with 10
appm He preimplanted. ... 157 Figure 5.17: Void number density as a function of damage in HT9 irradiated with Fe++ at 460oC
with 10 appm He preimplanted. ... 158 Figure 5.18: Void swelling as a function of damage in HT9 irradiated with Fe++ at 460oC with 10
appm He preimplanted. ... 159 Figure 5.19: Comparison of linear or parabolic regression analysis applied to void swelling
resulting from HT9 irradiated with Fe++ at 460oC with 10 appm He preimplanted... 160
Figure 5.20: Representative images of δ-ferrite (a, c) and martensite (b, d) at 130 and 450 dpa. ... 161 Figure 5.21: Comparison of diameter, number density and swelling in ferrite and martensite
xvii
Figure 5.22: Damage rate (dpa/s) curve as a function of increasing damage due to void swelling. Beam current is assumed to be constant for all irradiations so damage rate can be directly compared. ... 163 Figure 5.23: a) Effective damage rate calculated from SRIM. b) Swelling vs. damage with fixed
depth correction. ... 164 Figure 5.24: Void diameter, number density and swelling depth profiles as well as void
distribution in the 500 to 700 nm depth region of HT9 irradiated with 5 MeV Fe++
(ACO3) at 460oC, to 550 dpa with 10 appm He. ... 165
Figure 5.25: Void diameter, number density and swelling depth profiles as well as void distribution in the 500 to 700 nm depth region of HT9 irradiated with 5 MeV Fe++ (ACO3) at 460oC, to 650 dpa with 10 appm He. ... 166 Figure 5.26: G phase evolution with increasing damage irradiated at 460oC with 5 MeV Fe++ with
10 appm He preimplanted. Some G phase precipitates are marked by red arrows. ... 167 Figure 5.27: APT analysis of two G phase precipitates observed at HT9 irradiated with 5 MeV
Fe++ at 440oC to 140 dpa with 10 appm preimplanted. APT confirms composition of Mn6Ni16Si7 by observation of expected concentrations in at% (55%Ni-24%Si-21%Mn)
in Precipitates b) 1 and c) 2. ... 168 Figure 5.28: STEM BF image of G phase with corresponding XEDS map. Ni is in red and Si in
blue. ... 169 Figure 5.29: HRTEM BF image of G phase in the matrix. The much larger lattice parameter of G phase (a=1.148 nm) relative the matrix a=0.286 nm. The incoherent interface is clearly visible. The FFT pattern of the outlined region in the image (red frame) is inset in the top left corner and demonstrates fcc crystallographic structure... 170 Figure 5.30: Evolution of G phase precipitates in terms of diameter (blue), number density (red)
and volume fraction (green) at 460oC in HT9 irradiated with 5 MeV Fe++ after
preimplantation with 10 appm He. ... 171 Figure 5.31: Formation of M2X precipitates in irradiated HT9 irradiated with 5 MeV Fe++. (a)-(e)
are the low angle annular dark field images of M2X, shown as light grey rods. (f)-(j)
present the corresponding high angle annular dark field images with voids as dark circles and M2X can faintly be observed as light grey plates. ... 172
xviii
Figure 5.32: Orientation of M2X within the matrix. The top view corresponds to what is imaged
in Figure 5.31. ... 173 Figure 5.33: LAADF image of formation of M2X precipitates in irradiated HT9 irradiated with 5
MeV Fe++. Note precipitates form intragranularly. ... 174 Figure 5.34: Bright field image (a) and corresponding jump ratios for Cr (b), C (c) and N (d) in
HT9 irradiated at 460oC to 550 dpa with 10 appm He preimplanted. ... 175 Figure 5.35: EDX spectrum of M2X confirming Cr2C in HT9 irradiated at 460oC to 550 dpa with
10 appm He preimplanted. ... 176 Figure 5.36: SAED patterns of M2X in HT9 irradiated at 460oC to 450 dpa with 10 appm He
preimplanted with axis tilted to a) 0° b) 27° and c) 43°. ... 177 Figure 5.37: a) HRTEM of M2X b) FFT of precipitate from red box in (a), c) nanodiffraction
revealing M2X (red) and Fe (green) matrix in HT9 irradiated at 460oC to 650 dpa with
10 appm He preimplanted. ... 178 Figure 5.38: a) BF b) HR BF and c) HR HAADF images of M2X irradiated to 650 dpa at 460oC.
Moiré fringes clearly visible and indicated misfit strain due to slight lattice mismatch, consistent with coherency. ... 179 Figure 5.39: HR HAADF image of M2X (yellow) and matrix (red). FFT show same growth
relationship < 1220 > 𝑀2𝑋//< 100 > 𝛼, demonstrated by parallel lines. ... 180 Figure 5.40: a) HR-HAADF image of HT9 irradiated at 460oC to 650 dpa. b) FFT with simulated
SAED pattern overlaid indicating consistency of observed pattern with simulation along [011] direction of matrix, c) FFT with no simulated diffraction pattern overlaid. ... 181 Figure 5.41: Evolution of M2X precipitates in terms of length (blue), width (red), thickness
(green), number density (yellow) and volume fraction (grey) in HT9 irradiated with 5 MeV Fe++ at 460oC after preimplantation of 10 appm He. ... 182 Figure 5.42: Images of representative dislocation network used for characterization of line
density in HT9 irradiated with 5 MeV Fe++ at 460oC with 10 appm He preimplanted. Some dislocations pointed out with red arrows. ... 183 Figure 5.43: High magnification images of dislocation lines/network in HT9 irradiated with 5
xix
Figure 5.44: Dislocation network evolution under 5 MeV Fe++ irradiation at 460oC in HT9. ... 185
Figure 5.45: Dislocation loop evolution with increasing damage irradiated at 460oC with 5 MeV Fe++. Some loops are marked by white circles. ... 186
Figure 5.46: Quantification of dislocation loop diameter from 130 to 650 dpa at 460oC irradiated with 5 MeV Fe++. ... 187
Figure 5.47: Quantification of dislocation loop number density from 130 to 650 dpa at 460oC irradiated with 5 MeV Fe++. ... 188
Figure 5.48: Dislocation loop line length in HT9 irradiated with 5 MeV Fe++ at 460oC from 130 to 650 dpa. ... 189
Figure 5.49: Loop (blue), network (red) dislocation line length and total line (green) length in HT9 irradiated with 5 MeV Fe++ at 460oC up to 650 dpa. ... 190
Figure 5.50: Summary of evolving microstructure with damage in HT9 irradiated with 5 MeV Fe++ at 460oC. ... 191
Figure 6.1: Main structure and sub routines in RIME model. ... 243
Figure 6.2: Effect of changing bias at 20 dpa on swelling at 460oC using Ref.2. ... 244
Figure 6.3: Effect of changing grain size at 20 dpa on swelling at 460oC using Ref.2. ... 245
Figure 6.4: Absolute value of significance of damage rate, temperature, grain size and bias. Treatment including with (Ref.2) and without unbiased G phase (Ref.2.G) are both included as a function of damage in RIME at 21 and 100 dpa. ... 246
Figure 6.5: Absolute value of significance of bias, interstitial migration energy, vacancy migration and formation energy, recombination coefficient and cascade efficiency. DD treatment (Ref.2) used with significance reported as a function of damage in RIME at 21 and 100 dpa from the start of the case run. ... 247
Figure 6.6: Comparison of cascade efficiency and dislocation loop and network bias for interstitials of 1% (solid lines), 2% (dashed lines) and 3% (dotted lines). ... 248
Figure 6.7: Measured a) void and b) loop fraction in HT9 irradiated with 5 MeV Fe++ at 460oC to 188 dpa. ... 249
Figure 6.8: Experimental void distribution (blue columns) compared with RIME void distribution input (red line) into each case. ... 250
Figure 6.9: a) Radius and b) number density of dislocation loops in HT9 irradiated with 5 MeV Fe++ from 188 to 650 dpa at 460oC. Interpolation is from experimental data. ... 251
xx
Figure 6.10: a) Radius and b) number density of G phase in HT9 irradiated with 5 MeV Fe++ from 188 to 650 dpa at 460oC. Interpolation is from experimental data... 252 Figure 6.11: a) Effective radius and b) number density of M2X-phase in HT9 irradiated with 5
MeV Fe++ from 188 to 650 dpa at 460oC. Interpolation is from experimental data. . 253 Figure 6.12: Comparison of Ref.0 treatment (𝑧𝑖𝑛𝑒𝑡=1.01) with experimental data in terms of a)
network sink strength and b) void diameter, number density and swelling. ... 254 Figure 6.13: Comparison of Ref.1 treatment (𝑧𝑖𝑙𝑜𝑜𝑝 = 𝑧𝑖𝑛𝑒𝑡=1.01) with experimental data in
terms of a) network and loop sink strength and b) void diameter, number density and swelling. ... 255 Figure 6.14: Comparison of Ref.2 treatment (𝑧𝑖𝑙𝑜𝑜𝑝 = 𝑧𝑖𝑛𝑒𝑡=1.01) with experimental data in
terms of a) loop and network sink strength b) loop diameter and number density and c) void diameter, number density and swelling... 256 Figure 7.1: Schematic of relationships between precipitates, dislocations and voids explored in
depth using RIME. ... 304 Figure 7.2: Comparison of Ref.0 (solid) and Ref.0.N (dashed) treatments (zinet=1.01) with
experimental data in terms of a) void and network sink strength and b) void swelling. ... 305 Figure 7.3: Comparison of Ref.0 (solid) and Ref.1 (dashed) treatments (zilp = zinet=1.01) with
experimental data in terms of a) network, loop and total dislocation sink strength and b) void swelling. ... 306 Figure 7.4: Comparison of Ref.1 (solid) and Ref.2 (dashed) treatments (zilp = zinet=1.01) in
terms of a) void, network, loop and total dislocation sink strength and b) void
swelling. ... 307 Figure 7.5: Comparison of net vacancies absorbed at voids in Ref.1 (solid) and Ref.2 (dashed).
Total dislocation sink strength is included in red. Discontinuity in Ref.1 case at 550 dpa is due to the manual increase in network sink strength which decreases dici and
dvcv. ... 308 Figure 7.6: Comparison of swelling response to initial dislocation network density varied from
xxi
Figure 7.7: Comparison of experimentally input loop and network treatment (Ref.1: zilp =
zinet=1.01) with experimental data in terms of a) network/loop sink strength and b) void diameter, number density and swelling... 310 Figure 7.8: Comparison of 1% (solid lines: Ref.1) and 0.7% biased (dashed lines: Ref.1.1.007)
with experimental data in terms of void diameter, number density and swelling... 311 Figure 7.9: Comparison of DD treatment (Ref.2: zilp = zinet=1.01) with experimental data in
terms of a) loop and network sink strength b) loop diameter and number density and c) void diameter, number density and swelling... 312 Figure 7.10: Effect of G phase on void a) sink strength and b) swelling when included in
experimentally determined levels as an unbiased sink. Dislocations are treated as experimentally input network and loops with (Ref.1.G: dashed lines) and without G phase (Ref.1: solid) with zilp = zinet=1.01. ... 313 Figure 7.11: Comparison of experimentally input loop and network treatment with G phase
included (Ref.1G: zilp = zinet=1.01) with experimental data in terms of a) G phase, loop and network sink strength and b) void diameter, number density and swelling. 314 Figure 7.12: Comparison of evolution of void and M2X a) diameter and length and b) number
density and volume fraction/swelling from 188 to 650 dpa. All irradiations performed with 5 MeV Fe++ at 460oC with 10 appm He preimplanted. Lines guide the eye... 315 Figure 7.13: Comparison of swelling behavior with increasing 𝐸𝑏𝑣, 𝑡𝑟 using Ref.1.MR with
zilp = zinet=1.01. ... 316 Figure 7.14: Comparison of swelling with M2X treated as either variable bias (red) or
recombination centers (blue) with experimentally input network and loop with
zilp=zinet =1.01. ... 317 Figure 7.15: Comparison of Ref.1.MV (𝑧𝑖𝑙𝑝=𝑧𝑖𝑛𝑒𝑡=1.01) with experimental data in terms of a)
M2X, loop and network sink strength and b) void diameter, number density and
swelling. All irradiations performed with 5 MeV Fe++ at 460oC with 10 appm He preimplanted. ... 318 Figure 7.16: Effect of G phase on network and loop a) sink strength and b) loop number density
xxii
Dynamic dislocation treatment used both with (Ref.2.G: dashed lines) and without G phase (Ref.2: solid lines) with zilp = zinet=1.01. ... 319 Figure 7.17: Comparison of Ref.2.G (zilp = zinet=1.01) with experimental data in terms of a) G
phase, loop and network sink strength and b) dislocation loop diameter and number density. ... 320 Figure 7.18: Loop and M2X diameter/length compared with number density as a function of
damage. All irradiations performed with 5 MeV Fe++ at 460oC with 10 appm He preimplanted. Lines guide the eye. ... 321 Figure 7.19: Effect of M2X phase on network and loop a) sink strength and b) loop number
density and diameter when included in experimentally determined levels as a variably biased sink. Dynamic dislocation treatment used with (Ref.2.MV: dashed lines) and without M2X phase (Ref.2: solid lines) with zilp = zinet=1.01. ... 322
Figure 7.20: Effect of changing number of interstitial cluster groups from 60 (solid) to 160 (dashed) with DD treatment (Ref.2.MV: zilp=zinet =1.01). M2X treatment as variable
bias sink was used. ... 323 Figure 7.21: Comparison of Ref.2.MV (𝑧𝑖𝑙𝑝=𝑧𝑖𝑛𝑒𝑡=1.01) with experimental data in terms of a)
M2X, loop and network sink strength and b) dislocation loop diameter and number
density. ... 324 Figure 7.22: Accounting for carbon in HT9 in the as-received condition and at 450 dpa. ... 325 Figure 7.23: Comparison of Ref.2 with Ref.2.C with 0 to 855 appm for a) network and loop sink
strength and b) swelling. Case run with 3940 appm terminated at 400 dpa. 0 and 1 appm lines are indistinguishable in b). ... 326 Figure 7.24: Comparison of Ref.1 (blue), Ref.1.C with 100 appm in solution (red) and 100 appm
in solution removed stepwise from 188 to 450 dpa (green) representing the
precipitation of M2X. ... 327
Figure 7.25: Comparison of Ref.1.C (blue) and Ref.2.C (red) with 100 appm of carbon in
solution removed stepwise from 188 to 450 dpa representing the precipitation of M2X.
... 328 Figure 7.26: Comparison of void swelling with M2X plus 100 appm of carbon in solution
xxiii
and Ref.1 (blue). All M2X treated as variably biased with experimentally input
dislocations. ... 329 Figure 7.27: Comparison of DD treatment (Ref.2.C: zilp = zinet=1.01) with experimental data
in terms of a) loop and network sink strength b) loop diameter and number density and c) void diameter, number density and swelling including 100 appm of carbon in solution removed stepwise from 188 to 450 dpa. ... 330 Figure 7.28: Comparison of experimentally input loop and network treatment (Ref.1.G.MV.C:
zilp = zinet=1.01) with experimental data in terms of a) network, loop, G phase and M2X sink strength and b) void diameter, number density and swelling including M2X
(variable biased), G phase and stepwise removal of 100 appm of carbon in solution from 188 to 450 dpa. ... 331 Figure 7.29: Comparison of DD treatment (Ref.2.G.MV.C: zilp = zinet=1.01) with
experimental data in terms of a) network, loop, G phase and M2X sink strength b) loop
diameter and number density and c) void diameter, number density and swelling including M2X (variable biased), G phase and stepwise removal of 100 appm of
carbon in solution from 188 to 450 dpa. ... 332 Figure 7.30: Comparison of swelling curves with various microstructure treatments. All cases
run with experimentally input dislocations (Ref.1: zilp = zinet=1.01). ... 333 Figure 7.31: Comparison of experimentally input loop and network treatment with lower bias
(Ref.1.1.007.G.MV.C: zilp = zinet=1.01) with experimental data in terms of a) network, loop, G phase and M2X sink strength and b) void diameter, number density
and swelling including M2X (variable biased), G phase and 100 appm C in solution
removed stepwise from 188 to 450 dpa. ... 334 Figure 7.32: Comparison between swelling rate before and after 450 dpa (Ref.1.G.MV.C: zilp =
zinet=1.01). Dashed lines guide the eye to approximate swelling rates calculated from RIME. ... 335 Figure 7.33: Comparison of instantaneous swelling rate calculated from experiment using
parabolic regression before and after 450 dpa using a) uncorrected swelling and b) fixed depth method [85]. ... 336
xxiv
Figure A. 1: Temperature histograms for HT9 (heat 84425: ACO3) irradiated at 400oC: 250 dpa; 440oC: 25, 140, 188; 460oC: 188 dpa and 480oC:188 dpa ... 344 Figure A. 2: Temperature histograms for HT9 (heat 84425: ACO3) irradiated at 440oC: 50 dpa
and 460oC: 75, 130, 250, 350, 375 dpa. ... 345 Figure A. 3: Temperature histograms for HT9 (heat 84425: ACO3) irradiated at 460oC: 450, 550,
650 dpa. ... 346
Figure B. 1: HT9 (ACO3) irradiated with 5 MeV Fe++ at 440oC up to 140 dpa with 10 appm He
preimplanted. ... 348 Figure B. 2: HT9 (ACO3) irradiated with 5 MeV Fe++ at 440oC up to 25 dpa with 10 appm He
preimplanted. ... 349 Figure B. 4: HT9 (ACO3) irradiated with 5 MeV Fe++ at 440oC up to 188 dpa with 10 appm He
preimplanted. ... 350 Figure B. 5: HT9 (ACO3) irradiated with 5 MeV Fe++ at 480oC up to 188 dpa with 10 appm He
preimplanted. ... 351 Figure B. 6: HT9 (ACO3) irradiated with 5 MeV Fe++ at 400oC up to 250 dpa with 0 appm He
preimplanted. ... 352 Figure B. 7: HT9 (ACO3) irradiated with 5 MeV Fe++ at 460oC up to 188 dpa with 10 appm He
preimplanted. ... 353 Figure B. 8: HT9 (ACO3) irradiated with 5 MeV Fe++ at 440oC up to 50 dpa with 10 appm He
preimplanted. ... 354 Figure B. 9: HT9 (ACO3) irradiated with 5 MeV Fe++ at 460oC up to 375 dpa with 10 appm He
preimplanted. ... 355 Figure B. 10: HT9 (ACO3) irradiated with 5 MeV Fe++ at 460oC up to 130 dpa with 10 appm He preimplanted. ... 356 Figure B. 11: HT9 (ACO3) irradiated with 5 MeV Fe++ at 460oC up to 75 dpa with 10 appm He
preimplanted. ... 357 Figure B. 12: HT9 (ACO3) irradiated with 5 MeV Fe++ at 460oC up to 250 dpa with 10 appm He
preimplanted. ... 358 Figure B. 13: HT9 (ACO3) irradiated with 5 MeV Fe++ at 460oC up to 350 dpa with 10 appm He preimplanted. ... 359
xxv
Figure B. 14: HT9 (ACO3) irradiated with 5 MeV Fe++ at 460oC up to 450 dpa with 10 appm He preimplanted. ... 360 Figure B. 15: HT9 (ACO3) irradiated with 5 MeV Fe++ at 460oC up to 550 dpa with 10 appm He preimplanted. ... 361 Figure B. 16: HT9 (ACO3) irradiated with 5 MeV Fe++ at 460oC up to 650 dpa with 10 appm He
preimplanted. ... 362
Figure C. 1: Void diameter, number density and swelling depth profiles as well as void distribution in the 500 to 700 nm depth region of HT9 irradiated with 5 MeV Fe++ (ACO3) at 440oC, to 140 dpa with 10 appm He. ... 364 Figure C. 3: Void diameter, number density and swelling depth profiles as well as void
distribution in the 500 to 700 nm depth region of HT9 irradiated with 5 MeV Fe++ (ACO3) at 440oC, to 25 dpa with 10 appm He. ... 365 Figure C. 4: Void diameter, number density and swelling depth profiles as well as void
distribution in the 500 to 700 nm depth region of HT9 irradiated with 5 MeV Fe++ (ACO3) at 440oC, to 188 dpa with 10 appm He. ... 366 Figure C. 5: Void diameter, number density and swelling depth profiles as well as void
distribution in the 500 to 700 nm depth region of HT9 irradiated with 5 MeV Fe++ (ACO3) at 480oC, to 188 dpa with 10 appm He. ... 367 Figure C. 6: Void diameter, number density and swelling depth profiles as well as void
distribution in the 500 to 700 nm depth region of HT9 irradiated with 5 MeV Fe++ (ACO3) at 400oC, to 250 dpa with 10 appm He. ... 368 Figure C. 7: Void diameter, number density and swelling depth profiles as well as void
distribution in the 500 to 700 nm depth region of HT9 irradiated with 5 MeV Fe++ (ACO3) at 460oC, to 188 dpa with 10 appm He. ... 369
Figure C. 8: Void diameter, number density and swelling depth profiles as well as void distribution in the 500 to 700 nm depth region of HT9 irradiated with 5 MeV Fe++ (ACO3) at 440oC, to 50 dpa with 10 appm He. ... 370
Figure C. 9: Void diameter, number density and swelling depth profiles as well as void distribution in the 500 to 700 nm depth region of HT9 irradiated with 5 MeV Fe++ (ACO3) at 460oC, to 375 dpa with 10 appm He. ... 371
xxvi
Figure C. 10: Void diameter, number density and swelling depth profiles as well as void distribution in the 500 to 700 nm depth region of HT9 irradiated with 5 MeV Fe++ (ACO3) at 460oC, to 130 dpa with 10 appm He. ... 372 Figure C. 11: Void diameter, number density and swelling depth profiles as well as void
distribution in the 500 to 700 nm depth region of HT9 irradiated with 5 MeV Fe++
(ACO3) at 460oC, to 75 dpa with 10 appm He. ... 373 Figure C. 12: Void diameter, number density and swelling depth profiles as well as void
distribution in the 500 to 700 nm depth region of HT9 irradiated with 5 MeV Fe++
(ACO3) at 460oC, to 250 dpa with 10 appm He. ... 374 Figure C. 13 Void diameter, number density and swelling depth profiles as well as void
distribution in the 500 to 700 nm depth region of HT9 irradiated with 5 MeV Fe++ (ACO3) at 460oC, to 350 dpa with 10 appm He. ... 375 Figure C. 14: Void diameter, number density and swelling depth profiles as well as void
distribution in the 500 to 700 nm depth region of HT9 irradiated with 5 MeV Fe++ (ACO3) at 460oC, to 450 dpa with 10 appm He. ... 376 Figure C. 15: Void diameter, number density and swelling depth profiles as well as void
distribution in the 500 to 700 nm depth region of HT9 irradiated with 5 MeV Fe++ (ACO3) at 460oC, to 550 dpa with 10 appm He. ... 377 Figure C. 16: Void diameter, number density and swelling depth profiles as well as void
distribution in the 500 to 700 nm depth region of HT9 irradiated with 5 MeV Fe++ (ACO3) at 460oC, to 650 dpa with 10 appm He. ... 378
xxvii
LIST OF APPENDICES
Appendix A - Temperature Histograms ... 343 Appendix B - Void Images ... 347 Appendix C - Void Depth Profiles and Distributions ... 363
xxviii
ABSTRACT……...
THE CO-EVOLUTION OF MICROSTRUCTURE FEATURES IN SELF-ION IRRADIATED HT9 AT VERY HIGH DAMAGE LEVELS
by Elizabeth Margaret Getto
Chair: Gary S. Was
The objective of this study was to understand the co-evolution of microstructure features in self-ion irradiated HT9 at very high damage levels.HT9 (heat 84425) was pre-implanted with 10 atom parts per million helium and then irradiated with 5 MeV Fe++ in the temperature range of 440-480oC to 188 dpa. A damage dependence study from 75 to 650 dpa was performed at the peak
swelling temperature of 460oC. The swelling, dislocation and precipitate evolution was determined using Analytic Electron Microscopes in both Conventional Transmission electron microscopy (CTEM) and Scanning Transmission Electron Microscopy (STEM) modes. Void swelling reached a nominally linear rate of 0.03%/dpa from 188 to 650 dpa at 460oC. G phase precipitates were observed by 75 dpa and grew linearly up to 650 dpa. M2X was observed by 250 dpa and peaked
in volume fraction at 450 dpa. Dislocation loop evolution was observed up to 650 dpa including a step change in diameter between 375 and 450 dpa; which correlated with nucleation and growth of M2X.
xxix
The experimental results were interpreted using a rate theory model, the Radiation Induced Microstructure Evolution (RIME), in the damage range from 188 to 650 dpa. A simple system of voids and dislocations was modeled in which the dislocations measured from experiment were used as input, or the dislocations were allowed to evolve dynamically, resulting in swelling that was overestimated by 63% relative to that observed experimentally. G phase had limited effect on the void or dislocation behavior. The behavior of M2X within the microstructure was characterized
as a direct effect as a coherent sink, and as an indirect effect in consuming carbon from the matrix, which had the largest impact on both void and dislocation behavior. A slowly monotonically increasing swelling rate was observed both experimentally and computationally, with swelling rates of ~0.025%/dpa and ~0.036%/dpa before and after 450 dpa. The agreement in void behavior between experiment and model when all effects (loops, network, G phase, M2X formation and
growth, and removal of carbon) are accounted for demonstrates the importance of characterizing the evolution of the full microstructure over a large dpa range.
1
CHAPTER 1 INTRODUCTION
The rapidly growing world population has increased the demand for natural resources including energy. Growing concerns about climate change have fueled a return to interest in nuclear power as a significant carbon-free base-load energy source. However, uncertainty about nuclear waste policy has led to increased focus on alternative reactor concepts that minimize waste. Generation (Gen) IV reactors are key in meeting the rapidly growing demand for energy now and in the future. The concerns about residual nuclear waste have thus created a demand for greater fuel utilization via increased burnup. Higher burnup will push the limits of reactor structural materials to damage levels not yet reached in the current light water reactor (LWR) fleet or fast reactors used in the past. Thus, understanding the behavior of core and structural materials under irradiation is paramount to the success of new reactor concepts including TerraPower’s Traveling Wave Reactor (TWR) concept.
The main differentiator of the TWR from “traditional” breeder reactors is its unique core
[1]. Fertile fuel assemblies consisting of depleted uranium (for breeding) and low enriched uranium fuel assemblies will be arranged within the core to enable both burning and breeding of fuel. What presents a unique materials challenge is that the core operates without refueling. Fuel shuffling is utilized to create either a traveling wave from the inside of the core to the outside or alternatively, a “standing wave” of breeding/burning that distinguishes this reactor design and
2
of the core to the outer rim, without reload, a significant deviation from traditional LWR operation leading to a much higher burnup and therefore more radiation damage to core materials. Damage levels are expected to reach at least 200 displacements per atom (dpa) and above in sodium fast reactors [2] and 600 dpa in TWRs after 60 years in operation [1,2], which presents a unique material challenge as this requires highly radiation tolerant materials. Furthermore, there is no existing database at such high damage levels for any type of steel under neutron irradiation. Finally, the push to higher burnup and damage is not unique to TWRs, but also to other Gen IV reactor designs including alternative sodium fast reactor concepts.
Ferritic-martensitic (FM) steel alloys are leading candidates for structural and cladding components in Gen IV designs. FM steels are candidates for fast reactors because of their compatibility with sodium, superior resistance to radiation damage such as void swelling and excellent thermal conductivity and thermal expansion coefficient [3]. It was first determined in the 1970s that austenitic stainless steels, given their susceptibility to both void swelling and creep, were unsuitable for both breeder-type reactors and fusion devices expected to reach very high damage levels. FM alloys, previously developed for applications in high temperature coal plants, have become an alternative to stainless steels. Initial testing at the Fast Flux Test Facility (FFTF), a sodium fast reactor in Hanford, Washington, showed promise in terms of increased radiation tolerance, especially in terms of void swelling resistance, and continued to motivate the transition from advanced stainless steels such as D9 to FM alloys.
FM steels are body centered cubic (bcc) iron alloys with major additions of chromium, typically with Cr concentrations of 7-15 wt% with most commercially available alloys having either 9 or 12 Cr wt% [3]. They have additions of other minor alloying elements, such as W, V, Mn, Ta, Ti and Mo, to add desirable material properties such as strength or ductility. FM alloys
3
are uniquely identified by their complex microstructure including laths, subgrains and secondary phases that form during heat treatment of the alloy or under irradiation, which typically leads to a much higher sink density than conventional austenitic stainless steels.
Under high damage irradiation, a number of microstructure features form, most of which are detrimental to material integrity and safety. Of primary interest to this thesis, formation of voids causes dimensional instability. In addition, formation and evolution of secondary phases and dislocation loops under irradiation can lead to increased hardening and embrittlement of the alloy.
Void swelling has been studied extensively in other alloys such as austenitic stainless steels, but very little systematic experimental work has been performed on void swelling in FM alloys due, in part, to the high degree of swelling resistance. Very few voids form at the relatively low damage levels examined. However, some limited results for neutron (up to 200 dpa) and ion irradiation (up to 600 dpa) do exist. Neutron irradiations performed in FFTF up to 200 dpa indicates that swelling remains below 3.2% in the temperature range 400-460oC [4–10]. However, the scarcity of data makes it difficult to determine whether or not swelling is in the so-called steady state swelling regime, which is characterized by void growth-dominated swelling and a linear or near linear swelling rate. If the highest neutron damage (165-200 dpa) irradiations are in the growth-dominated steady state swelling regime, then the linear swelling rate is expected to be ~0.01-0.02%/dpa [5,7,10,11].
More recently, ion irradiation has proven effective as a surrogate for neutron irradiations [2,12,13] resulting in more systematic studies of temperature and damage, but has yielded conflicting results. Smidt et al. [14] found swelling of up to 4.7% at 450oC and 250 dpa in HT9. Assuming swelling is linear by 250 dpa, the swelling rate is ~0.02%/dpa. In contrast, Toloczko et
4
al. [15] in irradiations performed with 1.8 MeV Cr3+ at 450oC determined a final swelling rate of 0.2%/dpa at damage levels of 400 dpa and above.
In addition to uncertainty of the high damage void swelling behavior, secondary phases have not been examined at commensurately high damage levels. The main precipitates observed in reactor or under ion irradiation in this temperature and damage regime are G phase, M2X and 𝛼′ [3]. Finally, there exists no systematic study of dislocation formation without stress beyond 10
dpa, but recent results from Gupta et al. [16] and Jiao et al. [17] suggest that dislocation loop diameter saturates by 10 to 20 dpa, well below the void growth-dominated swelling regime.
The limited and somewhat contradictory experimental results from both neutron and ion irradiations highlight the need for a systematic study of the evolution of void swelling and other microstructure features to a very high damage level in FM alloys. In particular, and especially relevant to this thesis, is that the so called terminal swelling rate of FM alloys is a subject of some debate. Consequently, there are no studies on the effect of other irradiation-induced features such as secondary phases and dislocations on voids at this high damage and high swelling rate.
The objective of this thesis is to understand the co-evolution of microstructure features at very high damage in self-ion irradiated HT9. This will be accomplished with a combination of ion irradiation experiments followed by post irradiation microstructure characterization and computational modeling. Chapter 2 will provide extended background from the literature relevant to this thesis. Chapter 3 will present the detailed objective and associated approach. Chapter 4 presents the experimental details and methodology utilized in ion experiments. Results from ion irradiation experiments and post-irradiation characterization will be presented in Chapter 5. Chapter 6 will present the modeling portion of the thesis, including additional background relevant to the computational model. Chapter 7 will present a discussion and analysis of the combined
5
experimental and modeling results. Chapter 8 will present final conclusions and finally, Chapter 9 will suggest possible future work.
1
CHAPTER 2 BACKGROUND
Cladding and structural components will be subject to a high fluence of fast neutrons in Generation IV reactors, especially in TerraPower’s traveling wave reactor concept. Although there is a large database of knowledge of radiation effects on materials under light water reactor conditions, a limited amount of these results can be applied to next generation reactors since they are at relatively low damage (<100 dpa) levels. Nevertheless, significant materials degradation has occurred at these damage levels via radiation-induced segregation (RIS), nucleation and growth of dislocation loops, secondary phase formation causing hardening and embrittlement as well as dimensional changes such as creep and void swelling.
FM alloys are being considered as alternatives to stainless steels used in previous fast reactor designs because of improved radiation tolerance. However, the existing dataset is small and little to nothing is known about void swelling in the very high damage regime in these alloys, due to their high degree of swelling resistance and the low damage levels achievable in test reactors. Additionally, the coupling of temperature and flux makes systematic damage or temperature studies challenging.
This chapter will provide background necessary to place results of this thesis in context within the existing literature. First, void swelling will be introduced and mechanisms described in
2
a theoretical framework. Then, the existing experimental measurements of void swelling as well as other irradiation-induced phenomena that may influence void swelling will be presented.
2.1 Mechanisms of Void Swelling
Swelling is caused by the formation and growth of cavities under irradiation. The supersaturation of vacancies due to irradiation and biased sinks drives void nucleation and growth by vacancy agglomeration, which in turn causes bulk dimensional change. Although it is well understood in austenitic alloys that voids undergo a nucleation period followed by linear or “steady state” swelling rate of ~1%/dpa [8,18], there is little evidence that ferritic-martensitic alloys exhibit
linear swelling behavior at any levels approaching 1%/dpa. Furthermore, the influence of other irradiation features on void swelling has not been studied systematically. An introduction to void swelling followed by a discussion of ferritic-martensitic alloys will be presented. The current void swelling results under neutron and ion irradiation will be reviewed.
The term cavity is inclusive of both bubbles, which by definition require helium to stabilize, whereas voids do not require helium to be stabilized. In other words, all voids are cavities but all cavities may not be voids. At large sizes (>20 nm), it is a safe assumption that all cavities are voids. Thus, for the swelling range examined in this study, it is safe to assume all cavities are in fact voids and for preference will be given to this nomenclature from here on.
2.1.1Introduction to Void Swelling
Irradiation-induced void swelling in susceptible metals and alloys evolves through three different void behavior regions shown in Figure 2.1 [19]. In the nucleation regime, cavity embryos are nucleated then stabilized to form bubbles or small voids, which are resolvable by transmission electron miscopy (TEM) or scanning transmission electron microscopy (STEM) at ~1 to 2 nm.
3
Swelling increase in this regime is dominated by the nucleation of new stable bubbles or voids. There are two nucleation pathways for void formation under irradiation [18,20,21]. The first pathway is agglomeration of small vacancies or vacancy clusters that then reach a critical size; which is a mechanism that is dependent on stochastic fluctuations in the damaged microstructure. The second pathway is accumulation of small gas-stabilized bubbles (typically helium) until they reach a critical size beyond which gas accumulation is not needed for growth and they convert from bubbles to voids. Helium decreases the critical size necessary for a stable cavity by reducing the free energy barrier.
As these void embryos nucleate and stabilize, they start to accumulate vacancies and grow in size. At this point, the void distribution is centered at low diameters (<10 nm) and has a small full width half maximum, as growth is not yet the dominant process. In the transition region, there is simultaneous nucleation of new stable embryos while existing voids grow by vacancy agglomeration. Thus the void size distribution expands and the mean void diameter increases as stable voids grow. The increase in swelling is due to both nucleation of new voids as well as growth of already nucleated voids. After a period of time depending on the swelling resistance of the alloy in question, growth dominates and the swelling reaches the growth-dominated regime, which continues to very high damage levels and is characterized by a near constant swelling rate [19]. This has also been referred to as steady state swelling due to linear final swelling value observed in reactor for austenitic and pure alloys [8,22–24]. An alternative theory suggests that swelling may even saturate at sufficiently high swelling values, but this has only been shown to happen in AISI 316 at 260% swelling at 600 dpa [25]. Although void swelling is classified into these three regimes, the transition is not distinct as the regimes overlap in time.
4
Void evolution is well documented in both FCC austenitic alloys [8,22,25] and pure metals [3,23,26], which are relatively susceptible to void swelling. The final linear swelling rate appears to be independent of heat treatment and temperature for austenitics [8,27] within the temperature region where metals/alloys are susceptible to void swelling (𝑇 ≈ 0.3𝑇𝑚− 0.5𝑇𝑚) [20]. Although void swelling is well understood in austenitic alloy, there is limited data, particularly at high damage level, for ferritic-martensitic (FM) alloys, which are candidate materials for Gen IV fast reactors. The lack of swelling data in FM alloys is due to a combination of the swelling resistance of FM alloys, as well as their relatively limited use in reactors to date [4,6–8].
2.2 Ferritic-Martensitic Alloys
High chromium steels refer to those that contain 7-12% chromium. The first high chromium steel was developed in 1912 for steam turbine blades in Germany. British scientists then discovered that martensitic steels were rust resistant during unrelated experiments for gun barrel applications. Initial commercial applications included knives, tableware, razors and heat resistant bearings and tools [3]. High chromium steels continued to be developed for applications in chemical plants, aerospace technologies, electrical plants and gas turbine engines throughout the rest of the 20th century. There was renewed interest in high chromium FM steels during the fifties and sixties due to a large push to improve efficiencies of coal power plants [28]. Increased efficiency was accomplished by increasing the temperature and pressure of the steam, leading to a need for supercritical boilers, designed to operate to ever increasing temperatures and pressures. As a result, steels needed to be developed that operated with low thermal fatigue, high thermal conductivity and low thermal expansion. Austenitic steels, previously used in coal plants, did not possess sufficient thermal properties to operate safely and effectively under the new required operating conditions [28]. Interest continued to grow throughout the seventies and early eighties,
5
due to the energy crisis of the seventies and interest in first fast breeder then fusion applications [3].
It became apparent that austenitic steels were susceptible to both irradiation-induced creep and void swelling so scientists turned to the high chromium steels that were being utilized in fossil fuel applications. In 1974, scientists worldwide began an effort to optimize breeder reactors with a new type of steel, instead of the previously utilized AISI 316. Two FM alloys that were under consideration were HT9 and T91. HT9 was used in many fuel tests as primary core materials including duct and cladding as well as pressurized tubes used to study creep at the Fast Flux Test Facility (FFTF) in Hanford, Washington [4–7,11,29].
FM steels, in general, possess a number of useful properties [3]. These properties include high thermal conductivity, low thermal expansion and resistance to thermal fatigue; all of which are necessary for usage in high temperature fossil fuel plants as well as in high or very high temperature reactors. They also exhibit sufficient strength to be of practical use in power plants. 12Cr steel, in particular, exhibits excellent oxidation resistance. They show particular resistance to irradiation-induced creep and void swelling.
There are several limitations with FM steels. Body-centered-cubic (BCC) structures exhibit a ductile-brittle transition temperature (DBTT) that increases significantly with radiation [3]. Furthermore, radiation embrittlement and irradiation-induced creep will still be a consideration for FM steels. Finally, welding is much more difficult than for conventional austenitic stainless steels.
2.2.1Physical Metallurgy
Processing of FM alloys involves three heat treatments: austenization, transformation to martensitic phase and tempering. The phase diagram relevant for FM alloy formation is given in
6
Figure 2.2 [3]. Typically, austenization occurs when the alloy is heated up to ~800-1450°C for 9-12 wt% Cr alloys. The austenizing temperature can be affected by the addition of austenite (γ) stabilizers, which typically lower the temperature required for complete austenization of the steel, but at the risk of the formation of MC carbides if C, the most commonly used and inexpensive austenite stabilizer is used. Thus, a higher temperature is desirable as it has the added effect of dissolving MC carbides resulting in coarser prior austenite grain (PAG) sizes and complete transformation to austenite before cooling. Austenization temperature for HT9 is typically around 1050-1100oC. Following cooling, all or most of the phase transforms to martensite, unless austenite or ferrite stabilizers such as nickel or chromium are added. In general, HT9 may consist of all three phases: austenite, martensite and δ ferrite, but an effort is made to minimize both retained austenite and ferrite. Initially, the austenite to martensite transformation yields a very brittle microstructure prone to brittle fracture due to the high dislocation density.
Martensite is formed in thick sections known as laths, due to inhibition of pearlite transformation and absence of bainite. A continuous cooling transformation (CCT) diagram is shown in Figure 2.3. Lathes tend to be low in carbon and are usually around 0.5-1 µm by 5µm in length [30]. Upon cooling, the austenite phase normally transforms to martensite, but when the martensite start temperature is close to room temperature austenite is retained. In an ideal microstructure, PAG has packets of martensite laths that are parallel. Laths within a single pack occupy the same habit plane, have the same orientation and are often very closely aligned in terms of crystallography.
The final step, tempering, is required to improve toughness by refining the microstructure. Tempering causes formation of small precipitates such as M23C6, which improve toughness and
7
Typically, tempering is performed around 760-850°C for conventional FM alloys and 870-960°C for reduced activation steels [3]. The effect of tempering temperature is as follows:
<350oC: M
3C precipitates form and grow into a dendrite morphology
450-500oC: Fine needles of M2X precipitate nucleate on dislocations causing retardation
of softening
500-550oC: M7C3 and M2X phases coarsen and decrease hardness
>550oC: Cr-rich M23C6precitiates nucleate on the martensite laths and PAG boundaries >650oC: M23C6 precipitates coarsen, reducing dislocation density
>750oC: sub-cell within laths grow into equi-axed grains and continued growth of M 23C6
[3]
During tempering, the dislocation networks rearrange into a lower energy configuration with the lath forming small subgrains. Dislocation motion and rearrangement is caused by thermally-activated dislocation climb and glide and results in small grain orientation angles. The martensitic phase has lathes with high dislocation density, even after tempering and formation of subgrains. The resulting dislocation network density is on the order 1014-1015 m-2 [3,31]. A schematic and typical microstructure is presented in Figure 2.4 [3,32].
Finally, tempering also results in precipitation of carbon out of the matrix, which then precipitate as carbides on the PAGB (prior austenite grain boundaries). They preferentially nucleate on PAGBs rather than lath or subgrain boundaries due to the increased diffusion rate along high angle boundaries [30,32].
8
Although there is limited data at high (>100 dpa) or very high damage (>200 dpa) for void swelling in FM alloys, there exists a non-trivial dataset at lower damage levels that may approach the high damage/growth-dominated swelling regime. The following is a summary of both in-reactor (Section 2.3.1) and ion (Section 2.3.2) irradiations. A discussion of irradiation-induced defect partioning and its relation to void swelling is also included.
2.3.1Void Swelling under Neutron Irradiation
Sencer et al. performed a study using neutron-irradiation at the Fast Flux Test Facility (FFTF) on HT9 [9,10]. A duct was irradiated under a variety of conditions at a temperature of 443°C up to 155 dpa. Swelling was calculated via TEM measurement of the voids and was 0.3% on average. However, it is unclear whether void growth-dominated swelling was reached or if the swelling was in the transition regime since average void diameter was ~30 nm. If the swelling was transient in nature, it would be expected that the swelling could increase at a faster rate at higher damage levels. Assuming linear swelling, the swelling rate could be as low as 0.002%/dpa. However, the results of this study do not provide enough data to support a prediction for swelling amount or rate, especially given the likelihood that the swelling is still exhibiting transient-type behavior. It is worth mentioning that this is the same heat (84425) as was examined in this thesis.
Gelles [7] performed microstructure examination of commercial alloys (HT9 and T91) irradiated at FFTF up to approximately 200 dpa. A single heat of HT9 (9607R2) with two different heat treatments was examined: RFFL (Heat 9607R2, 1000oC/20 h+1100oC/5 min+700oC/2 h) and
RHFL (Heat 9607R2, 1050oC/5 min+760oC/0.5 h) and compared to a third heat/heat treatment of T91 designated as PTFL (Heat 30176, 1040oC/1h+760oC/1 h). Overall, the T91 (PTFL) swelled the most when measured via the density change method with 1.76% average swelling. Compared to the RHFL heat treatment of HT9, which swelled 1.02% and the RFFL heat treatment of HT9
9
that swelled by only 0.09%. This result indicates that heat treatment can be at least as important as alloy composition in terms of swelling resistance. Additional evidence is that the HT9-RHFL and T91-PTFL heat treatments, which swelled the most, also had the most similar heat treatments, with shorter tempering and austenization times. However, swelling in any of the 3 alloys/heats/heat treatments examined likely had not reached the growth-dominated swelling regime, so this was likely a measurement of the resistance to void nucleation rather than an examination of the growth regime. The observed void structures were consistent with expected void structures in martensitic steels; i.e. void arrays between lath boundaries and void denuded zones on and adjacent to boundaries. The HT9 microstructure had blockier carbide precipitation on boundaries and lower density of larger voids when compared to T91. Swelling was also found to be independent of Burgers vector distribution.
Toloczko and Garner [4,6] examined irradiated HT9 from the FFTF facility to examine creep and swelling behavior. Swelling behavior was examined at damage levels up to 165 dpa and temperatures in the range 384-427ºC. Swelling remained under 1% for all HT9 heats up to 165 dpa at 400ºC, without stress. Maximum swelling rate appeared to be ~0.01%/dpa. A comparison of incremental swelling with swelling rate is shown in Figure 2.5. Heat treatment as well as heat-to-heat variation are major factors in swelling and were found to cause orders of magnitude changes in swelling rate. Although the samples were nominally the same composition and heat treatment, the swelling variance was attributed to differences in production variables, which were not characterized by the authors.
Toloczko et al. [5] also examined HT9 at a damage level up to 208 dpa at ~400oC in FFTF. Swelling reached up to ~1% swelling at 208 dpa in the absence of a hoop stress. Assuming linear swelling, the swelling rate again was found to be less than ~0.01%/dpa. Swelling measured from
![Figure 2.1: Expected swelling behavior as a function of damage. Adapted from [19].](https://thumb-us.123doks.com/thumbv2/123dok_us/1410525.2688774/64.918.192.672.109.482/figure-expected-swelling-behavior-function-damage-adapted.webp)

![Figure 2.6: Swelling in Fe-Cr alloys as a function of damage [33].](https://thumb-us.123doks.com/thumbv2/123dok_us/1410525.2688774/69.918.276.669.120.525/figure-swelling-fe-cr-alloys-function-damage.webp)
![Figure 2.7: Adjustment of damage levels in EBR-II results by Garner et al. [8] to data collected by Gelles [33].](https://thumb-us.123doks.com/thumbv2/123dok_us/1410525.2688774/70.918.140.751.129.450/figure-adjustment-damage-levels-results-garner-collected-gelles.webp)

![Figure 2.15: A summary of dislocation loop results as a function of temperature in neutron and ion irradiated HT9 [7,35]](https://thumb-us.123doks.com/thumbv2/123dok_us/1410525.2688774/78.918.133.855.114.551/figure-summary-dislocation-results-function-temperature-neutron-irradiated.webp)
![Figure 2.16: HT9 irradiated to a) 4 dpa at 505 o C b) 28 dpa at 384 o C c) 155 dpa at 443 o C [10]](https://thumb-us.123doks.com/thumbv2/123dok_us/1410525.2688774/79.918.119.803.109.329/figure-ht-irradiated-dpa-c-dpa-c-dpa.webp)
![Figure 2.17: Formation of rod-like precipitates in 13Cr-2Mo-TiO 2 after Cr irradiation at 500 o C to a) 30 dpa and b) 150 dpa [38]](https://thumb-us.123doks.com/thumbv2/123dok_us/1410525.2688774/80.918.271.653.115.573/figure-formation-rod-like-precipitates-cr-tio-irradiation.webp)
