ARTICLE
Performance of ACMG-AMP Variant-Interpretation
Guidelines among Nine Laboratories in the
Clinical Sequencing Exploratory Research Consortium
Laura M. Amendola,1,16 Gail P. Jarvik,1,16,* Michael C. Leo,2 Heather M. McLaughlin,3
Yassmine Akkari,4 Michelle D. Amaral,5 Jonathan S. Berg,6 Sawona Biswas,7 Kevin M. Bowling,5 Laura K. Conlin,7 Greg M. Cooper,5 Michael O. Dorschner,8 Matthew C. Dulik,9 Arezou A. Ghazani,10 Rajarshi Ghosh,11 Robert C. Green,3,12,15 Ragan Hart,1 Carrie Horton,13 Jennifer J. Johnston,14
Matthew S. Lebo,3,12 Aleksandar Milosavljevic,11 Jeffrey Ou,1 Christine M. Pak,4 Ronak Y. Patel,11 Sumit Punj,4 Carolyn Sue Richards,4 Joseph Salama,1 Natasha T. Strande,6 Yaping Yang,11
Sharon E. Plon,11 Leslie G. Biesecker,14 and Heidi L. Rehm3,12,15,*
Evaluating the pathogenicity of a variant is challenging given the plethora of types of genetic evidence that laboratories consider. Deciding how to weigh each type of evidence is difficult, and standards have been needed. In 2015, the American College of Medical Genetics and Genomics (ACMG) and the Association for Molecular Pathology (AMP) published guidelines for the assessment of variants in genes associated with Mendelian diseases. Nine molecular diagnostic laboratories involved in the Clinical Sequencing Exploratory Research (CSER) consortium piloted these guidelines on 99 variants spanning all categories (pathogenic, likely pathogenic, uncertain significance, likely benign, and benign). Nine variants were distributed to all laboratories, and the remaining 90 were evaluated by three laboratories. The laboratories classified each variant by using both the laboratory’s own method and the ACMG-AMP criteria. The agree-ment between the two methods used within laboratories was high (K-alpha¼0.91) with 79% concordance. However, there was only 34% concordance for either classification system across laboratories. After consensus discussions and detailed review of the ACMG-AMP criteria, concordance increased to 71%. Causes of initial discordance in ACMG-ACMG-AMP classifications were identified, and recommen-dations on clarification and increased specification of the ACMG-AMP criteria were made. In summary, although an initial pilot of the ACMG-AMP guidelines did not lead to increased concordance in variant interpretation, comparing variant interpretations to identify differences and having a common framework to facilitate resolution of those differences were beneficial for improving agreement, allowing iterative movement toward increased reporting consistency for variants in genes associated with monogenic disease.
Introduction
The assessment of pathogenicity of genetic variation is one of the more complex and challenging tasks in the field of clinical genetics. It is now clear that enormous genetic vari-ation exists in the human populvari-ation. Most of this varia-tion, including very rare variants, is unlikely to contribute substantively to human disease. For example, a typical genome sequence and reference genome have about 3.5 million differences, of which 0.6 million are rare or novel.1As such, the challenge of interpreting the clinical significance of this variation is well recognized as a barrier to furthering genomic medicine.2,3
We have previously reported both inconsistencies across laboratories in the classification of Mendelian-disease var-iants and high discordance in the use of a single simple
classification system, whereby reviewers showed a bias to-ward overestimating pathogenicity.4 Furthermore, recent analyses of variant classifications in ClinVar showed that for the 11% (12,895/118,169) of variants with two or more submitters, interpretations differed in 17% (2,229/ 12,895).3 Inconsistency of the classification of variants across professional genetics laboratories has been reported elsewhere.5These data highlight the need for a more sys-tematic and transparent approach to variant classification. Laboratories performing and reporting the results of clinical genetic testing are now tasked with considering a plethora of types of genetic evidence, some applicable to all genes and others specific to individual genes and diseases. To date, laboratories have developed their own methods of variant assessment because the prior Amer-ican College of Medical Genetics and Genomics (ACMG)
1Division of Medical Genetics, Department of Medicine, University of Washington, Seattle, WA 98195, USA; 2Center for Health Research, Kaiser
Permanente, Portland, OR 97227, USA;3Laboratory for Molecular Medicine, Partners HealthCare Personalized Medicine, Cambridge, MA 02139, USA; 4Department of Molecular and Medical Genetics, Oregon Health and Science University, Portland, OR 97239, USA;5HudsonAlpha Institute for
Biotech-nology, Huntsville, AL 35806, USA;6Department of Genetics, University of North Carolina, Chapel Hill, NC 27599, USA;7Division of Human Genetics,
Department of Pediatrics, Children’s Hospital of Philadelphia, Philadelphia, PA 19104, USA;8Center for Precision Diagnostics, Department of Pathology, University of Washington, Seattle, WA 98195, USA;9Department of Pathology and Laboratory Medicine, Children’s Hospital of Philadelphia, Philadelphia,
PA 19104, USA;10Department of Medical Oncology, Dana-Farber Cancer Institute, Boston, MA 02215, USA;11Baylor College of Medicine, Houston,
TX 77030, USA;12Brigham and Women’s Hospital and Harvard Medical School, Cambridge, MA 02115, USA;13Clinical Diagnostics, Ambry Genetics, Aliso
Viejo, CA 92656, USA;14Intramural Research Program, National Human Genome Research Institute, NIH, Bethesda, MD 20892, USA;15Broad Institute of
MIT and Harvard, Cambridge, MA 02142, USA
16These authors contributed equally to this work
*Correspondence:[email protected](G.P.J.),[email protected](H.L.R.)
variant-reporting guidelines did not address the weighting of evidence for variant classification.6Some laboratories assign points to types of evidence and generate a score,7 and others define specific combinations of evidence that allow them to arrive at each classification category8 or use a Bayesian framework to combine data types into a likelihood ratio.9Still others have simply relied on expert judgment of the individual body of evidence on each variant to make a decision.
Deciding how to categorize and weigh each type of evidence is challenging, and guidance has been needed. Making the task even more challenging is that the true pathogenicity is not known for most variants, and it is therefore difficult to validate approaches to variant assess-ment, particularly for addressing variants that have limited evidence. However, combining the collective experience of experts in the community to begin to build a more system-atic and transparent approach to variant classification is essential, and this has led the ACMG and Association for Molecular Pathology (AMP) to develop a framework for ev-idence evaluation. The initial framework was published in early 201510and focused on variants in genes associated with Mendelian disease.
The ACMG-AMP guidelines defined 28 criteria (each with an assigned code) that address evidence such as population data, case-control analyses, functional data, computational predictions, allelic data, segregation studies, and de novo observations. Each code is assigned a weight (stand-alone, very strong, strong, moderate, or supporting) and direction (benign or pathogenic), and then rules guide users to combine these evidence codes to arrive at one of five classi-fications: pathogenic (P), likely pathogenic (LP), variant of uncertain significance (VUS), likely benign (LB), or benign (B). In some cases, the strength of individual criteria can be modified at the discretion of the curator, and the overall classification can be modified with expert judgment. As an example, a minor allele frequency (MAF) greater than the disease prevalence but less than 5% is coded benign strong (BS1); this is considered strong evidence against pathoge-nicity for a highly penetrant monogenic disorder and supports a LB classification when it is combined with at least one supporting line of evidence against pathogenicity (BP1–BP6). If BS1 is combined with another strong line of evidence against pathogenicity (BS2–BS4), this supports a B classification. Conversely, a variant predicted to be null (PVS1) would be classified as LP if it is absent from popula-tion databases (PM2) or P if it is observed to be de novo with confirmed paternity and maternity (PS2). If not enough lines of evidence are invoked to classify a variant as P, LP, LB, or B, or there are valid but contradictory lines of evi-dence, a variant is interpreted as a VUS.
We set out to evaluate how the ACMG-AMP guidelines compare to individual laboratory approaches to variant clas-sification and explore the variance in the use and interpreta-tion of the pathogenicity criteria. Nine laboratories partici-pating in the Clinical Sequencing Exploratory Research (CSER) consortium evaluated the use of the new
ACMG-AMP guidelines and house interpretations to assess in-ter-laboratory concordance by either method of variant clas-sification. Our goals were to evaluate consistency of the use of the ACMG-AMP codes and subsequent pathogenicity classification. Further, we used these criteria to analyze the basis for discordance and sought to reconcile differing im-plementations with an eye to guidance clarification.
Material and Methods
CSER is a National Human Genome Research Institute (NHGRI)-and National Cancer Institute (NCI)-funded consortium exploring the clinical use of genomic sequencing, developing best practices, and identifying obstacles to implementation. It is composed of nine clinical U-award sites focusing on all aspects of clinical sequencing, the ClinSeq project,11and nine R-award sites focusing on ethical, legal, and social implications. Eight of the nine clinical U-award sites and ClinSeq participated in this exercise. These included laboratories performing exome and/or genome sequencing for the following projects: BASIC3(Baylor College of Medicine, Houston), PediSeq (Children’s Hospital of Philadelphia), CanSeq (Dana Farber Cancer Institute, Boston), HudsonAlpha Insti-tute for Biotechnology, MedSeq (Brigham and Women’s Hospital and Partners Healthcare, Boston), NextGen (Oregon Health Sci-ences University, Portland), NCGENES (University of North Car-olina, Chapel Hill), and NEXT Medicine (University of Washington, Seattle). Eight of the nine sites were accredited by the Clinical Laboratory Improvement Amendments (CLIA).
Selection and Classification of Variants
Each site nominated 11 variants identified in their sequencing projects for this exercise. Submitted variants were single-nucleo-tide substitutions or small indels (<22 bp) in genes thought to be associated with Mendelian disease. Each site was instructed to provide a range of variants in each classification category with varying degrees of difficulty. Accepted classifications were B, LB, VUS, LP, and P. Each variant submission also included whether it was identified as a diagnostic result or an incidental finding. Any internal evidence that the submitting laboratory used to classify the variant—for example, the phenotype and family history of the proband or whether parental testing identified the variant as de novo—was also provided to all laboratories. Nine variants (two P, two LP, two VUS, two LB, and one B) were selected for dis-tribution to all laboratories without the submitting laboratory’s classification; half were identified as incidental findings, half were identified as diagnostic findings, and one was from a carrier screen. The remaining 90 variants were randomly distributed to at least two other laboratories, enabling classifications from at least three laboratories for each variant. Each laboratory was asked to classify the pathogenicity by applying both their internal process and then the ACMG-AMP system. They were asked to document which ACMG-AMP criteria were invoked for the ACMG-AMP clas-sification and note whether they found the clasclas-sification of each variant difficult, moderate, or easy. Time taken for categorizing the variant was requested but not consistently recorded.
Application of Automated Tool for Calculation of Overall Classification from Evidence Codes
pathogenicity calculator that combines the provided codes to generate a final classification. We used this calculator to compare the calculated ACMG-AMP classification based on tabulating the ev-idence codes provided by the laboratory with the final ACMG-AMP classification submitted by the laboratory. We shared these data with sites for consideration during consensus discussions and manually verified the results to identify which discrepancies were due to errors by the submitting laboratory and which were due to the use of judg-ment in overruling the ACMG-AMP classification.
Analysis of Intra- and Inter-laboratory Concordance
Descriptive statistics summarized the intra-laboratory classification concordance between the ACMG-AMP system and the laboratory’s own process and the inter-laboratory concordance both for each laboratory’s own process and for the ACMG-AMP system across laboratories. Additionally, we quantified the level of agreement. To do this, we considered the five-tier classification system in the following order—B, LB, VUS, LP, and P—and defined a one-step level of disagreement to be a range of classifications from one cate-gory to the next ordered catecate-gory (e.g., from VUS to LP or LP to P); the maximum level included four steps (i.e., B to P). In addition, we tracked disagreements that were more likely to lead to medical-management differences (P or LP versus any of VUS, LB, and B) and disagreements less likely to affect clinical decision making (e.g., VUS versus LB or B, or confidence differences, such as B versus LB or P versus LP). To quantify the overall level of absolute ment on ACMG-AMP and laboratory criteria within sites and agree-ment between sites using ACMG-AMP or laboratory criteria, we calculated Krippendorff’s alpha (K-alpha); ranging from 0 to 1, this generalized measure of absolute agreement corrects for chance responding and can handle any number of raters, scale of measure-ment, and missing data. Because it focuses on disagreemeasure-ment, it over-comes many of the weaknesses associated with other agreement measures, such as Cohen’s kappa.12–16In general, values of 0.80 and above are considered evidence of good agreement.14We also calculated 95% confidence intervals (CIs) for K-alpha by using bootstrapping with 20,000 replications.17
Two variants were excluded from the quantitative analyses and are not represented in Figures 1A and 1B; however, they are represented in the overall concordance shown in Figures 1C and 2. One variant was a low-penetrance allele (c.3920T>A [p.Ile1307Lys] [GenBank: NM_001127510.2] in APC [MIM: 611731]) for which several laboratories did not assign an ACMG-AMP classification, and the other variant (c.1101þ1G>T [GenBank: NM_001005463.2] inEBF3[MIM: 607407]) was a predicted loss-of-function variant in a gene for which there is no known association with disease. Neither of these two variants was relevant to this analysis of classifying high-penetrance variants for Mendelian con-ditions, for which the ACMG-AMP guidelines are intended. In addi-tion, the two laboratories that had key personnel involved in the development of the ACMG-AMP recommendations were excluded from one study-wide sensitivity analysis to evaluate whether famil-iarity with the system affects concordance. Lastly, we performed a second sensitivity analysis by excluding the classifications of the submitting laboratory to determine the dependence of these results on a single laboratory and whether classification in a real case setting rather than only for the comparison study affects results.
Analysis of ACMG-AMP Lines of Evidence
We analyzed the lines of evidence used for each variant classifi-cation to identify how commonly specific evidence codes and
classification rules were used across all of the variants, the overall agreement in the pattern of ACMG-AMP codes used across sites for each variant, and the consistency with which each ACMG-AMP code was used within each variant. These were determined with a frequency table, the mean of coefficient of variation (CV) values across variants with each ACMG-AMP code, and K-alpha values of ACMG-AMP codes within each variant. Descriptive statistics of how often the strength of each line of evidence was modified dur-ing variant interpretation were also calculated.
Consensus Discussions
The variants with discrepant classifications based on the ACMG-AMP guidelines were discussed via phone conferences (n¼23) or via email (n¼43). Variants were chosen for discussion by phone conference if they were interpreted by all nine laboratories or if they were discrepant by more than one category of disagreement. The laboratory that submitted each of these 23 variants presented the lines of evidence used by all laboratories and the rationale for using, not using, or altering the strength of a particular evidence code. Once all evidence was discussed, each laboratory was asked to provide a final classification. For variants for which only one lab-oratory was discordant for only a one-level difference, the discor-dant laboratory was asked to re-review their classification in light of the evidence used and classifications made by the other labora-tories. The discordant laboratory then provided either a change or a decision to retain the original classification, including the ratio-nale in both scenarios by email. During phone conferences and via email, laboratories had the opportunity to share any internal data that could have contributed to discordance.
Results
Intra-laboratory Classification Concordance between Unique Laboratory Criteria and the ACMG-AMP System
The intra-laboratory comparison of the laboratory process and the ACMG-AMP system for the 347 paired variant as-sessments is summarized inFigure 1A. The classifications matched for 275 of 347 (79%) variant assessments. Eleven of the 347 paired variant assessments (3.2%) differed by greater than one level. Overall, in 48 of the 72 (67%) discordant calls, the ACMG-AMP system calls were closer to VUS. Specifically, a classification of B or LB was more likely to result from using the laboratories’ own criteria than from using the ACMG-AMP criteria. The K-alpha value for agreement within laboratories ranged from 0.77 to 1.00 (average ¼ 0.91; seven of nine laboratories had K-alpha>0.90).
Inter-laboratory Concordance in Classification
these laboratories. All laboratories reviewing the variant (three to nine) agreed for 33 (34%) when they used either the ACMG-AMP system or their own criteria. No signifi-cant difference was found in inter-laboratory concordance when the two laboratories that contributed to the ACMG-AMP classification recommendations were removed from the analysis (K-alpha lab¼ 0.77, 95% CI¼ [0.73, 0.80]; K-alpha ACMG-AMP ¼ 0.70, 95% CI ¼ [0.66, 0.74]) or when the site that submitted the variant classifications was removed from the analysis (K-alpha lab¼0.76, 95% CI¼[0.71, 0.80]; K-alpha ACMG-AMP¼0.75, 95% CI¼ [0.71, 0.78]). The distribution of types of disagreement among laboratories using each method is shown in
Figure 1B. A total of 43/194 (22%) classifications had cate-gory differences that are more likely to influence medical
decision making (P or LP versus VUS, LB, or B), the major-ity of which (33) were P or LP versus VUS. An additional 36 classifications (19%) involved differences between VUS and LB or B, which could have an impact on results re-ported by the laboratory given that many laboratories do not report LB or B results and that reporting VUS results could result in a more lengthy disclosure process and uncertainty of follow-up. The remaining 25% of variant classifications were differences in the confidence of calls (P versus LP or B versus LB), which are unlikely to have an impact on clinical care.
Consensus Discussions
The interpretation of 33/99 (34%) variants was identical across all sites that used the ACMG-AMP guidelines. After
Figure 1. Distribution of Variant-Classification Comparisons according to the Extent of Differences across a Five-Tiered Classification Scheme
(A) Intra-laboratory concordance between laboratory and ACMG-AMP classification systems. This graph compares each site’s use of the ACMG-AMP rules to their own laboratory classification methods.
(B) Inter-laboratory concordance of 97 variants. This graph compares the same calls, based on either the ACMG-AMP rules or the site’s rules, between laboratories.
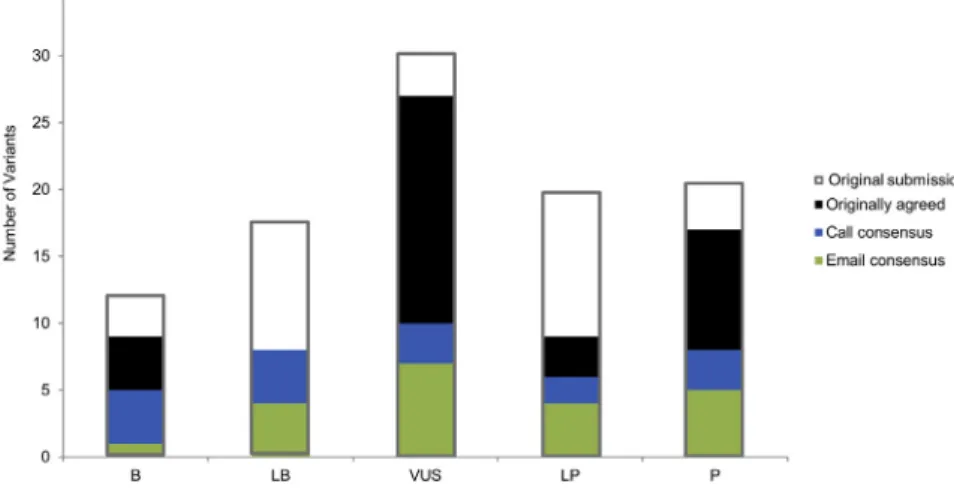
either emails or conference calls among the reporting laboratories, consensus on variant classifications based on the ACMG-AMP guidelines was achieved for 70/99 (71%) variants. Twenty-one of the discrepant variants were resolved via email, and the remaining 16 were resolved during phone conferences. The distribution and sources of variant-interpretation consensus can be found inFigure 2; gray outlines show the original distribution of submitted variant interpretations. Figure 1C shows the distribution of types of disagreement among labora-tories after the consensus effort. Of the 29 variants that remained discordant, 25 involved only one level of differ-ence (15 differed in confiddiffer-ence differdiffer-ences, three differed between LP and VUS, and seven differed between VUS and LB). Of the four variants with greater than one level of difference, two involved a difference between P and VUS, LB, or B. The final classifications for the 70 variants for which consensus was achieved, and the range of clas-sifications for the remaining 29 discordant variants, are presented inTable S1.
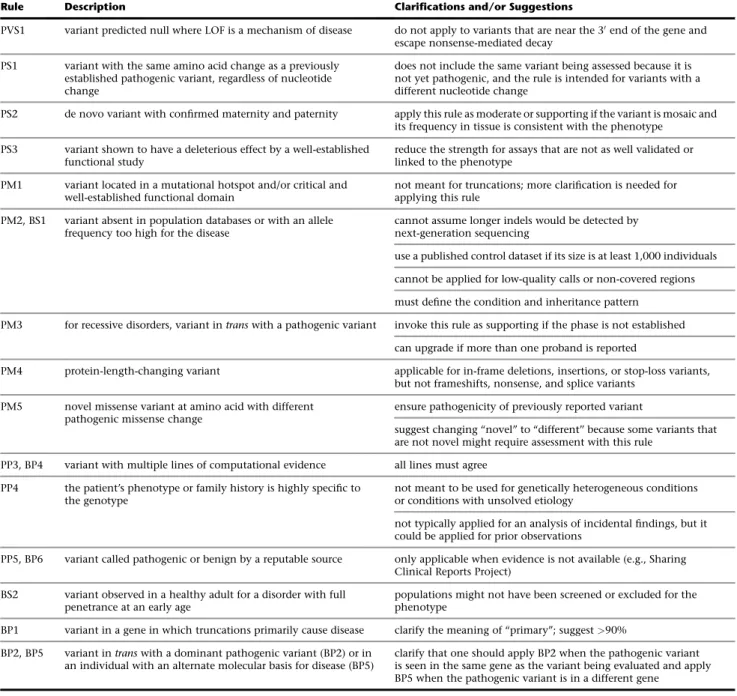
Consensus discussions led to the clarification of the correct use of several ACMG-AMP lines of evidence, some of which included errors in the appropriate use of the rules already described in the guidelines (Table 1). Although the ACMG-AMP guidelines suggest a VUS classification when conflicting pathogenic and benign lines of evidence are identified, some laboratories allowed one line of conflicting benign evidence of only a supporting level (e.g., computational predictions) to override otherwise strong evidence of pathogenicity. In these cases, consensus discussion led to the use of expert judgment, as described in the ACMG-AMP guidelines, for appropriately disregarding the limited conflicting evidence, such as computational predic-tions. For two variants, achieving concordant interpre-tations required one laboratory’s internal data. It was difficult to resolve the two variants that were excluded from the intra- and inter-laboratory analyses because the ACMG-AMP rules were not designed for low-pene-trance variants (risk alleles) or variants in genes not clearly associated with the disorder. Some discrepancies
Figure 2. Distribution of 99 Variants Submitted for Assessment
Gray outlines illustrate the distribution of variant classifications submitted for assess-ment. Green bars indicate those calls that were agreed upon after initial review, blue bars indicate those calls agreed upon after email exchange, and black bars indicate those calls agreed upon after discussion on conference calls.
in classification occurred because laboratories were interpreting the same variant for two different associated conditions, which have different disease frequencies. This led to a discordant use of the rules related to allele frequency.
Errors in Using the ACMG-AMP System
Our implementation of a computational tool to assess ac-curacy of combining the ACMG evidence codes used by the laboratories showed that for 16 out of 353 (5%) variant assessments, the ACMG-AMP codes listed by the labora-tories did not support the classification chosen. When the laboratories were queried on these discrepancies, 9 of the 16 were due to tabulation errors, whereas judgment was used to override the ACMG-AMP rules for 7 of the 16 variants. The tabulation errors suggest that using computa-tional tools to calculate the classification will lead to a modest increase in the accuracy of applying the rules.
ACMG-AMP Lines of Evidence Invoked and Modified in Strength
The frequency with which each ACMG-AMP code was invoked is listed in Figure 3. All lines of evidence were used at least once, except for BP7 (a silent, or synonymous, variant) given that no silent variants were submitted. Sixteen lines were used in fewer than 10% of variants, seven were used in 11%–18% of variants, and four were used in over 20% of all variant classifications: PVS1 (20%, predicted to be truncating), BS1 (26%, allele fre-quency is too high), PP3 (39%, computational evidence), and PM2 (41%, absent in population databases).
PVS1 (null variant where loss of function [LOF] is a known mechanism of disease; mean CV¼0.55). The mean and SD of the CV for all lines of evidence used are available inTable S2.
We also evaluated which criteria laboratories had increased or decreased in evidence strength and found that a total of nine lines of evidence were modified at least once. Three criteria were increased in strength (PM3, PP1, and BP2), and seven were decreased in strength (PVS1, PS1, PS2, PS3, PS4, PM3, and BS1). Co-segregation data supporting pathogenicity (PP1) was the most commonly modified line of evidence, whereby laboratories increased the strength from supporting to moderate or strong for nine interpretations on the basis of the strength of the segregation evidence available in the literature or from
the laboratory’s internal data. The other most common ex-amples of modified strength included the following: PVS1 (a predicted null variant in a gene where LOF is a known mechanism of disease) was downgraded from very strong four times, PS2 (well-established functional studies show a deleterious effect) was downgraded three times, and BS1 (MAF is too high for the disorder) was downgraded three times.
Specific Variant Examples
TheGLA(MIM: 300644) c.639þ919G>A variant (GenBank: NM_000169.2), which has been reported in individuals with late-onset Fabry disease (MIM: 301500) and reduced alpha-galactosidase A enzyme activity,18,19 was classi-fied by three laboratories. Ranging from VUS to P, the Table 1. ACMG-AMP Rule Clarifications and Suggestions for Modification
Rule Description Clarifications and/or Suggestions
PVS1 variant predicted null where LOF is a mechanism of disease do not apply to variants that are near the 30end of the gene and escape nonsense-mediated decay
PS1 variant with the same amino acid change as a previously established pathogenic variant, regardless of nucleotide change
does not include the same variant being assessed because it is not yet pathogenic, and the rule is intended for variants with a different nucleotide change
PS2 de novo variant with confirmed maternity and paternity apply this rule as moderate or supporting if the variant is mosaic and its frequency in tissue is consistent with the phenotype
PS3 variant shown to have a deleterious effect by a well-established functional study
reduce the strength for assays that are not as well validated or linked to the phenotype
PM1 variant located in a mutational hotspot and/or critical and well-established functional domain
not meant for truncations; more clarification is needed for applying this rule
PM2, BS1 variant absent in population databases or with an allele frequency too high for the disease
cannot assume longer indels would be detected by next-generation sequencing
use a published control dataset if its size is at least 1,000 individuals
cannot be applied for low-quality calls or non-covered regions
must define the condition and inheritance pattern
PM3 for recessive disorders, variant intranswith a pathogenic variant invoke this rule as supporting if the phase is not established
can upgrade if more than one proband is reported
PM4 protein-length-changing variant applicable for in-frame deletions, insertions, or stop-loss variants, but not frameshifts, nonsense, and splice variants
PM5 novel missense variant at amino acid with different pathogenic missense change
ensure pathogenicity of previously reported variant
suggest changing ‘‘novel’’ to ‘‘different’’ because some variants that are not novel might require assessment with this rule
PP3, BP4 variant with multiple lines of computational evidence all lines must agree
PP4 the patient’s phenotype or family history is highly specific to the genotype
not meant to be used for genetically heterogeneous conditions or conditions with unsolved etiology
not typically applied for an analysis of incidental findings, but it could be applied for prior observations
PP5, BP6 variant called pathogenic or benign by a reputable source only applicable when evidence is not available (e.g., Sharing Clinical Reports Project)
BS2 variant observed in a healthy adult for a disorder with full penetrance at an early age
populations might not have been screened or excluded for the phenotype
BP1 variant in a gene in which truncations primarily cause disease clarify the meaning of ‘‘primary’’; suggest>90%
BP2, BP5 variant intranswith a dominant pathogenic variant (BP2) or in an individual with an alternate molecular basis for disease (BP5)
interpretations based on ACMG-AMP rules were discor-dant; however, all sites agreed on the classification of P when they used internal rules. This variant was absent from 528 race-matched control individuals across two studies.18–20A functional study also supported an effect of this variant on splicing.19 All three laboratories invoked PS3 (a well-established functional study [clinical alpha-galactosidase enzyme testing] showed a deleterious effect of the variant) and PP1 (evidence of segregation), and one site increased the strength of this line of evidence from sup-porting to moderate on the basis of three families cited in the literature. PS4 (the prevalence of the variant in affected individuals is statistically greater than that in control indi-viduals) was invoked by the one laboratory that called the variant P by using both their own rules and the ACMG-AMP criteria. Upon further discussion, the group agreed that this rule was applicable on the basis of a single publica-tion citing a significant p value and other studies showing a statistical increase but requiring manual calculation. PVS1 (predicted-null variant in a gene where LOF is a known mechanism of disease) was also applied by all three labora-tories after the group decided to downgrade the strength from very strong to strong because of the minor retention of wild-type transcript and the fact that the variant was a deep intronic variant for which a functional study was needed to demonstrate its impact on splicing. Three lines of evidence originally invoked by only one laboratory each were discarded: (1) PM4 (protein-length-changing variant) because this rule is only applicable for in-frame deletions, insertions, and stop-loss variants; (2) PP5 (a repu-table source calls the variant pathogenic) because the reputable source’s evidence was available for review by the curators and; (3) PP3 and BP4 (multiple lines of computa-tional evidence agree) because this rule applies only when all predictions agree and not simply when some agree and others do not. All three sites came to a consensus that this variant is P on the basis of both their internal laboratory criteria and the ACMG-AMP criteria.
The group reviewed the c.1529C>T (p.Ala510Val) variant (GenBank: NM_003119.2) inSPG7(MIM: 602783), which is associated with autosomal-recessive spastic paraplegia (MIM: 607259), a disease that is known to have a variable,
but generally adult, age of onset.21It was interpreted by all nine laboratories and had a range of pathogenicity classifica-tions from LB to P. This variant was observed in 0.4% (267/ 66,688) of chromosomes of European ancestry (EU) in the ExAC Browser and has been found to have a 3%–4% hetero-zygote frequency in the UK and an estimated homohetero-zygote frequency of 20–40 per 100,000 individuals.22Shared data included that the variant was observed in the heterozygous state in 3 of the first 50 participants sequenced by the submit-ting laboratory’s CSER study. The frequency ofSPG7 -associ-ated spastic paraplegia is conservatively estim-associ-ated to be 2–6 per 100,000 individuals according to the higher estimate; this yields an estimated frequency of 0.8% for all associated alleles. Multiple publications have cited the identification of homozygous or compound-heterozygous (including this variant) affected individuals.22–24It is notable that the labo-ratories that concluded this was a VUS or LB variant consid-ered the BS1 criteria (the variant is more common than the disease, adjusted for the autosomal-recessive inheritance pattern). Two of the laboratories that concluded the variant was P according to the ACMG-AMP rules used the PM2 criteria (the variant is absent from control individuals or has an extremely low frequency if recessive). The remainder of the laboratories did not use any rules on population-fre-quency data. An additional line of evidence with conflicting use was PS1 (the variant results in the same amino acid change as a previously established pathogenic variant, regardless of nucleotide change). This rule was invoked by four of nine laboratories; however, after clarification that the intent of this rule, as described in the ACMG-AMP guidelines, is to be applied only for a ‘‘different’’ nucleotide change (i.e., something other thanSPG7 c.1529C>T that still leads to p.Ala510Val), all laboratories agreed that this rule was not applicable. Consensus was not reached for this variant largely because of discordance in applying the population-frequency lines of evidence. Some groups continued to weigh the published literature evidence of pathogenicity, whereas other groups concluded that it could not be a high-penetrance variant given its allele frequency. Given a perceived deficit of affected homozy-gotes relative to affected compound heterozyhomozy-gotes, some felt it might have low penetrance unless it is paired
with a more deleterious variant. Resolving the role of this variant in disease might ultimately require a better un-derstanding of the penetrance and possible role of modifiers, and classifying the pathogenicity of lower-penetrance vari-ants was outside the scope of the ACMG-AMP guidelines.
The variant with the largest range of discordance (P to B) after consensus efforts based on the ACMG-AMP guide-lines wasBTD(MIM: 609019) c.1330G>C (p.Asp444His) (GenBank: NM_000060.2), which was interpreted by three laboratories. BTD is associated with autosomal-recessive biotinidase deficiency (MIM: 253260), and this variant was detected in one allele of an unaffected individual. The interpretations based on the ACMG-AMP guidelines originally ranged from VUS to P; however, after consensus efforts, the laboratory that classified the variant originally as VUS changed their interpretation to B, whereas the other two laboratories kept their interpretations as LP and P. This variant has been identified in multiple biotinidase-defi-ciency-affected individuals who have variants associated with profound deficiency on the other allele.25,26It was observed in 5.4% of chromosomes of Finnish ancestry and 4.15% of EU chromosomes in the ExAC Browser, and there were 83 reported instances of homozygosity. The lab-oratory that interpreted this variant as B invoked the MAF> 5% (BA1) as standalone criteria and noted the presence of homozygotes in population databases. LikeSPG7, this might represent an allele that is more likely to be patho-genic when it is found to be compound heterozygous with a more deleterious allele than when it is found to be homozygous. This is a general problem with recessive disorders, and it might make consideration of the genotype rather than the pathogenicity of each allele more important for disease prediction. The laboratories classifying this variant as P and LP used expert judgment to overrule the use of BA1, which supports a B classification. They cited multiple reputable laboratories that have interpreted this variant as pathogenic and evidence that individuals who are homozygous and compound heterozygous for this variant might have a more mild form of the disease. Consensus efforts brought the group further from agree-ment on this variant; however, this highlights the impor-tance of employing expert judgment when making inter-pretations, as well as the challenges that stem from using
the ACMG-AMP guidelines to interpret the clinical signifi-cance of variants that might be associated with lower pene-trance and mild presentations of disease.
TheSupplemental NoteandTable 1describe in detail the criteria-specific clarifications that resulted from common usage errors, as well as the challenges and discussion topics related to each of the ACMG-AMP evidence categories that are utilized in implementing the ACMG-AMP guidelines. This material is designed to further clarify numerous rules found in the ACMG-AMP publication. In addition, more general recommendations and additional resources that could increase consistency of the usage of ACMG-AMP rules across laboratories are defined inBox 1.
Discussion
Interpreting the pathogenicity of a genetic variant requires evaluating a large number of heterogeneous types of evidence to arrive at a unitary descriptor of pathoge-nicity. Given the complexity of the data and uncertainty regarding the validity or utility of some of the data used for these interpretations, it is unsurprising that there would be variation among laboratories regarding these de-terminations. To that end, the ACMG-AMP system for clas-sifying variant pathogenicity10is an important first step in efforts to improve the consistency of variant classification among laboratories. The guidelines include standardized terminology for classifying variants associated with mono-genic diseases and a defined series of evidence types that can be used in pathogenicity assessment, enabling a record of the specific evidence type and strength used for deter-mining pathogenicity. This enhances transparency and facilitates resolution of discrepancies in variant interpreta-tion. It also forms a basis for iteratively building on the evidence as new data become available over time.
This study systematically evaluated the implementation of the ACMG-AMP guidelines in the medical practice of variant assessment. Nearly all ACMG-AMP lines of evidence were used, and PVS1 (predicted truncating), BS1 (allele frequency too high), PP3 (computational evidence), and PM2 (absent in population databases) (Figure 3) reflect the spectrum of variants chosen for the exercise and the most Box 1. Recommendations and Additional Resources for Increasing Consistency in the Usage of ACMG-AMP Rules
d Develop disease-specific allele-frequency thresholds to enable lowering of the stand-alone benign criteria from a MAF ofR5% to values specific to each disorder.
d Establish a resource of all genes to define whether LOF is a known mechanism of disease. d Make recommendations for which computational algorithms are best in practice.
d Better define ‘‘well-established’’ functional data and/or distribute a resource that lists functional assays that meet the well-established threshold. Also define when to use reduced strength of the rule.
d Develop quantitative thresholds of evidence for and against segregation of different strengths.
available types of data. We identified differences in the application of the criteria but no difference in classification concordance between the ACMG-AMP system and the lab-oratory method. In part, the discordance in applying the ACMG-AMP guidelines was due to the subjective process of deciding when certain criteria are met. However, the guidelines provided a valuable framework for subsequent discussion of evidence, often leading to resolution of differ-ences in variant interpretation; achieving this would have been more difficult if each laboratory relied on an indepen-dent method for variant assessment. The differences in both the intra- and inter-laboratory analyses identified points of confusion and inaccurate use of the ACMG-AMP criteria, as well as areas where expert judgment is required and additional guidance is needed. It should be noted that this was the first time that most sites had worked with the ACMG-AMP guidelines, and thus familiarity and systems for implementation of the criteria were still evolving. In addition, because the variants were distributed as a pilot evaluation of the ACMG-AMP guidelines and not for clin-ical reporting, not all sites subjected the variants to their typical CLIA process of review, which includes final review by a board-certified laboratory geneticist or an equivalently trained individual. Thus, the level of discordance reported here might have been inflated by the atypical workflows be-ing deployed. In contrast, the resolution of the discordant variants involved multiple board-certified geneticists and others with long-standing experience in variant assess-ment, documenting the importance of this level of training in variant interpretation. These study results underscore the need for training in the use of genetic resources, evaluation of variant evidence, and application of the ACMG-AMP guidelines, even among experienced professionals. This study identified areas of confusion regarding the ACMG-AMP criteria, and these will be useful in developing training materials and further guidance for variant assessment. As recently described,3 the Clinical Genome Resource (ClinGen) consortium is developing tools to aid variant classification based on the ACMG-AMP guidelines and will make this information public through both commu-nity availability of the tool and documentation of applied codes with variants submitted to ClinVar.
As described above, our discussion and consensus build-ing led to a decrease in variant discordance from 66% to 29% of the 99 variants analyzed. This underscores the importance of not only having a standardized approach to variant assessment but also sharing variant interpreta-tions for identifying and potentially resolving discordance. Given the rarity of most variants causative for monogenic disease, sharing data and comparing interpretations are imperative for ensuring the greatest opportunity for informed and collaborative variant interpretation. It is important to also reflect on the goals of variant assessment. Although numerous variants have robust evidence that can unequivocally allow classification into discreet cate-gories without debate, many other variants have limited or conflicting evidence, making it difficult to accurately
classify these variants. Indeed, for 29 (29%) of the 99 variants assessed in this study, a consensus classification was not achieved, and 5 of the 29 involved a difference between the categories of P or LP and VUS, LB, or B, which could affect medical management. This finding high-lights that classifying sequence variants is similar to other fields of medicine in which practitioners can legitimately differ in their assessments of pathogenicity of a laboratory finding. By defining and applying formal criteria that parse these heterogeneous data types, we can better understand and analyze these legitimate differences in expert opinion and at the same time reduce errors and discrepancies.
Supplemental Data
Supplemental Data include a Supplemental Note, Supplemental Acknowledgments, and two tables and can be found with this article online athttp://dx.doi.org/10.1016/j.ajhg.2016.03.024.
Conflicts of Interest
Most authors are employed by clinical-service providers. G.P.J. is a scientific advisory board member for ActX, a genetic-testing com-pany. R.C.G. has received compensation from Invitae, Prudential, Illumina, AIA, Helix, and Roche for advisory services or speaking. S.E.P. serves on the scientific advisory board of Baylor Miraca Ge-netic Laboratory. Baylor College of Medicine and Miraca Holdings Inc. have formed a joint venture with shared ownership and governance of the Baylor Miraca Genetics Laboratories, which perform exome sequencing.
Acknowledgments
This work was funded by the National Human Genome Research Institute (NHGRI) and National Cancer Institute (UO1HG0006546, U01HG006485, U01HG006500, U01HG006492, UM1HG007301, UM1HG007292, UM1HG006508, U01HG006487, U01HG006507, U01HG007307, U41HG006834, R21HG006596, R01HG006600, P50HG007257, R01HG006600, R01HG004500, R01CA154517, R01HG006618, R21HG006594-01, R01HG006615-01, R21HG006612, and 5R21HG006613-02) and additional support from the participating laboratories. This research was supported in part by the Intramural Research Program of the NIH NHGRI. We thank the following individuals for contributing to variant assess-ment at the sites: Hana Zouk, PhD; Steven M. Harrison, PhD; Jillian G. Buchan, PhD; Jessica Booker, PhD; Jim Evans, MD, PhD, Kate Fore-man, MS; Gloria Haskell, PhD; Kristy Lee, MS; Julianne O’Daniel, MS; Bradford Powell, MD, PhD; Bryce Seifert, PhD; and Karen Weck, MD.
Received: December 21, 2015 Accepted: March 22, 2016 Published: May 12, 2016
Web Resources
1000 Genomes,http://www.1000genomes.org/
ClinGen Pathogenicity Calculator,http://calculator.clinicalgenome. org/site/cg-calculator
Gene Tests,http://www.ncbi.nlm.nih.gov/books/NBK1107/ NHLBI Exome Sequencing Project (ESP) Exome Variant Server,
http://evs.gs.washington.edu/EVS/ OMIM,http://www.omim.org/
RefSeq,http://www.ncbi.nlm.nih.gov/refseq/
Sharing Clinical Reports Project,https://www.clinicalgenome.org/ data-sharing/sharing-clinical-reports-project-scrp/
References
1. Kohane, I.S., Hsing, M., and Kong, S.W. (2012). Taxonomiz-ing, sizTaxonomiz-ing, and overcoming the incidentalome. Genet. Med.
14, 399–404.
2. Evans, B.J., Burke, W., and Jarvik, G.P. (2015). The FDA and genomic tests–getting regulation right. N. Engl. J. Med.372, 2258–2264.
3. Rehm, H.L., Berg, J.S., Brooks, L.D., Bustamante, C.D., Evans, J.P., Landrum, M.J., Ledbetter, D.H., Maglott, D.R., Martin, C.L., Nussbaum, R.L., et al.; ClinGen (2015). ClinGen–the Clinical Genome Resource. N. Engl. J. Med.372, 2235–2242. 4. Amendola, L.M., Dorschner, M.O., Robertson, P.D., Salama,
J.S., Hart, R., Shirts, B.H., Murray, M.L., Tokita, M.J., Gallego, C.J., Kim, D.S., et al. (2015). Actionable exomic incidental findings in 6503 participants: challenges of variant classifica-tion. Genome Res.25, 305–315.
5. Yorczyk, A., Robinson, L.S., and Ross, T.S. (2015). Use of panel tests in place of single gene tests in the cancer genetics clinic. Clin. Genet.88, 278–282.
6. Richards, C.S., Bale, S., Bellissimo, D.B., Das, S., Grody, W.W., Hegde, M.R., Lyon, E., and Ward, B.E.; Molecular Subcommit-tee of the ACMG Laboratory Quality Assurance CommitSubcommit-tee (2008). ACMG recommendations for standards for interpreta-tion and reporting of sequence variainterpreta-tions: Revisions 2007. Genet. Med.10, 294–300.
7. Karbassi, I., Maston, G.A., Love, A., DiVincenzo, C., Braastad, C.D., Elzinga, C.D., Bright, A.R., Previte, D., Zhang, K., Row-land, C.M., et al. (2016). A Standardized DNA Variant Scoring System for Pathogenicity Assessments in Mendelian Disor-ders. Hum. Mutat.37, 127–134.
8. Thompson, B.A., Spurdle, A.B., Plazzer, J.P., Greenblatt, M.S., Akagi, K., Al-Mulla, F., Bapat, B., Bernstein, I., Capella´, G., den Dunnen, J.T., et al.; InSiGHT (2014). Application of a 5-tiered scheme for standardized classification of 2,360 unique mismatch repair gene variants in the InSiGHT locus-specific database. Nat. Genet.46, 107–115.
9. Goldgar, D.E., Easton, D.F., Byrnes, G.B., Spurdle, A.B., Iversen, E.S., and Greenblatt, M.S.; IARC Unclassified Genetic Variants Working Group (2008). Genetic evidence and integration of various data sources for classifying uncertain variants into a single model. Hum. Mutat.29, 1265–1272.
10. Richards, S., Aziz, N., Bale, S., Bick, D., Das, S., Gastier-Foster, J., Grody, W.W., Hegde, M., Lyon, E., Spector, E., et al.; ACMG Laboratory Quality Assurance Committee (2015). Standards and guidelines for the interpretation of sequence variants: a joint consensus recommendation of the American College of Medical Genetics and Genomics and the Association for Molecular Pathology. Genet. Med.17, 405–424.
11. Biesecker, L.G., Mullikin, J.C., Facio, F.M., Turner, C., Cheru-kuri, P.F., Blakesley, R.W., Bouffard, G.G., Chines, P.S., Cruz, P., Hansen, N.F., et al.; NISC Comparative Sequencing Pro-gram (2009). The ClinSeq Project: piloting large-scale genome
sequencing for research in genomic medicine. Genome Res.
19, 1665–1674.
12. Hayes, A.F., and Krippendorff, K. (2007). Answering the call for a standard reliability measure for coding data. Commun. Methods Meas.1, 77–89.
13. Krippendorff, K. (2004). Reliability in content analysis: Some common misconceptions and recommendations. Hum. Com-mun. Res.30, 411–433.
14. Krippendorff, K. (2004). Content analysis: An introduction to its methodology, Second Edition (Sage).
15. Brennan, R.L., and Prediger, D.J. (1981). Coefficient kappa: Some uses, misuses, and alternatives. Educ. Psychol. Meas.
41, 687–699.
16. Zwick, R. (1988). Another look at interrater agreement. Psy-chol. Bull.103, 374–378.
17. Krippendorff, K. (2013). Bootstrapping Distributions for Krip-pendorff’s Alpha for Coding of Predefined Units: Single-Valued caand multi-valued mva.http://web.asc.upenn.edu/ usr/krippendorff/boot.c-Alpha.pdf.
18. Lin, H.Y., Huang, C.H., Yu, H.C., Chong, K.W., Hsu, J.H., Lee, P.C., Cheng, K.H., Chiang, C.C., Ho, H.J., Lin, S.P., et al. (2010). Enzyme assay and clinical assessment in subjects with a Chinese hotspot late-onset Fabry mutation (IVS4cþ
c919G/A). J. Inherit. Metab. Dis.33, 619–624.
19. Ishii, S., Nakao, S., Minamikawa-Tachino, R., Desnick, R.J., and Fan, J.Q. (2002). Alternative splicing in the alpha-galacto-sidase A gene: increased exon inclusion results in the Fabry cardiac phenotype. Am. J. Hum. Genet.70, 994–1002. 20. Hwu, W.L., Chien, Y.H., Lee, N.C., Chiang, S.C., Dobrovolny, R.,
Huang, A.C., Yeh, H.Y., Chao, M.C., Lin, S.J., Kitagawa, T., et al. (2009). Newborn screening for Fabry disease in Taiwan reveals a high incidence of the later-onset GLA mutation c.936þ
919G>A (IVS4þ919G>A). Hum. Mutat.30, 1397–1405. 21. Casari, G., De Fusco, M., Ciarmatori, S., Zeviani, M., Mora, M.,
Fernandez, P., De Michele, G., Filla, A., Cocozza, S., Marconi, R., et al. (1998). Spastic paraplegia and OXPHOS impairment caused by mutations in paraplegin, a nuclear-encoded mito-chondrial metalloprotease. Cell93, 973–983.
22. Roxburgh, R.H., Marquis-Nicholson, R., Ashton, F., George, A.M., Lea, R.A., Eccles, D., Mossman, S., Bird, T., van Gassen, K.L., Kamsteeg, E.J., and Love, D.R. (2013). The p.Ala510Val mutation in the SPG7 (paraplegin) gene is the most common mutation causing adult onset neurogenetic disease in patients of British ancestry. J. Neurol.260, 1286–1294.
23. Elleuch, N., Depienne, C., Benomar, A., Hernandez, A.M., Fer-rer, X., Fontaine, B., Grid, D., Tallaksen, C.M., Zemmouri, R., Stevanin, G., et al. (2006). Mutation analysis of the paraplegin gene (SPG7) in patients with hereditary spastic paraplegia. Neurology66, 654–659.
24. van Gassen, K.L., van der Heijden, C.D., de Bot, S.T., den Dun-nen, W.F., van den Berg, L.H., Verschuuren-Bemelmans, C.C., Kremer, H.P., Veldink, J.H., Kamsteeg, E.J., Scheffer, H., and van de Warrenburg, B.P. (2012). Genotype-phenotype correla-tions in spastic paraplegia type 7: a study in a large Dutch cohort. Brain135, 2994–3004.
25. Norrgard, K.J., Pomponio, R.J., Swango, K.L., Hymes, J., Rey-nolds, T.R., Buck, G.A., and Wolf, B. (1997). Mutation (Q456H) is the most common cause of profound biotinidase deficiency in children ascertained by newborn screening in the United States. Biochem. Mol. Med.61, 22–27.