Cite this:Soft Matter,2016, 12, 2309
Molecular ordering in the high-temperature
nematic phase of an all-aromatic liquid crystal
†
Francesco Vita,aMaruti Hegde,bGiuseppe Portale,‡cWim Bras,cClaudio Ferrero,d Edward T. Samulski,eOriano Francescangeli*aand Theo Dingemans*b
We report the structural characterization of the nematic phase of 2,6-biphenyl naphthalene (PPNPP). This lath-like all-aromatic mesogen provides a valuable benchmark for classical theories of nematic order. PPNPP exhibits a very high temperature nematic phase (417–489 1C) above an enantiotropic smectic A phase. X-ray diffraction reveals a surprisingly strong tendency towards molecular layering in the nematic phase, indicative of ‘‘normal cybotaxis’’ (i.e.SmA-like stratification within clusters of mesogens). Although stronger at low temperatures, the layering is evident well above the smectic A-nematic transition. The nematic order parameter is evaluated as a function of temperature from the broadening of the wide-angle diffuse diffraction feature. Measured values of the orientational order parameter are slightly larger than those predicted by the Maier–Saupe theory over the entire nematic range except for a narrow region just below the clearing point where they significantly drop below the theoretical prediction.
Introduction
Theories describing the orientational order of nematic (N) liquid crystals have been developed by Onsager,1Flory2and Maier and Saupe.3 These theories are based on rigid, rod- or lath-like molecules. The popular Maier–Saupe (M–S) theory describes the orientational distribution in the N phase in terms of an anisotropic potential between rod-like molecules that stabilizes parallel alignment. The theory is based on a mean field treatment of long-range contributions and ignores short-range forces. In spite of this drastic simplification, the prediction of the temperature dependence of orientational orderhP2iby the M–S theory fits surprisingly well the N phases of many low molecular weight liquid crystals. It was suggested by Luckhurst and
Zannoni4that this qualitative agreement with experiment could be explained by generic aspects of a N phase comprised of locally ordered clusters of molecules persisting above the clearing point into the isotropic (I) phase. At that time this idea was merely an intriguing theoretical speculation, one that was not supported by any experimental evidence. More recently, interest in short-ranged molecular aggregation in N phases (cybotactic clusters)5 has been revived since such clusters of molecules appear to play a crucial role in determining the unusual properties of bent-core nematogens.6,7In this context, an extension of M–S theory that explicitly takes into account the role of cybotactic clusters has been proposed by Droulias et al.8 In bent-core nematics the presence of cybotaxis seems to be a natural consequence of the highly non-linear molecular shape. By contrast, M–S and other classical theories of nematics are predicated on an idealized shape of the mesogens—rigid rods with cylindrical symmetry or rigid flat lath-like shapes.
In an attempt to clarify the relationship between molecular shape, mesophase properties and theoretical predictions, an all-aromatic compound such asp-quinquephenyl (PPPPP, Fig. 1) serves as an ideal model for molecular nematics. Indeed, the PPPPP shape
Fig. 1 Molecular structure and phase map of PPPPP (measured by differential scanning calorimetry), revealing a monotropic SmA phase.12
aDipartimento di Scienze e Ingegneria della Materia, dell’Ambiente ed Urbanistica
and CNISM, Universita` Politecnica della Marche, Via Brecce Bianche, 60131 Ancona, Italy. E-mail: [email protected]
bFaculty of Aerospace Engineering, Delft University of Technology, Kluyverweg 1,
2629 HS Delft, The Netherlands. E-mail: [email protected]
cNetherlands Organization for Scientific Research (NWO), DUBBLE CRG at the
ESRF, 6 rue Jules Horowitz, 38043 Grenoble Cedex, France
d
European Synchrotron Radiation Facility, Boıˆte Postale 220, 38043 Grenoble Cedex, France
eDepartment of Chemistry, University of North Carolina, Chapel Hill,
NC 27599-3290, USA
†Electronic supplementary information (ESI) available: Synthesis, Fourier trans-form infrared spectroscopy (FTIR) and mass spectroscopy (MS) data, DSC scans on heating and cooling. See DOI: 10.1039/c5sm02738a
‡Present address: Macromolecular Chemistry & New Polymeric Materials, Zernike Institute for Advanced Materials, Nijenborgh 4, 9747 AG Groningen, The Netherlands.
Received 6th November 2015, Accepted 11th January 2016
DOI: 10.1039/c5sm02738a
www.rsc.org/softmatter
PAPER
Open Access Article. Published on 19 January 2016. Downloaded on 8/16/2019 6:26:30 PM.
This article is licensed under a
Creative Commons Attribution 3.0 Unported Licence.
conforms to that of a rigid lath with conformationally-averaged cylindrical symmetry. Moreover, PPPPP does not contain polar groups or the flexible terminal chains typical of most low molar mass liquid crystals.9 Therefore, apart from the challenging experimental conditions posed by its very high temperature N phase and predisposition to sublime, PPPPP has been the subject of experimental studies aimed at measuring the temperature dependence of its orientational order.10–12Despite some difficulties related to the orientation of a monodomain sample over macroscopic volumes, birefringence measurements eventually resulted in an observed temperature dependence of hP2i basically in agreement with the M–S prediction.12 Complimenting those findings a full characterization of PPPPP mesomorphism and molecular shape was performed via atomistic molecular dynamics simulations.13 It was reported that the N phase is favored over the smectic (Sm) phase in part because of a certain degree of internal molecular flexibility (both torsional isomerization and bending of the molecular para axis), indicating that PPPPP is not as rigid as expected especially at the elevated temperatures of the N phase.
Herein we report the full structural characterization of a related all-aromatic nematogen, the 2,6-biphenyl naphthalene (PPNPP, Fig. 2). It differs from PPPPP in that the central phenyl ring is replaced by a 2,6-substituted naphthalene resulting in a slight offset in its shape relative to PPPPP, a slightly larger aspect ratio and perhaps, restricted flexibility due to the rigid naphthalene in its core. These features impart a wider N range (albeit at very high temperatures) and the presence of an enantiotropic SmA phase below the N phase; the differential scanning calorimetry (DSC) thermograms (Fig. S3, ESI†) are suggestive of a second order (or very weakly first order) SmA–N phase transition. On heating and cooling a stable SmA phase with a relatively large stability range (DTE301C) below a stable N phase (DT E 72 1C) is observed. By contrast, PPPPP just showed a very narrow (DTE11C) monotropic SmA phase upon cooling.12The melting transition of PPNPP is similar to that of
PPPPP but the N–I transition is 641C higher. DSC performed on PPNPP at a rate of 201C min1revealed supercooling of all phase transitions byB12–151C on cooling.
Experimental
The synthesis and chemical characterization of PPNPP, including DSC scans, can be found in the ESI.†
X-ray diffraction (XRD) measurements were carried out at the BM26B DUBBLE beamline14 of the European Synchrotron Radiation Facility (ESRF), Grenoble, France. A special set-up was used to make temperatures as high asB5001C experimentally accessible. It consisted in a home-made temperature-controlled hot stage, containing a Pt100 thermal probe and connected to a PID digital temperature controller enabling a stability better than 1.51C. The Pt100 probe guarantees very high sensitivity with a low magnetic field dependence. The sample holder was designed to allow insertion into a liquid nitrogen-cooled superconductive magnet. The latter was used to apply a static magnetic field of 2.2 T (measured in air) in a direction perpendicular to the incident X-ray beam, so as to align the long axis molecular directorn.
The energy of the incident beam was 12.0 keV, corres-ponding to a wavelength of 1.03 Å, and the sample to detector distance 188.5 mm. This configuration allowed recording X-ray diffraction both in the low-angle and in the wide-angle region (q= 1–22 nm1). Overall, the set-up resolution was estimated to beDqres= 6102nm1. Samples were placed in sealed quartz capillaries (1 mm diameter); the evolution of their diffraction pattern was studied by changing the temperature stepwise (both on heating and cooling) and allowing the sample to equilibrate at each set point. Because PPNPP sublimates easily, the temperature steps were relatively coarse (51C) in order to keep the measurement time as short as possible. On this scale, we found good agreement between the transition temperature values measured by XRD and DSC (see below). All diffraction patterns were background corrected by subtraction of the diffraction pattern generated by an empty capillary.
Results and discussion
Fig. 3 shows a representative sequence of PPNPP diffraction patterns in the aligned N phase, taken on cooling from the I phase under a vertical magnetic field. The onset of the N phase was observed at 470 1C when the pair of broad isotropic rings typical of the I phase (Fig. 3a) changed into the anisotropic diffraction pattern of the aligned nematic phase (Fig. 3b–f). The latter consists of: (i) a pair of diffuse wide-angle features centered on the equatorial axis (normal ton); (ii) a pair of narrower diffraction arcs centered on the meridional axis (parallel ton) at low angle; (iii) a series of weaker meridional reflections spanning the low-angle to wide-angle region. The transition from the N to the SmA phase was located between 4001C and 3951C, revealed by a narrowing of the low-angle peaks below the resolution limit. A similar sequence was observed on heating.
Fig. 2 Molecular structure and phase map of PPNPP (measured on first heating by DSC; heating rate 201C min1). The microphotographs show
the focal conic texture of the SmA phase at 417 1C and the high temperature nematic phase at 4401C. The dark area in the former picture is a homeotropically-aligned SmA domain.
Open Access Article. Published on 19 January 2016. Downloaded on 8/16/2019 6:26:30 PM.
This article is licensed under a
The diffraction patterns taken on cooling have been analyzed in detail. The intensity profile of the XRD pattern along the meridional direction is shown in Fig. 4. The dominant feature is the above-mentioned low-angle diffraction peak observed at q1= 2.44 nm1, corresponding to ad-spacingd1= 2p/q1= 25.8 Å (at 4001C). This represents the average intermolecular distance in the longitudinal direction and hence provides an estimation of the molecular lengthLwhich is in good agreement with the value expected from molecular modeling (25.34 Å, calculated as 24.34 Å, the distance between the terminal H atoms, plus 20.5 Å, the VDW radius of the two H atoms). We also observe a small increase ofd1with the temperature, up to 27.8 Å at 4701C, perhaps as a consequence of the greater longitudinal disorder. This contrasts with the behavior described by Leadbetteret al.in their classical work on conventional calamitics,15whose flexible aliphatic tails (contrary to the rigid structure of our mesogen) result in contracted conformations at higher temperatures and shorter molecular lengths.
The experimental full width at half maximum (FWHM),Dq, of the low-angle peak (well fitted by a Voigt lineshape) can be
used to estimate the longitudinal positional correlation length
xthrough the relationx= 9.92/Dq*, based on the Hosemann’s paracrystalline model.15HereDq* is the intrinsic FWHM of the (Lorentzian) first order diffraction peak, obtained by correction of the measured Dq for the (Gaussian) experimental set-up broadeningDqres. For a Voigt lineshape it can be obtained by inverting the approximated equation:16
Dq0:5346Dqþ ffiffiffiffiffiffiffiffiffiffiffiffiffiffiffiffiffiffiffiffiffiffiffiffiffiffiffiffiffiffiffiffiffiffiffiffiffiffiffiffiffi0:2166Dq2þDq res2
p
(1)
The results, shown in Fig. 5, indicate a degree of longitudinal correlation varying steadily across the N temperature interval, ranging fromB3Lclose to the clearing point up to a value of
B17Ljust above the SmA–N transition. In the SmA phase the peak FWHM is only slightly larger than the experimental set-up resolution limit, indicating a diverging correlation length (4120L) which would require higher resolution to be accurately evaluated. While the order of magnitude of x in the high temperature N phase is typical of conventional nematogens,15 it becomes unusually large in the low temperature region. This is related to the long-range longitudinal order of the underlying SmA phase and indicates a strong tendency towards molecular layering (cybotactic order) well above the SmA–N transition.
Beside the main peak, another four peaks are identifiable at higherq-values (see inset of Fig. 4), corresponding to the weak meridional reflections visible in Fig. 3b–f. Theq-space positions of their maxima approximate well those expected for higher order reflections (qn = nq1, n = 1, 2,. . .) apart from some distortion
caused by the molecular form factor. For the n = 5 order, an additional distortion is caused by superposition with the tails of the wide-angle equatorial features, as discussed in the following. The transverse positional order has been studied by analyzing the intensity profiles taken along the equatorial direction: Fig. 6 shows representative curves in the aligned N and in the I phase. Here the broad peak centered atB12.5 nm1corresponds to an average transverse intermolecular distance dt varying in the range 4.9–5.3 Å (decreasing with decreasing temperature), a typical value for nematics related to the diameter of an aromatic ring. In the I phase a second peak appears in the low-angle region (see also Fig. 3a), related to a residual intermolecular Fig. 3 XRD patterns of PPNPP recorded on cooling under an aligning
magnetic field (2.2 T, vertical). Only the left wide-angle feature is shown because of the pattern symmetry.
Fig. 4 Intensity profiles of the XRD pattern along the meridional direction at different temperatures (the inset is a zoom on the lower peaks); arrows indicate thed-spacing corresponding to each peak at 4001C.
Fig. 5 Temperature dependence of the longitudinal correlation lengthx
and of its ratio with the molecular length L. The vertical dashed line separates the SmA and the N phases.
Open Access Article. Published on 19 January 2016. Downloaded on 8/16/2019 6:26:30 PM.
This article is licensed under a
longitudinal correlation. By using the same expression used to calculate the longitudinal correlation length, the peak FWHM provides a transverse correlation length decreasing with increasing temperature: 24.6 Å (i.e.,B5dt) at 4001C, 21.7 Å (B4dt) at 4651C, and 15.0 Å (B3dt) in the I phase at 4801C.
Finally, we evaluated the orientational order parameterhP2i by fitting the azimuthal profile of the wide-angle feature, following the method described by Davidsonet al.17According to this approach, the wide-angle equatorial scattering is caused by interference in the radiation transversely scattered within small clusters composed of tens of nearly parallel molecules and its azimuthal broadening originates from the orientational disorder among different clusters. The azimuthal intensity profile I(g) can thus be numerically related to the cluster orientational distribution function (ODF)fd(y), which generally results in a good approximation of the molecular ODFf(y).18 Hereyis the angle formed by (a cluster of) molecules with the molecular director n, while g is the azimuthal angle on the detector measured with respect to the equatorial axis.
Retrieval of fd(y) is simplified if one assumes a Maier– Saupe ODF:
fd(y)Ef(cosy) =Z1emcos
2y
, (2)
where Z is the normalization constant and m the unknown temperature-dependent parameter describing the strength of orientational order within M–S theory. With this assumption, the azimuthal intensity can be fitted by the expression
IðgÞ ¼k e
mcos2g
Zpffiffiffiffimcosg
ffiffiffi
p
p
2 erf ffiffiffiffi m p
cosg
; (3)
withkandmfitting parameters, the former being an intensity scale factor. This allows the evaluation of m, and hence the corresponding ODF, as a function of temperature. Finally, the orientational order parameterhP2ican been calculated as:
P2
h i ¼
ð1
0
P2ðcosyÞfðcosyÞdðcosyÞ; (4)
whereP2is the second-order Legendre polynomial of cosy.
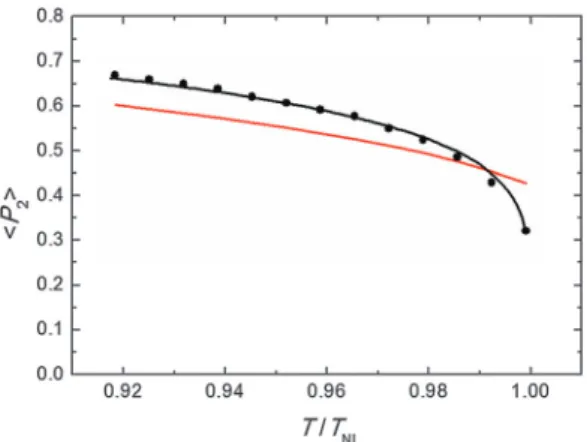
Representative azimuthal profiles (integrated in theq-range 11–14 nm1) and the corresponding fitting curves are shown in Fig. 7 for three temperatures in the N range. The low intensity maximum at 90 deg is due to the fifth order meridional peak which has noticeable intensity in the same q-range as the equatorial reflection. Although this reflection is much weaker than the equatorial crescent, it significantly affects the fitting procedure, especially at the lower temperatures. To get rid of the problem, we fitted the data by using a superposition of two azimuthal scattering functions I(g), one centered at 0 deg (the main peak) and the other one at 90 deg (the secondary peak). In order to limit the number of free parameters, we used two different values ofkfor the two peaks, but a common value ofm. In fact, it seems reasonable that the two peaks are affected in a similar way by orientational disorder. No background was added to the fitting function, as the original images were already background corrected. The agreement with the experi-mental data is very good throughout most of the N phase, although it worsens at low temperature, where the effect of the secondary peak is more noticeable. From themvalues provided by the fits, we could calculate the temperature dependence of the order parameter. The results are shown in Fig. 8 as a function of the reduced temperature T/TNI. As with our measurements we could only determine TNI within a 5 1C interval, its value was established by fitting the experimental data by a Haller-type equation:19
P2
h i ¼ 1 T
TNI
b
: (5)
This providesTNI= 470.70.31C and a critical exponent
b= 0.1650.002. As a comparison, Olivieret al.obtainb= 0.18 from their molecular simulations on PPPPP and compare it with typicalbexperimental values for 5CB in the range 0.17–0.25.13a
Actually, the validity of Haller’s empirical model close to the clearing point is questionable, as it does not account for the weakly first order nature of N–I phase transition. However, we verified that Fig. 6 Intensity profiles of the XRD pattern along the equatorial direction
at different temperatures in the N and in the I phase; arrows indicate the
d-spacing corresponding to each peak.
Fig. 7 Azimuthal intensity profile of the XRD wide-angle feature at three different temperatures (black dots) and the best fit curves (red lines). The order parameter,hP2i, calculated from the fits is: 0.67 at 4101C;
0.62 at 4301C; 0.49 at 4601C.
Open Access Article. Published on 19 January 2016. Downloaded on 8/16/2019 6:26:30 PM.
This article is licensed under a
excluding the highest temperature point from the data set did not significantly affect the value ofb. In Fig. 8 the experimental results are also compared with the order parameter behavior predicted by the M–S theory. Apart from the region very close to the clearing point, our results are slightly larger than M–S curve, although the discrepancy is of the order of our experimental accuracy (estimated to be around 10%;17 the latter is mainly due to the difficulty of an exact subtraction of background and other unrelated diffraction features). On the other hand, our values exhibit a marked decrease in a very narrow region (T/TNI 4 0.99) below the isotropization temperature and depart from the M–S universal prediction of hP2i = 0.43 at the N–I transition. A similar divergence from the expected trend on approaching the I phase is not unusual in the experimental determination of the N order parameter. This has already been reported for PPPPP, when the order parameter has been measured by diamagnetic susceptibility,10 nuclear magnetic resonance (NMR),11and XRD measurements.12In the last case, it was attributed to the macroscopic fluctuations of the molecular director, stronger at high temperature and not completely suppressed by the aligning magnetic field. Although we cannot totally exclude this effect, especially when the sample is on the verge of isotropization, in our case fluctuations are expected to be reduced as we used a magnetic field more than twice that in the previous experiment. Nevertheless, the unequivocal confirmation of the observed reduction trend ofhP2i very close toTNIwould require additional measurements with a thermal stability higher than that allowed by our setup at the challenging experimental conditions.
Conclusions
We have performed a full structural characterization of the N phase of PPNPP. Like the previously studied PPPPP, this all-aromatic compound represents a prototypical embodiment of the ideal ‘‘rigid rod’’ mesogen, the basic ingredient of most of the theories of the N phase. PPNPP is found to show a very
high temperature N phase above an enantiotropic SmA phase. While XRD measurements reveal a lateral ordering very similar to conventional nematics, longitudinal order is characterized by an unusually large correlation length (45L) over most of the N range. This behavior is indicative of cybotactic clusters, nanoscopic-size SmA-like assemblies of stratified molecules persisting in the N phase well above the SmA–N transition.5 While conjectured long ago,4the relevance of cybotactic order in determining mesogen thermodynamic properties has just begun to be elucidated both theoretically8and experimentally.6,7 Our measurements of the orientational order parameter hP2i result in values which are slightly larger than M–S predictions over most of the N range, but significantly lower just below the N–I transition temperature. Higher accuracy data are required to test the significance of the observed deviation from the theoretical models close to the N–I phase transition.
Acknowledgements
The authors acknowledge I. F. Placentino (Universita` Politecnica delle Marche) and D. Hermida Merino (ESRF) for their support during XRD measurements, and BM28-XMaS staff (ESRF) for providing the superconducting magnet. ETS acknowledges support from the Cary C. Boshamer Professorship. The Netherlands Organisation for Scientific Research (NWO) is gratefully acknowledged for making beam time available on the DUBBLE beamlines.
References
1 L. Onsager,Ann. N. Y. Acad. Sci., 1949,51, 627. 2 P. J. Flory,Proc. R. Soc. London, Ser. A, 1956,234, 73. 3 (a) W. Maier and A. Saupe,Z. Naturforsch., 1958,15A, 287;
(b) W. Maier and A. Saupe,Z. Naturforsch., 1959,14A, 882. 4 G. R. Luckhurst and C. Zannoni,Nature, 1977,267, 412. 5 E. T. Samulski,Liq. Cryst., 2010,37, 669.
6 (a) O. Francescangeli, V. Stanic, S. I. Torgova, A. Strigazzi, N. Scaramuzza, C. Ferrero, I. P. Dolbnya, T. M. Weiss, R. Berardi, L. Muccioli, S. Orlandi and C. Zannoni, Adv. Funct. Mater., 2009,19, 2592; (b) O. Francescangeli and E. T. Samulski, Soft Matter, 2010,6, 2413; (c) O. Francescangeli, F. Vita, C. Ferrero, T. Dingemans and E. T. Samulski,Soft Matter, 2011, 7, 895; (d) O. Francescangeli, F. Vita and E. T. Samulski,Soft Matter, 2014,10, 7685.
7 (a) A. Ja´kli,Liq. Cryst. Rev., 2013,1, 65; (b) O. Francescangeli, F. Vita, F. Fauth and E. T. Samulski, Phys. Rev. Lett., 2011,
107, 207801; (c) F. Vita, I. F. Placentino, C. Ferrero, G. Singh, E. T. Samulski and O. Francescangeli,Soft Matter, 2013,9, 6475; (d) T. J. Dingemans, L. A. Madsen, O. Francescangeli, F. Vita, D. J. Photinos, C.-D. Poon and E. T. Samulski,Liq. Cryst., 2013,
40, 1655.
8 S. Droulias, A. G. Vanakaras and D. J. Photinos,Liq. Cryst., 2010,37, 969.
9 T. J. Dingemans, N. S. Murthy and E. T. Samulski,J. Phys. Chem. B, 2001,105, 8845.
Fig. 8 Orientational order parameter as a function of the reduced temperature: measured values (black dots), fitting by Haller equation (eqn (5), black line), and theoretical prediction from M–S theory (red line). For the last we have used the approximated expressionhP2i= (1–0.98T/TNI)0.22,
assuming a temperature independent molar volume.20
Open Access Article. Published on 19 January 2016. Downloaded on 8/16/2019 6:26:30 PM.
This article is licensed under a
10 P. L. Sherrell and D. A. Crellin,J. Phys., 1979,40, C3–C211. 11 T. J. Dingemans, L. A. Madsen, N. A. Zafiropoulos, W. B. Lin and E. T. Samulski,Philos. Trans. R. Soc. London, Ser. A, 2006,
364, 2681.
12 S. Kuiper, B. Norder, W. Jager, T. J. Dingemans, J. van Turnhout and S. J. Picken,J. Phys. Chem. B, 2011,115, 1416.
13 (a) Y. Olivier, L. Muccioli and C. Zannoni,ChemPhysChem, 2014,15, 1345; (b) C.-D. Poon,et al., unpublished results. 14 W. Bras, I. P. Dolbnya, D. Detollenaere, R. van Tol, M. Malfois,
G. N. Greaves, A. J. Ryan and E. Heeley,J. Appl. Crystallogr., 2003,36, 791.
15 A. J. Leadbetter, R. M. Richardson and C. N. Colling,J. Phys., 1975,36, C1–C37.
16 J. J. Olivero and R. L. Longbothum, J. Quant. Spectrosc. Radiat. Transfer, 1977,17, 233.
17 P. Davidson, D. Petermann and A. M. Levelut,J. Phys. II, 1995,
5, 113.
18 M. Deutsch,Phys. Rev. A: At., Mol., Opt. Phys., 1991,44, 8264. 19 I. Haller,Prog. Solid State Chem., 1975,10, 103.
20 W. H. de Jeu,Physical properties of liquid crystalline mate-rials, Gordon and Breach Science Publishers, New York, 1980.
Open Access Article. Published on 19 January 2016. Downloaded on 8/16/2019 6:26:30 PM.
This article is licensed under a