METABOLIC CHARACTERIZATION OF OVERWEIGHT AND OBESE ADULTS
Katie Rose Hirsch
A thesis submitted to the faculty at the University of North Carolina at Chapel Hill in partial fulfillment of the requirements for the degree of Master of Arts in the Department of Exercise
and Sport Science (Exercise Physiology).
Chapel Hill 2016
Approved by:
Abbie E. Smith-Ryan Eric D. Ryan
iii ABSTRACT
Katie Rose Hirsch: Metabolic characterization of overweight and obese adults (Under the direction of Abbie E. Smith-Ryan)
iv
ACKNOWLEDGMENTS
v
TABLE OF CONTENTS
LIST OF TABLES ... viii
LIST OF FIGURES ... ix
LIST OF ABBREVIATIONS ... x
CHAPTER I ... 12
INTRODUCTION ... 12
Purpose ... 16
Research Questions ... 16
Research Hypothesis ... 17
Delimitations ... 18
Limitations ... 18
Assumptions ... 18
Theoretical ... 18
Statistical ... 19
Definition of Terms ... 19
Significance of Study ... 21
vi
REVIEW OF LITERATURE ... 22
Introduction ... 22
Body Composition ... 23
Energy Expenditure ... 26
Conclusion ... 28
CHAPTER III ... 30
METHODOLOGY ... 30
Subjects... 30
Experimental Design ... 31
Body composition ... 32
Visceral Adipose Tissue ... 34
Resting metabolic rate ... 35
Blood Lipid and Hormone Analysis ... 35
Salivary Hormone Analysis ... 36
Steady-state cardiorespiratory assessment ... 36
Statistical Analysis ... 37
CHAPTER IV ... 40
RESULTS ... 40
Body Composition ... 40
vii
Lean Mass ... 41
Percent Body Fat ... 42
Visceral Adipose Tissue ... 43
Metabolic Rate... 44
Lipids and glucose ... 46
Hormones ... 47
Regression Analysis ... 48
CHAPTER V ... 51
DISCUSSION ... 51
TABLES ... 60
FIGURES ... 63
viii
LIST OF TABLES
ix
LIST OF FIGURES
Figure 1: CONSORT flow diagram ... 63
Figure 2: Experimental timeline. ... 64
Figure 3: Measurements of VAT ... 65
Figure 4: Resting metabolic rate ventilated canopy with indirect calorimetry. ... 66
Figure 5: Five females with LMI>97th percentile compared with the female group average ... 67
x
LIST OF ABBREVIATIONS
BIS Bioelectrical impedance spectroscopy BMC Bone mineral content
BMI Body mass index
BV Body volume
BM Body mass
CT Computed topomyography
CVD Cardiovascular disease
DEXA Dual-energy x-ray absorptiometry
FM Fat mass
GLUC Blood glucose
HDL High density lipoproteins
HR Heart rate
HRmax Maximum heart rate
HRrest Resting heart rate
HRR Heart rate reserve
ICC Intraclass correlation coefficient LDL Low density lipoproteins
LM Lean mass
LMI Lean mass index
MD Minimum difference
xi RER Respiratory exchange ratio
RERrest Respiratory exchange ratio at rest
RERbike Respiratory exchange ratio during the steady-state cardiorespiratory assessment
RMR Resting metabolic rate SEM Standard error of measure TBW Total body water
TC Total cholesterol TRG Triglycerides US B-mode ultrasound VAT Visceral adipose tissue
VATDEXA Visceral adipose tissue measured via dual-energy x-ray absorptiometry VATUS Visceral adipose tissue measured via B-mode ultrasound
4C Four-compartment model
ΔRER Change in respiratory exchange ratio; difference between RERbike and RERrest
12 CHAPTER I INTRODUCTION
Metabolic syndrome is a chronic disease characterized by the presence of multiple risk factors that indicate metabolic dysfunction [1]. Many of these risk factors, such as insulin resistance and dyslipidemia, are also associated with an increased risk for the development of cardiovascular disease (CVD) and type 2 diabetes [1, 2]. Currently, over two-thirds of adults in the United States are considered overweight or obese [3]. Of these individuals, an estimated 50% of overweight and about 70% of obese adults have at least two metabolic risk factors [4] placing a majority of the population at an increased risk for chronic diseases [4, 5]. The
13
adipose tissue (VAT), lean mass (LM), resting metabolic rate (RMR), fuel utilization at rest and during exercise, and hormonal profiles, may give a more complete picture of metabolic health in overweight and obese adults, improving approaches to early identification of metabolic
dysfunction.
Regional distribution of body fat, or where an individual stores their body fat, may be more highly associated with an increased risk of metabolic dysfunction, than the overall presence of excess body fat [10, 12]. Previous studies have shown that high VAT, fat located within the abdominal cavity around the organs, is more significantly related to insulin resistance as opposed to subcutaneous adipose tissue [12, 13]. In a study by Brochu et al. (2001), insulin resistance was more prevalent in obese women with greater VAT when matched for total body and abdominal subcutaneous fat. Further, in the absence of excess body fat, normal weight
individuals with increased VAT, also demonstrate a greater prevalence of insulin resistance [12]. The strong association between VAT and insulin resistance has resulted in VAT being regarded as more harmful to metabolic health. However subcutaneous fat may still have a significant impact on metabolic regulation. Subcutaneous adipose tissue not only serves as a storage location for excess energy, but it also serves as an important endocrine organ [14]. Previously shown to be related to the production and balance of metabolic hormones, excess subcutaneous fat may lead to hormonal imbalances that promote metabolic dysfunction [15]. Leptin
14
levels often have no associated changes in FM and energy expenditure, potentially symbolizing leptin resistance [18]. Despite its potential physiological function, the role of leptin in energy expenditure is not completely understood. There is some recent speculation that there may be an inhibitory relationship between insulin and leptin, with high insulin levels blocking the leptin signal and promoting energy storage [19]. It has also been theorized that high leptin levels may increase RMR, but this relationship has not yet been observed in humans [20, 21]. Other hormones that have associations with fat distribution are estrogen and cortisol. Estrogen has been shown to influence fat distribution by increasing gynoid and subcutaneous fat accumulation [12, 15, 22]. Low estrogen levels in obese women are associated with increases in VAT, while high levels estrogen in obese men may have similar consequences [23-25]. In contrast, cortisol, commonly associated with an elevated stress response, has been shown to be associated with greater body fat and VAT, which over time could lead to changes in substrate metabolism and insulin resistance [26-28]. Evaluation of hormonal profiles in relation to fat distribution may be an important indicator of metabolic health in the absence of traditional markers. Fat distribution is typically evaluated in clinical settings using waist circumference measurements, which do not differentiate between visceral and subcutaneous distribution. Recently validated techniques such as ultrasonography (US) may be a feasible option for clinical evaluation of abdominal fat
distribution, but further evaluation of its clinical utility is needed.
15
decreases in RMR, insulin resistance, and poor functionality [30], all of which are associated with weight gain. Lean mass may also be important in fuel utilization and maintaining metabolic flexibility. At rest, a healthy individual typically derives a greater portion of their energy from fat oxidation. During exercise or after eating a meal with a reasonable amount of carbohydrates, carbohydrate oxidation increases to match the greater energy demand. Impaired fat oxidation at rest and chronic reliance on carbohydrate oxidation is a sign of metabolic dysfunction and is considered to be a risk factor for weight gain [28, 31]. The metabolic consequences of low LM, and conversely the potential benefits of greater LM, supports the importance of evaluating LM in obese populations.
In order to gain a better understanding of metabolic health in overweight and obese adults, better characterization of this population is necessary. Insulin resistance and dyslipidemia are an indication of metabolic dysfunction, but in their absence, other factors may be a sign of a developing dysfunction. Better characterization of fat distribution and its relation to adipose related hormones, like insulin, leptin, estrogen, and cortisol may give further insights into the metabolic consequences of hormonal imbalance. Differences in fat distribution, especially between males and females, may have different effects on hormonal balance and metabolic regulation, which could serve as a risk factor for development of metabolic syndrome. Further, consideration of LM, RMR, and fuel utilization determined from respiratory exchange ratio (RER) at rest (RERrest) and during steady-state exercise (RERbike) in relation to FM, percent body
16 Purpose
1. The primary purpose of this study was to characterize metabolic health in overweight and obese adults by evaluating body composition (FM, LM, %fat, VAT), RMR, RERrest,
RERbike, glucose, lipids, and hormones (insulin, leptin, estrogen, cortisol).
a. A component of this purpose assessed the relationships between these variables, as well as differences between overweight and obese.
2. A secondary purpose of this study was to evaluate sex differences between body composition (FM, LM, %fat, VAT), RMR, RERrest, RERbike, glucose, lipids, and
hormones (insulin, leptin, estrogen, cortisol).
a. A component of this purpose assessed sex differences, while also accounting for dietary intake and LM.
3. A tertiary purpose of this study was to assess how well variances in non-standard factors of metabolic health (FM, LM, %fat, VAT, RMR, RERrest, RERbike, ΔRER), were
explained by standard clinical measures of metabolic health (glucose, lipids, insulin, leptin, estrogen, cortisol).
a. A component of this purpose assessed how well variances in non-standard factors of metabolic health were explained by standard clinical measures of metabolic health, including VAT as a potentially feasible clinical factor.
Research Questions
1. Is there a relationship between total and regional body composition, RMR, RERrest,
RERbike, glucose, lipids, and hormones in overweight and obese adults?
17
3. Are there differences in total and regional body composition, RMR, RERrest, RERbike,
glucose, lipids, and hormones between overweight and obese adults?
4. Are there differences in RMR, RERrest, RERbike, glucose, lipids, and hormones between
men and women, when accounting for dietary intake and body composition? 5. Will variances in total and regional body composition, RMR, RERrest, RERbike, and
ΔRER be explained by blood and hormonal markers of metabolic health?
6. Are there differences in relationships between VAT and markers of metabolic health when measured via B-mode US or dual-energy x-ray absorptiometry (DEXA)? Research Hypothesis
1. Fat mass, %fat, and VAT would be positively correlated and LM would be negatively correlated with compromised lipid levels (plasma triglycerides, HDL) and hormonal profiles (insulin, leptin, estrogen, cortisol).
2. Fat mass, %fat, and VAT would be negatively correlated and LM would be positively correlated with RMR; FM, %fat, and VAT would be positively correlated and LM would be negatively correlated with RER.
a. There would be a significant relationship between leptin levels, RMR, RERrest,
and RERbike.
3. There would be differences in RMR, RERrest, RERbike, glucose, lipids, between men and
18 Delimitations
1. Subjects were between the ages of 18-55 years.
2. Healthy men and pre-menopausal women were recruited.
3. Subjects had a BMI of 25-52 kg∙m-2 and/or body fat percentage between 25-53%.
4. Subject were not taking any dietary supplements or using a meal replacement. 5. Subjects were not consuming a low-carbohydrate or ketogenic diet.
6. Body composition was measured by 4-compartment model. 7. Visceral adipose tissue was measured by B-mode US and DEXA. 8. Insulin, leptin, and lipid levels were measured from a blood draw.
9. Estradiol and cortisol concentrations were measured from a saliva sample. 10. Indirect calorimetry was used to measure RMR, RERrest and RERbike.
Limitations
1. Visceral adipose tissue was measured using US, rather than computed tomography (CT) scan which is considered the gold standard.
2. Indirect calorimetry was used to measure RMR, RERrest and RERbike, rather than direct
calorimetry which is considered the gold standard.
3. A cross-sectional design will characterize overweight and obese individuals at a single point in time, but does not allow for evaluation of potential risk factors over time. Assumptions
Theoretical
19
Statistical
1. The population from which the sample was taken was normally distributed. 2. The sample variability was equal.
Definition of Terms
Overweight – having a BMI of 25-29.9 kg·m-2
Obese – having a BMI of 30-45 kg·m-2
Fat mass (FM) – all extractable lipids that can be extracted from adipose and other tissues [32].
Lean mass (LM) – all residual lipid-free chemicals and tissues including water, muscle,
connective tissue, organs, and bone [32].
Percent body fat (%fat) – fat mass expressed as a percentage of total body weight
Total body volume [33] – estimate of body size and density using air displacement [32].
Total body water (TBW) – a measure of the intracellular and extracellular fluid compartments of
the body estimated using bioelectrical impedance spectroscopy [32].
Total body bone mineral density (Mo) – a measure of the bone mineral content of the body
estimated using dual-energy x-ray absorptiometry [32].
Body Mass (BM) – body weight measured in kilograms [32].
Visceral adipose tissue (VAT) – intra-abdominal adipose tissue; quantified as a measurement of
adipose tissue that exists between the interior border of the rectus abdominis and the posterior wall of the aorta [34-36].
Estradiol – a female sex hormone; measured using a salivary estradiol ELISA kit (pg/mL)
Cortisol – glucocorticoid involved with maintaining blood glucose; free cortisol concentrations
measured using a salivary cortisol ELISA kit (µg/dL).
20
Total cholesterol – measure of all cholesterol in the blood (mg/dL)
Triglycerides – measure of fats in the blood (mg/dL)
HDL – high density lipoproteins in the blood (mg/dL)
LDL – low density lipoproteins in the blood (mg/dL)
LMI – Lean mass index (LM[kg]/m2)
Insulin – hormone promoting glucose uptake from the blood (uIU/mL)
Leptin – adipose hormone signaling energy stores (ng/mL).
Maximum Heart Rate (HRmax) – estimate of the greatest number of beats per minute that can be
achieved by the heart (220-age)
Heart Rate Reserve (HRR) – difference between maximum heart rate and resting heart rate used
to prescribe exercise intensities;Karvonen formulaHRR = [HRmax - HRrest] x %intensity
+ HRrest
Resting metabolic rate (RMR) – energy expended while at rest in a supine position, but still
awake, as measured using indirect calorimetry (kcal/day) [37].
Respiratory exchange ratio (RER) – a measure of fuel utilization that uses aratio of carbon
dioxide expired to volume of oxygen consumed to estimate the contribution of fat and carbohydrate to energy expenditure at rest and during submaximal exercise.
Respiratory exchange ratio at rest (RERrest) - Respiratory exchange ratio measured during a
resting state.
Respiratory exchange ratio during steady-state (RERbike) – Respiratory exchange ratio during a
steady-state cycle ergometer bout.
Change in respiratory exchange ratio during steady-state (ΔRER) – Change in respiratory
21 Significance of Study
22 CHAPTER II
REVIEW OF LITERATURE
Introduction
There is a well-established association between obesity and an increased risk of chronic diseases, such as cardiovascular disease, type II diabetes, and metabolic syndrome [4, 5]. Metabolic syndrome is a disease defined by the presence of three or more risk factors related to an increased risk of cardiovascular disease, which include: abdominal obesity (waist
circumference: men>102 cm; women>88 cm), elevated triglycerides (≥150 mg/dl), low HDL cholesterol (men<40 mg/dl; women<50 mg/dl), high blood pressure (≥ 130/85 mm/Hg), and elevated glucose (≥110 mg/dl) [1]. Obese individuals (BMI ≥ 30 kg/m2) have been shown to
have the highest prevalence of metabolic syndrome [8, 13], likely related to complications associated with high amounts of adiposity. Increased FM and a higher %fat is associated with decreased insulin sensitivity [9, 12, 38], and poor lipid profiles, primarily high plasma
triglycerides and low HDL [13]. Despite short term success at weight loss, 33.5% of individuals will regain weight after only one year [6]. The prevalence of obesity and the inability to
23 Body Composition
Many studies use insulin sensitivity as the primary defining factor of metabolic health due to the association of insulin resistance with the development of type 2 diabetes,
hypertension, and cardiovascular disease [5, 39]. Excess adiposity, especially in the abdominal region, has been shown to be associated with insulin resistance and poor lipid profiles. In a study by Brochu et al (2001), obese postmenopausal women who were insulin resistant had significantly more VAT than women who were insulin sensitive when matched for whole body FM and abdominal subcutaneous fat. In the same study, VAT was also found to be an
independent predictor of both insulin sensitivity and fasting plasma triglyceride concentrations. Other studies have reported similar findings with higher amounts of VAT being associated with insulin resistance and poor lipid profiles [11]. In contrast, other studies have demonstrated associations with subcutaneous fat [40]. Discrepancies may be the result of population and sex differences, as well as the method used for evaluation of body composition. Computed
24
There is a growing body of research focusing on the hormonal profile of obesity and metabolic dysfunction. Hormones such as adiponectin, resistin, leptin, and ghrelin are important hormones involved in the regulation of appetite and energy balance [18, 44]. Leptin in particular is produced by adipose tissue as an indication of long term energy stores (body fat). While details of the leptin mechanism are not completely understood, high levels of circulating leptin activates receptors on the hypothalamus. This triggers an endocrine response that promotes metabolic rate and initiates satiety. In contrast, low leptin levels signal a lack of energy or starvation, triggering an endocrine response that promotes energy storage [18, 44]. Disruptions to this feedback loop, have been shown to result in increased FM and appetite in obese
individuals, attributed to leptin deficiency or leptin resistance. While leptin levels are positively correlated with BMI and %fat [16, 21, 45, 46], a wide range of concentrations have been
25
also thought to influence fat distribution with estrogen concentrations showing greater associations with subcutaneous fat accumulation in women [12, 48]. Like estrogen, elevated cortisol levels may promote VAT accumulation which could lead to insulin resistance [26, 27]. Cortisol is a stress related hormone that helps maintain blood glucose levels. Stressors include diet, exercise, environmental stress, emotional stress, and sleep deprivation [26]. High cortisol levels have been observed in association with greater amounts of VAT [27], but it is still unclear if elevated cortisol promotes VAT accumulation or vice versa [49].
26
FM making it more adaptable. Increasing LM may be a more effective approach to changing body composition that would also lead to improvements in other areas of metabolic health, such as hormonal profiles and energy expenditure. The characterization of whole body and regional LM in overweight and obese populations in relation to specific hormones is needed in order to better understand metabolic health in this population.
Energy Expenditure
In its most basic definition, obesity is the result of energy imbalance. When energy intake exceeds energy expenditure, weight gain typically ensues [53]. Energy expenditure has four components: RMR, thermic effect of food, non-exercise adaptive thermogenesis, and
physical activity energy expenditure [54]. Alterations in body composition and hormonal profile may cause changes in RMR that could promote weight gain and resistance to weight loss.
Resting metabolic rate accounts for the largest caloric requirements of energy expenditure [55]. A lower RMR is often associated with weight gain [53] and is highly
27
support for this relationship. Leptin has been shown to influence RMR in mice [57], while most human studies to date show no relationship between circulating leptin levels and metabolic rate [29]. Estrogen may also have effects on metabolic rate. Resting metabolic rate has been shown to vary considerably with the menstrual cycle [58], an important factor to consider when
characterizing metabolic health in premenopausal women.
Fuel utilization, or the contribution of fat and/or carbohydrate being used as the primary fuel source at rest and during exercise may also be an important factor in weight regulation. Respiratory exchange ratio is the ratio of carbon dioxide production to oxygen consumption used to estimate substrate oxidation by way of indirect calorimetry [59]. An RER of 0.7 indicates primarily fat oxidation, while an RER of 1.0 indicates primarily carbohydrate oxidation, with a combination of the two falling within that range [59]. Diet seems to have the strongest impact on RER [60], with carbohydrate reliance increasing with chronic overfeeding, regardless of fat and carbohydrate content [61]. Larson et al. (1995) found that formerly obese individuals had significantly higher 24-hour and resting RER than normal weight subjects, indicating a chronic reliance on carbohydrate as a fuel source [62]. Kelley et al. (1999) also found obese individuals to have high glucose uptake and oxidation at rest, with little to no changes observed after
feeding. The lack of change in fuel utilization from rest may be an indication that obese
28
date, the relationship of total and regional body fat and RER in overweight and obese men and women has not been fully explored.
Conclusion
There is growing evidence that obesity is a multifaceted issue, with interconnected factors related to body composition, metabolic rate, fuel utilization, and hormonal balance. The complications and potential factors that should be considered when evaluating the metabolic health of an obese individual extends far beyond what can be determined from a BMI category. In order to critically assess the impact excess body fat and altered body composition has on other aspects of metabolic health, the most sophisticated measurement techniques must be utilized. Using a 4C model to assess body composition provides a more accurate measure of FM, LM, and %fat over BMI, by accounting for additional compartments such as water and bone [68]. This level of precision provides a stronger basis from which to assess relationships of total body and regional fat distribution and LM with other aspects of metabolic health. Further, US and DEXA are both validated techniques for evaluating VAT, which has important implications for clinical evaluation of metabolic health risk factors. Specifically, US may be a feasible option for VAT quantification related to its portability and availability in many clinical settings, but the clinical utility requires further evaluation.
29
30 CHAPTER III METHODOLOGY
Subjects
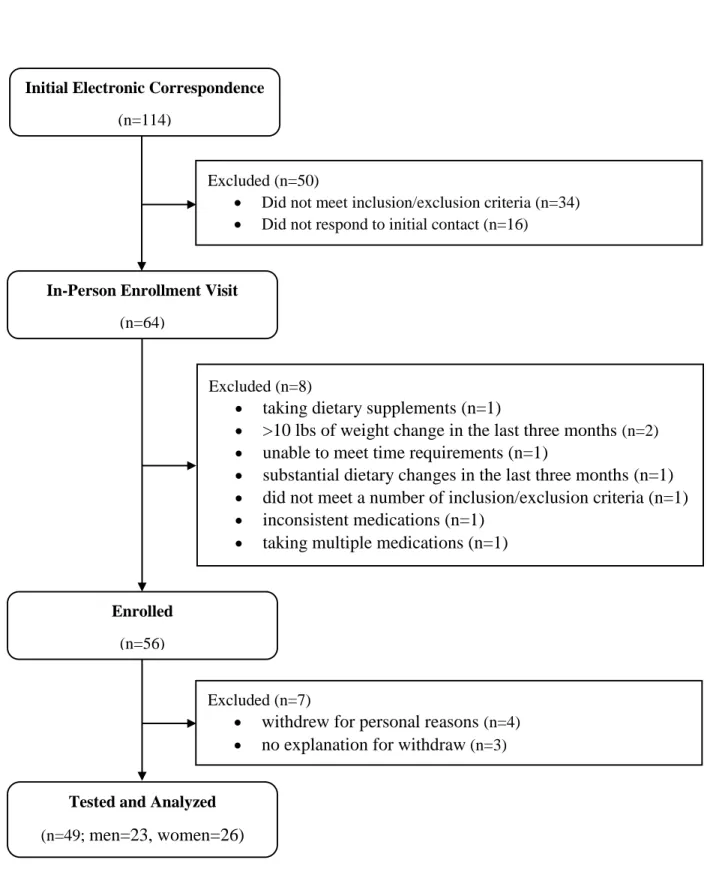
Approximately 114 individuals provided initial interest in study participation. After electronic correspondence, 64 individuals qualified to complete in-person inclusion/exclusion review. After the in-person enrollment visits, eight individuals were excluded from participation based on violation of inclusion/exclusion criteria, resulting in a cohort of 56 individuals enrolled in the study. An additional seven individuals withdrew from participation prior to testing for personal reasons. Therefore, forty-nine overweight and obese men (n=23) and women (n=26) between the ages of 18 and 55 years participated in this study (Mean ± SD; Age=35.0 ± 8.9 yrs; BMI=33.6 ± 5.2 kg·m-2; %fat= 40.0 ± 7.3; Race: White=32; Black=13; Hispanic=2; Asian=2). Full subject characteristics stratified by sex can be found in Table 1. Full recruitment and enrollment can be found in Figure 1. All subjects were healthy, as reported on the health history questionnaire, having no history of medical or surgical events that may have significantly
affected study outcome, including cardiovascular disease, diabetes, renal, hepatic, or musculoskeletal disorders. Women were categorized as pre-menopausal, determined as
31
to participate in the study if they report using a meal replacement or dietary supplements including whey protein, beta-alanine, creatine, carnosine, or taurine within eight weeks prior to enrollment. Subjects consuming a low-carbohydrate or ketogenic diet at the time of enrollment excluded from participation. Subjects were not allowed to participate in the study if they have participated in another clinical trial within four weeks prior to enrollment. Subjects agreed to maintain their usual activity lifestyle, abstain from smoking, caffeine, tobacco, and alcohol before testing days, provide written and dated informed consent, and were willing and able to comply with the testing protocol.
Experimental Design
In a cross sectional design, subjects reported to the Applied Physiology Laboratory in Fetzer Hall to complete three different testing sessions (Figure 2). Subjects were recruited from Chapel Hill, Raleigh, Durham, and the surrounding area by the use of flyers and word of mouth. Subjects who expressed interest in participating in the study were sent an electronic copy of the informed consent and a 4-day dietary intake log in which to record their dietary intake on two weekdays and two weekend days. The dietary log, which is a standardized log used to obtain dietary information, was completed prior to visit one to allow time for dietary analysis. During the first visit (enrollment), subjects provided written informed consent, completed a health history questionnaire, and completed anthropometric measures of height (cm; stadiometer: Perspective Enterprises, Portage, MI), weight (kg; digital scale: Health o meter: 2101KL,
32
Healthy Eating Plate. Following consent and enrollment, a two-week run in period, followed by a 24-hour dietary log, separated visit one and visit two in order to allow dietary intake to
normalize. To ensure normalization, the 24-hour dietary log recorded everything that was consumed during the 24 hours prior to visit two and was compared to intake reported from the 4-day log. Visit two consisted of measures of body composition, RMR, RERrest, and blood and
salivary samples. All tests were performed first thing in the morning. Subjects arrived at least eight hours fasted (consuming no food or beverage except for water) wearing light-weight clothing; all metal and heavy plastic that could interfere with body composition measurements were removed. Visit three consisted of a steady-state cardiorespiratory assessment. Subjects arrived at least four hours fasted to visit three. Visits two and three were separated by 24 hours (±72 hours). All devices were calibrated to manufacturer standards prior to testing to ensure valid results.
Body composition
Fat mass, LM, and %fat were calculated using a 4C model described by Wang et al. (2002) (Equation 1), where BV is total body volume, TBW is total body water, Mo is total body bone mineral density, and BM is body mass measured in kilograms [68].
Equation 1: FM (kg) = 2.748(BV) – 0.699(TBW) + 1.129(Mo) – 2.051(BM) %fat = (FM/BM) × 100
LM (kg) = BM – FM
33
Air-displacement plethysmography (BodPod®, COSMED USA, Inc., Concord, CA, USA) was used to determine BV and BM. In a private room, the subjects were asked to wear tight fitting clothing, such as a bathing suit or spandex, and given a swimming cap to wear on their head. Identification code, age, sex, ethnicity, height (cm) and weight (kg), as measured using the scale connected to the device, were entered into the computer using the devices default software (Software Version 5.4.1, COSMED USA, Inc.). Subjects were then asked to enter the BodPod®, breathe normally, and remain still for the duration of the test.
Bioelectrical impedance spectroscopy (BIS; SFB7, ImpediMed, Queensland, Australia) uses a low voltage electrical current to estimate TBW. Following manufacturer
recommendations for preparation and placement, subject were asked to lie supine on a table with separation between the limbs. Leads were connected to four electrodes placed on the right wrist (bisecting the ulnar head), five centimeters distally on the hand, the right ankle (bisecting the malleoli), and five centimeters distally on the foot. The subject was instructed to lie still and breathe normally during the test. This device scans 256 frequencies between the ranges of 4 and 1000 kHz. The average of two measurements was recorded for TBW.
Dual-energy x-ray absorptiometry (DEXA; GE Lunar iDXA, GE Medical Systems Ultrasound & Primary Care Diagnostics, Madison, WI, USA) was used to estimate total body bone mineral content (BMC) and calculate Mo (Mo = BMC (kg) × 1.0436). Total body scans were performed by trained DEXA technicians using default software (enCORE Software
34
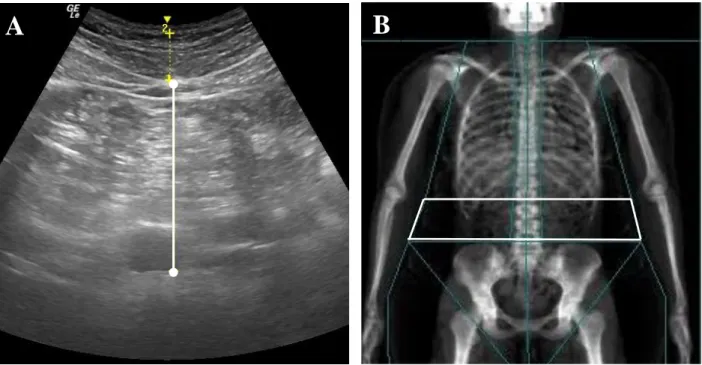
wider than the scanning parameter (n= 6), the subject was shifted left-of-center to ensure a full scan of the right side of the body and left limbs were estimated from the right limbs, as suggested by the manufacturer. Once positioned, a strap was secured around the ankles for comfort and subjects were instructed to lie still and breathe normally for the duration of the scan (7-13 min). Visceral Adipose Tissue
Brightness-mode (B-mode) ultrasound (US) (GE LOGIQ-e, Software version R8.0.7, GE Healthcare, Wisconsin, USA) with standardized settings (Frequency: 4.0 MHz, Gain: 45) was used to quantify VAT. While lying supine, a wide-band convex array ultrasound transducer (GE: C1-5 RS) with transducer gel was applied to the abdomen at the site of the linea alba, 5 cm proximal to the umbilicus. The depth of the scan was adjusted as necessary to ensure full image capture of visceral adiposity. Once positioned, the subject was asked to take a deep breath in, followed by a relaxed breath out; a still image of the abdomen was captured at the moment of complete exhale. Visceral adipose tissue from the US (VATUS) was defined and quantified as the perpendicular distance between the interior border of the rectus abdominis and the posterior wall of the aorta [35]. The average of two measurements were recorded as VATUS. Test-retest reliability for VATUSproduced an ICC=0.99, SEM=0.35 cm, and minimum difference
(MD)=0.69 cm.
35 Resting metabolic rate
Resting metabolic rate and RERrest were evaluated using a ventilated canopy with indirect
calorimetry. Prior to measurements, the hood was calibrated to manufacture’s standards with a gas mixture of known concentrations of oxygen and carbon dioxide. While lying in a supine position, subjects were fitted with the ventilated canopy. The canopy was placed over the subjects head and secured comfortably around the neck and arms, ensuring that no air could penetrate the sealed canopy. Subjects were asked to relax and breathe normally for 30 minutes. Respiratory gases, oxygen uptake, and carbon dioxide production, were analyzed breath-by-breath with a metabolic cart (TrueOne 2400, ParvoMedics, Inc., Sandy, UT). During the first five minutes of the test, the dilution rate was adjusted until the fraction of expired carbon dioxide was between 1.0-1.2%. This portion of the test was excluded to account for normalization and the mean RMR and RERrest were recorded from the remaining 25 minutes of the test. Test-retest
reliability for RMR from our lab produced an ICC=0.94, SEM=125.6 kcal·day-2 and MD=244.3 kcal·day-2, and RERrest was ICC=0.83, SEM=0.03 and MD=0.05.
Blood Lipid and Hormone Analysis
36 Salivary Hormone Analysis
A 1.0-2.0 ml saliva sample was obtained and analyzed for estradiol and cortisol concentrations. To avoid blood contamination, subjects avoided brushing their teeth for 45 minutes prior and undergoing dental work for 48 hours prior to sample collection. Immediately upon arrival and prior to sample collection, subjects rinsed their mouth with water to remove any residues. All samples were kept frozen at -20°C until analysis. Samples were analyzed by the Biobehavioral Lab (Chapel Hill, NC) using established enzymatic assays.
Steady-state cardiorespiratory assessment
A steady-state cardiorespiratory assessment was used to evaluate RER during exercise (RERbike). Once fitted with HR monitor and connected via breathing tube to an indirect
calorimetry system (TrueMax 2400, Parvo Medics, Salt Lake City, UT), individuals were allowed a three minute warm-up on a cycle ergometer (Lode, Gronigen, The Netherlands) at a self-selected speed and workload of 20W. After three minutes, the workload was manually increased until heart rate (HR) correlated to 50-60% heart rate reserve (HRR). Once HR was within five beats per minute of the target HRR, respiratory gases were analyzed breath-by-breath via open-circuit spirometry for 20 minutes to measure RERbike. Heart rate was monitored
throughout the test using a Polar heart rate monitor (Polar FT1, Polar USA, Port Washington, NT, USA) and workload was adjusted throughout the test as necessary to maintain 50-60% HRR. Heart rate reserve was calculated using the Karvonen formula (HRR = [HRmax – HRrest] x
%intensity + HRrest)where HRmax is age predicted maximal HR (HRmax = 220 – age) and HRrest is
37 Statistical Analysis
This study was a portion of a larger study assessing the effects of a breakfast meal replacement on body composition and metabolic characteristics of overweight and obese adults. Power calculations for this study were conducted using nQuery version 7.0. Using mean and standard deviation values from a similar population [70], a sample of 50 subjects was
determined, providing a power of at least 80% for a repeated measures ANOVA with
significance of α = 0.05. This sample size also accounted for a loss of a predicted five subjects (10%). Power calculations for the larger study were calculated for a higher order statistical calculation and provide sufficient power (>80%) for the current study.
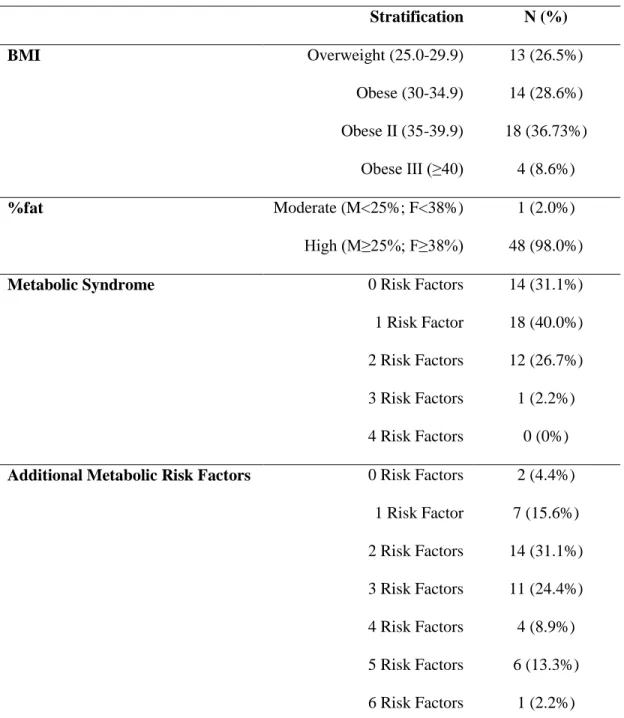
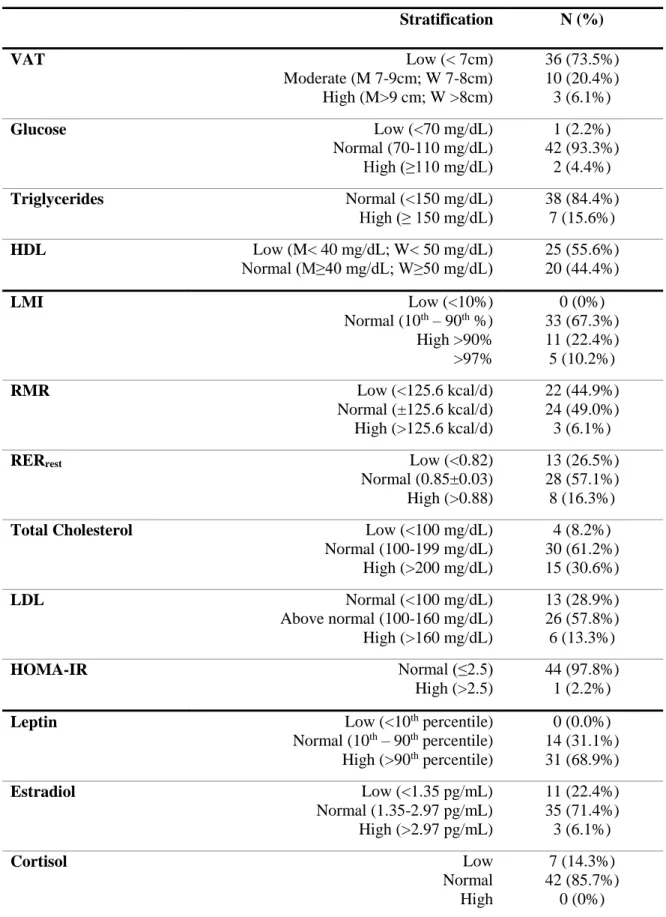
To characterize metabolic health, each metabolic variable was stratified into categories associated with accepted reference ranges. Frequency rates for each category were calculated within each variable. Individuals were categorized as overweight (25-29.9 kg·m-2), obese
(30-34.9 kg·m-2), obese II (35-39.9 kg·m-2), or obese III (≥ 40.0 kg·m-2) to assess metabolic disease risk based on BMI [71]. Based on %fat, individuals were categorized as moderate (M<25%; F<38%) or high risk (M≥25%; F≥38%) [72]. High TRG, low HDL, high GLUC, and VATUS were used characterize individuals based on metabolic syndrome risk factors [73]; VATUS was substituted for the traditional waist circumference risk factor. Individuals were further
38
and measured metabolic rate (predicted – measured) using the Harris-Benedict prediction equation [75]. Resting RER was stratified as low (<0.82), normal (0.85±0.03) or high (>0.88). High and low cutoff values were set at the SEM for RMR and RERrest. Glucose, lipids and
hormones were stratified according to standard clinical metabolic diagnoses (Table 3) [1, 76-80]. Estradiol and cortisol stratification was based off of Salimetrics reference data. Insulin
resistance was assessed by calculating HOMA-IR as described by Levy et al. (1998) [79, 80]. Individuals were categorized as normal (≤2.5) or high (>2.5) according to their calculated HOMA-IR [81, 82].
A Pearson product-moment correlation was used to identify significant relationships between body composition (FM, LM, %fat, VAT), RMR, RERrest, RERbike, GLUC, lipids, and
hormones (insulin, leptin, estrogen, cortisol), and in addition to relationships between leptin, RMR, RERrest, and RERbike. Separate Pearson product-moment correlations were used to
identify significant relationships by sex between these same variables.
A one-way analysis of variance (ANOVA) was used to evaluate significant differences in RMR, RERrest, RERbike, GLUC, lipids, and hormones (insulin, leptin, estrogen, cortisol), and
between males and females. A separate one-way ANOVA was used to evaluate differences in these same variables between overweight and obese individuals (overweight = BMI < 30.0, Obese = BMI ≥ 30.0). Separate analysis of co-variances (ANCOVA) were used to evaluate significant differences in RMR, RERrest, RERbike, GLUC, lipids, and hormones (insulin, leptin,
estrogen, cortisol) between males and females and overweight and obese individuals when co-varying for differences in LM.
39
lipids, insulin, leptin, estrogen, cortisol). Visceral adipose tissue (VATUS) was included as a potentially feasible clinical factor when evaluating variance in FM, LM, and %fat. All statistical analyses were completed using SPSS (Version 21, IBM, Armonk, NY, USA), using a
40 CHAPTER IV
RESULTS
Based on BMI and %fat categorization, all individuals were considered to be at an increased metabolic disease risk (Table 2). Twenty-two (45.3%) individuals were considered to be at a very high risk, with a BMI ≥ 35 kg·m-2. All individuals were considered to be at a high
risk based on %fat, except for one who was considered to be at a moderate risk, but was borderline high risk (F; 37.6%fat). When evaluating the combined risk factors for metabolic syndrome (abdominal obesity, elevated TRG, low HDL, and elevated fasting glucose), 32 individuals (71.1%) had no more than one risk factor (Table 2). Only one individual had three risk factors (2.2%), meeting the criteria for metabolic syndrome. When additional novel factors were used to evaluate metabolic risk (LMI, RMR, RERrest, TC, LDL, HOMA-IR) the frequency
of individuals with three or more risk factors increased to 48.8% (n=22). Frequencies of individual metabolic risk factors are presented in Table 3.
Body Composition
Research Question: Is there a relationship between total and regional body composition, RMR, RERrest, RERbike, glucose, lipids, and hormones in overweight and obese adults?
41
Fat Mass
For the entire group FM ranged from 24.54 - 75.05 kg. For the entire group, FM was not significantly correlated with RMR (p=0.163), RERrest (p=0.711), RERbike (p=0.691), or ΔRER
(p=0.918). Fat mass was significantly positively correlated with insulin (p=0.000, r=0.665), estradiol (p=0.003, r=0.417), and leptin (p=0.000, r=0.654), but not cortisol (p=0.812). There were no significant correlations between FM, TC (p=0.742), TRG (p=0.168), HDL (p=0.534), LDL (p=0.458), or GLUC (p=0.734). There was also no correlation between FM and VATUS (p=0.264, r=0.163).
When comparing differences between overweight and obese individuals, obese
individuals had greater FM, than overweight individuals (p<0.001; OB=42.50 ± 10.63 kg; OW= 30.15 ± 4.00 kg). When comparing differences between males and females, females had
significantly greater FM than males (p=0.006; F=43.14 ± 11.03 kg; M=34.80 ± 8.83 kg). In males, greater FM was positively associated with RERrest (p=0.028, r=0.459), insulin (p=0.004,
r=0.580), estradiol (p=0.003, r=0.417), and leptin (p=0.000, r=0.765); associations with RMR approached significance (p=0.061, r=0.396). In females, greater FM was associated with greater VATUS (p=0.077, r=0.353), higher RMR (p=0.028, r=0.459), insulin (p<0.001, r=0.704), and leptin (p=0.004, r=0.587).
Lean Mass
42
average LM for sex, age, and race (Figure 5). These five females all demonstrated a %fat of >40% and had normal metabolic rates, TC, TRG, and GLUC. Four of the five also had normal LDL and low cortisol levels. No individuals were categorized with ‘low’ LM. Lean mass was significantly positively correlated with VATUS (p=0.024, r=0.323) and RMR (p<0.001, r=0.900), but not RERrest (p=0.080), RERbike (p=0.337), or ΔRER (p=0.918, p=0.015). There was a
significant positive correlation between LM and insulin (p=0.075, r=0.268), a negative correlation with leptin (p=0.026, r= 0.332), and no relationship with cortisol (p=0.854, r= -0.027) or estradiol (p=0.407, r=0.121). Lean mass was positively correlated with TRG (p=0.009, r=0.384) and negatively correlated with HDL (p=0.003, r= -0.438). There was no correlation with TC (p=0.502, r=0.103), LDL (p=0.440, r= 0.118) or GLUC (p=0.121, r=0.235).
When comparing differences between overweight and obese, obese individuals had greater LM than overweight individuals (p=0.010; OB=61.31 ± 11.64 kg; OW=51.42 ± 10.70 kg). When comparing differences between males and females, males had significantly greater LM than females (p<0.0001; M=67.35 ± 8.54 kg; F=51.02 ± 9.35 kg). In males, greater LM was positively associated with RMR (p<0.001, r=0.871), RERrest (p=0.039, r=0.433), insulin
(p=0.005, r=0.562), estradiol (p=0.002 r=0.605), and TRG (p=0.057, r=0.402); associations with HDL approached significance (p=0.055, r= -0.406). In females, greater LM was positively associated with RMR (p<0.001, r=0.871) and insulin (p=0.017, r=0.503).
Percent Body Fat
43
body fat was positively correlated with insulin (p=0.013, r=0.369), estradiol (p=0.048, r=0.284), and leptin (p=0.000, r=0.829), but not with cortisol (p=0.923). Percent body fat was positively correlated with HDL (p=0.006, r=0.404) and negatively correlated with TRG (p=0.003, r= -0.426); there was no correlation with TC (p=0.897) LDL (p=0.716), or GLUC (p=0.486).
There was no difference in %fat between overweight and obese individuals (p=0.146). When comparing differences between males and females, females had significantly higher %fat than males (p<0.001; F=45.48 ± 4.12%; M=33.78 ± 4.76%). In males, a greater %fat was positively associated with leptin (p<0.001, r=0.700). In females, a greater %fat was positively associated with insulin (p=0.011, r=0.531), leptin (p=0.001, r=0.635), and LDL (p=0.031, r=0.460); associations with RERrest (p=0.051, r= -0.387) and TC (p=0.077, r=0.385) approached
significance.
Visceral Adipose Tissue
Research Question: Are there differences in relationships between VAT and markers of metabolic health when measured via B-mode US or dual-energy x-ray absorptiometry (DEXA)?
For the entire group, VATUS ranged from 2.21 - 10.55 cm. Thirty-six individuals (73.5%) were considered at low CVD risk (2.21 – 6.77 cm), 10 were at a moderate risk (7.32 – 8.58 cm), and three were at a high risk (8.83 – 10.55 cm). For the entire group, there was no significant correlation between VATUS, RMR (p=0.078), RERrest (p=0.783), RERbike (p=0.797),
44
There were no significant difference in VATUS between overweight and obese individuals (p=0.959). Differences between males and females approached significance (p=0.053), with males having more VATUS than females (M=6.53 ± 1.93 cm; F=5.53 ± 1.62 cm). In males, there was no association between VATUS and metabolic factors. In females, VATUS was positively associated with insulin (p=0.009, r=0.545) and leptin (p=0.012, r=0.523). When accounting for differences in LM between males and females, there was no significant difference in VATUS (p=0.570).
When measured by DEXA, VATDEXA was positively associated with RMR (p<0.001, r=0.577), insulin (p=0.002, r=0.455), and estradiol (p=0.075, r=0.256) and negatively associated with HDL (p=0.024, r= -0.336); associations with RERrest (p=0.062, r=0.269), TC (p=0.088,
r=0.257), and LDL (p=0.062, r=0.280) approached significance. There was not a significant difference in VATDEXA between overweight and obese individuals (p=0.142). When comparing differences between males and females, males had greater VATDEXA than females (p=0.011; M=3.4 ± 1.7 lbs; F=2.3 ± 1.1 lbs). In males, VATDEXA was positively associated with RERrest
(p=0.029, r=0.456), insulin (p<0.001, r=0.674), TC (p=0.010, r= 0.525), and LDL (p=0.037, r= 0.437); associations with RMR (p=0.076, r=0.377) and estradiol (p=0.061, r=0.397) approached significance. In females, VATDEXA was positively associated with RMR (p<0.001, r=0.654), insulin (p=0.004, r=0.588), and estradiol (p=0.030, r=0.425) and negatively associated with HDL (p=0.018, r= -0.499).
Metabolic Rate
Research Question: Are there differences in RMR, RERrest, RERbike, glucose, lipids, and
45
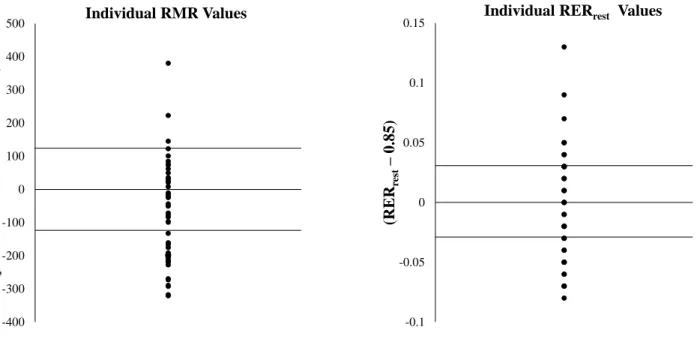
For the entire group, RMR ranged from 1292 - 2466 kcal/d. Twenty-two individuals (44.9%) had lower than predicted RMR, while three individuals had higher than predicted RMR (Figure 6). When comparing differences between overweight and obese, obese individuals had a higher RMR than overweight individuals (p=0.002; OB = 1894.75 ± 301.60 kcal/d; OW = 1587.46 ± 216.45 kcal/d); when controlling for differences in LM, there was no significant difference between overweight and obese individuals (p=0.096). When controlling for body mass, RMR was positively correlated with LM (p<0.001, r=0.764) and negatively correlated with FM (p<0.001, r=-0.764) and %fat (p<0.001, r=-0.758); there was no significant correlation with VATUS or VATDEXA (p>0.05). When comparing differences between males and females, males had significantly higher RMR than females (p<0.001; M=2011.13 ± 259.01 kcal/d; F=1638.15 ± 242.76 kcal/d). When accounting for differences in LM, there was no significant difference in RMR between males and females (p=0.873). When accounting separately for differences in CHO, FAT, PRO, and CAL, males had a higher RMR than females (p<0.001). When controlling for body mass in males, RMR was positively correlated with LM (p=0.005, r=0.572) and negatively correlated with FM (p=0.005, r=-0.572) and %fat (p=0.006, r=-0.562). When controlling for body mass in females, RMR was negatively correlated with %fat (p=0.038, r=-0.417); relationships with LM and FM approached significance (p=0.057, r=0.386 and
p=0.057, r=-0.386). There was no significant correlation between VATUS or VATDEXA in males or females (p>0.05).
For the entire group, RERrest ranged from (0.77 - 0.98 a.u.). Eight individuals had a
RERrest greater than 0.88 a.u., indicating a higher reliance on carbohydrate metabolism at rest
46
metabolism at rest. There was no significant difference in RERrest between overweight and obese
individuals (p=0.493) or between males and females (p=0.638). When accounting separately for differences in LM, CHO, FAT, PRO, and CAL intake between males and females, there was no significant difference in RERrest (p>0.05).
For the entire group, RERbike ranged from 0.85 to 1.19 a.u. Forty-five individuals
(91.8%) individuals had a RERbike greater than 0.88, indicating greater reliance on CHO during
steady-state exercise. There was no significant difference in RERbike between overweight and
obese individuals (p=0.344) between males and females (p=0.678). When accounting separately for differences in LM, CHO, FAT, PRO, and CAL intake, there was no significant difference in RERbike between males and females (p>0.05).
For the entire group, ΔRER ranged from -0.01 to 0.31 a.u. There was no significant difference in ΔRER between overweight and obese individuals (p=0.695) or between males and females (p=0.964). When accounting separately for differences in LM, CHO, FAT, PRO, and CAL intake, there was no significant difference in ΔRER between males and females (p>0.05).
Lipids and glucose
Average lipid and GLUC values for the entire group and between males and females are presented in Table 1. Males had significantly higher TRG (p=0.004), while females had
47 Hormones
Research Question: Is there a relationship between leptin, RMR and RERrest, RERbike?
Average hormonal values for the entire group and between males and females are presented in Table 1. All individuals had normal or high leptin levels (Mean: 36.09 ± 28.95 ng/mL; Range: 3.90 – 103.17 ng/mL). There was a non-significant negative correlation between leptin and RMR, (p=0.084, r= -0.261); there was no correlation between leptin, RERrest
(p=0.700), RERbike (p=0.941), or ΔRER (p=0.837). Differences in leptin between overweight
and obese individuals approached significance with obese individuals having higher leptin levels (p=0.053; OB=41.09 ± 31.03 ng/mL; OW=22.33 ± 16.41 ng/mL). Females had significantly higher leptin than males (p<0.0001; F=58.11 ± 25.23 ng/mL; M=15.02 ± 10.93 ng/mL). When accounting for differences in LM, females had greater leptin than males (Mean difference ± SEM; 1.09 ± 0.28 ng/mL).
Average cortisol levels were 0.28 ± 0.15 µg/dL (0.08 – 0.71 µg/dL). No individuals had high cortisol levels, but seven individuals were considered to have low cortisol levels based on sex and age (0.08 – 0.25 µg/dL). Difference in cortisol between overweight and obese
individuals approached significance (p=0.063) with obese individuals having higher cortisol (0.31 ± 0.16 µg/dL) than overweight individuals (0.23 ± 0.10 µg/dL). There was no significant difference in cortisol levels between males and females (p=0.784). When accounting for differences in LM, there was no significant difference in cortisol levels between males and females (p=0.589).
48
(3.13 – 5.46 pg/mL), two of whom were also males. Obese individuals had higher estradiol levels than overweight individuals (p=0.035; OB=2.14 ± 0.85 pg/mL; OW=1.58 ± 0.57 pg/mL). Differences in estradiol between males and females approached significance (p=0.052), with females having higher estradiol levels than males (F=2.20 ± 0.81 pg/mL; M=1.75 ± 0.76 pg/mL).
Average insulin was 9.68 ± 7.36 uIU/mL. There was no significant difference in insulin between overweight and obese adults (p=0.143). There was no significant difference in insulin between males and females (p=0.263), but when accounting for differences in LM, males had significantly higher insulin levels than females (p=0.001) (Mean difference ± SEM: 8.74 ± 2.52 uIU/mL).
Regression Analysis
Research Question: Will variances in total and regional body composition, RMR, RERrest,
RERbike, and ΔRER be explained by blood and hormonal markers of metabolic health?
Standard clinical measures (GLUC, lipids, insulin, leptin, estrogen, cortisol) were used as predictors for non-standard clinical measures (FM, LM, %fat, VAT, RMR, RERrest, RERbike,
49
In males, 60.2% of the variance in FM was explained by leptin (β=0.627) (p=0.000, r=0.766, r2=0.602); 36.6% of the variance in LM was explained by estradiol (β=6.658) (p=0.002, r=0.605, r2=0.366); 64.3% of the variance in %fat was explained by leptin (p<0.001, β=0.320) and HDL (p=0.008, β=0.237) (p=0.000, r=0.802, r2=0.643); no standard clinical measures significantly explained the variances in VATUS. In females, 49.6% of variances in FM were explained by insulin (β=0.870) (p=0.000, r=0.704, r2=0.496); 25.3% of the variance in LM was explained by insulin (β=0.532) (p=0.000, r=0.704, r2=0.496); 55.0% of the variance in %fat was explained by leptin (p=0.001, β=0.085) and LDL (p=0.022, β=0.037) (p=0.001, r=0.742,
r2=0.550); 29.7% of the variance in VATUS was explained by insulin (β=0.090) (p=0.009, r=0.545, r2=0.297).
For metabolic rate: 18.4% of the variances in RMR were explained by HDL (β= -10.255) (p=0.003, r=0.429, r2=0.184); 11.4% of the variance in RERrest was explained by HDL (β=
-0.001) (p=0.024; r=0.337; r2=0.114); 14.7% of the variance in RERbike was explained by
estradiol (β=0.028) (p=0.005, r=0.166, r2=0.147); 12.0% of the variance in ΔRER was explained by estradiol (β=0.026) (p=0.020, r=347, r2 = 0.120).
In males, 42.5% of the variance in RMR was explained by estradiol (β=216.977) (p=0.001, r=0.649, r2=422); 27.5% of the variances in RERrest was explained by insulin
(β=0.004) (p=0.010, r=525, r2=0.275); 24.0% of the variance in RERbike was explained by
estradiol (β=0.041) (p=0.018, r=0.490, r2=240); no standard clinical measures significantly explained the variances in ΔRER. In females, 32.5% of the variance in RMR was explained by insulin (β=15.353) (p=0.006, r=0.570, r2=0.325); 19.8% of the variance in RERrest was explained
50
51 CHAPTER V DISCUSSION
Metabolic dysfunction is commonly associated with obesity, excess VAT, dyslipidemia, insulin resistance, and hormonal imbalances [8, 73, 83]. While blood lipids, GLUC, and insulin levels are common indicators of metabolic dysfunction, not all obese individuals have
dyslipidemia or insulin resistance, despite excess adiposity [9, 10, 84]. Other components of body composition, such as LM and VAT, have been shown to have strong influences on
metabolic factors [12, 13, 30, 83, 85], yet are not assessed using common clinical measures such as BMI and waist circumference. Further, in the absence of dyslipidemia or insulin resistance, other measures such as RMR and RER, may provide early indication of metabolic dysfunction. Results of the current study indicate that FM alone was not significantly correlated with
traditional markers of metabolic health (blood lipids and GLUC) in otherwise healthy overweight and obese adults, but may be linked with hormonal profiles, showing positive correlations with insulin, leptin, and estradiol. Fat distribution however, may have stronger associations with metabolic dysfunction. Women with greater FM tended to have more VATUS which was significantly correlated with higher insulin and leptin levels. In males, VATUS was not
52
with a lower RMR, while greater LM was associated with a higher RMR. Lean mass may be especially important in women with very high %fat, as those with above average LM in the present study tended to have normal metabolic rates, TC, LDL, TRG, GLUC, and low cortisol levels, though further investigation into these relationships is necessary. Despite 16.3% of the group exhibiting increased carbohydrate reliance at rest (RERrest >0.88), body composition did
not seem to have strong associations with fuel utilization during rest or steady-state, which may implicate the role of diet and exercise in metabolic health.
Obesity based disease risk is often clinically evaluated using BMI. Based on BMI, all individuals in the group were considered at an elevated disease risk. However, when evaluating common risk factors of metabolic syndrome, almost 1/3 of the group displayed no metabolic risk factors indicating that outside of excess body fat, these individuals could be considered to be relatively metabolically healthy at the time of testing. These findings may also indicate that this form of diagnosis may only be identifying individuals who have reached a certain level of
53
in addition to the traditional criteria, individuals with two or more metabolic risk factors
increased from about 29% to 80%, indicating that consideration of these factors when evaluating metabolic health may be warranted.
Excess adiposity is known to be associated with insulin resistance and dyslipidemia [88], but more recent studies have identified individuals with up to 50% body fat who have normal insulin sensitivity and blood lipids [11, 84]. Fat mass has been shown to be positively correlated with insulin resistance, even in normal weight individuals [38]. Further, insulin resistance has been shown to be significantly related to elevated TRG, LDL, and VAT [11]. While results of the current study support clear associations between all indices of excess fat accumulation (FM, %fat, and VAT) and insulin, FM was not associated with blood lipids or GLUC in males or females. Interestingly, FM was positively associated with VATUS in women, but not in men, likely related to differences in hormonal distribution of fat. Hormones such as leptin, estrogen, and cortisol are commonly associated with FM and fat distribution [15]. In the current study, greater FM and %fat were associated with higher estradiol and leptin, but not cortisol. When separated by sex, FM was associated with greater estradiol in men, but not in women, supporting previous findings of elevated estradiol levels in obese men [23, 24].
54
significantly correlated with insulin and leptin in women. While greater VAT is typically associated with greater metabolic risk in both men and women, Leite et al. (2002) found that a VAT thickness greater than 8 cm was associated with high risk in women compared to 9 cm in men. These results, in combination with those of the current study, may indicate that VAT accumulation in women may be a more serious metabolic risk factor.
Quantification of VAT from a total body DEXA scan is another valid alternative to CT [69]. Ultrasound is commonly criticized for having poor reliability, related to differences in measurement technique [36, 93], which is eliminated by the DEXA quantification. Test-retest reliability calculations for VATUS in the current study showed good reliability, but when comparing the two methods, VATDEXA was significantly correlated with more markers of
metabolic health, including insulin and blood lipids, especially in men. Differences in the degree of the association between the two measures may be related to how VAT is quantified by each device. Ultrasound quantifies thickness of VAT within the abdomen and may include organ tissue, while VATDEXA is quantified by mass and volume. Both measurements have been shown to be significantly correlated with CT measurements of VAT [42, 69], but differences in VAT quantification should be considered in future research. Nevertheless, both methods still have significant benefits over waist circumference in determining potential cardiometabolic risk [35, 91].
55
94-96]. One study demonstrated that obese women with less LM had favorable metabolic profiles compared to obese women with unfavorable metabolic profiles [84]. When comparing differences between women with high and low LM, Brochu et al. (2008) found that higher LM was positively associated with insulin and GLUC. As was supported in the current study, obese individuals often have a greater quantity of LM, likely as a result of supporting greater body weight, but may not always have a higher quality of LM [97, 98]. Greater total body fat has been correlated to greater intramuscular fat and may support the indirect relationship between LM, VAT, and insulin in the present study [50, 97, 99]. It should be noted that five individuals in the current study were identified as having above average LM. All were females, and all tended to have normal TC, LDL, TRG, GLUC, and insulin resistance based on HOMA-IR. While this observation cannot be extrapolated to the larger population and muscle quality was not measured, it may support previous findings demonstrating a benefit of LM in an obese population [30]. Due to the concomitant increase in LM with FM, future considerations for muscle quality in this population should be explored.
56
relative to LM and FM, some studies suggest obese individuals may actually have a lower RMR [102, 103]. About 45% of individuals in the current study had a lower than predicted metabolic rate, compared to only 6% who had greater than predicted. Similarly, when controlling for body mass, a lower metabolic rate was associated with FM and %fat suggesting a potential negative association between excess fat and RMR.
Based on the results of the current study, a higher RERrest was associated with greater
LM, FM, and VATDEXA and may represent a greater reliance on carbohydrates. Despite influences of body composition on metabolic rate and fuel utilization, RMR and RER are still highly variable between individuals [104]. In the present study, RER values at rest ranged from 0.77 – 0.98 a.u., with similar ranges reported from other studies [31, 67]. Some variances in RER have previously been shown to be hormonally influenced [105]. Specifically, leptin, a signal of chronic energy storage, may indirectly alter RMR and fuel utilization [44, 106]. However, no significant relationships between leptin, RMR or RER were found in the current study.
57
significant difference in estradiol between men and women, which has been previously reported in obese men [14, 23, 24]. Despite potential hormonal activity of adipose tissue, estradiol in the current study was not a significant predictor of variances in FM or VATUS in males, but it was a significant predictor of LM, RMR, and RERbike. The relationship between estradiol, LM, and
RMR are likely a corresponding association with greater body mass, but the relationship with RERbike could suggest that relatively high levels of estradiol in men, as was observed in the
current study, may have metabolic consequences [108]. In contrast, variances in FM, VATUS, and RMR in women in the current study were more strongly predicted by insulin, reiterating the more serious implications VAT accumulation may have in women. Previous studies have associated VAT with increased cortisol levels [26, 27], however, cortisol was not a strong predictor of VATUS or VATDEXA in the current study. Further, there were no significant predictors of VATUS in men, stressing the importance of assessing VAT when evaluating metabolic health. Interestingly, HDL was a negative predictor of LM, metabolic rate, and RERrest in the group overall. While further investigation into this relationship is required, these
results may implicate HDL as a blood marker of non-traditional measures of metabolic health. High leptin and estradiol levels in men may be an indication of excess fat accumulation and an early sign of metabolic dysregulation. In women, high insulin is likely a strong predictor of greater VAT accumulation and its associated risks. Evaluation of hormonal profiles, in addition to blood lipid markers, may be valuable in the early identification and treatment of metabolic health.
58
status, not exercise habits. However, regardless of exercise status, all individuals were still considered overweight or obese based on BMI and %fat. Further, all individuals had maintained their weight within 4.5 kg for at least three months prior to testing, suggesting that despite
potential benefits of exercise, other mechanisms were preventing these individuals from reaching a normal weight. Results and techniques used in the current study offer a more complete picture of the metabolic status of these individuals. Future exercise or dietary interventions that aim to decrease VAT, increase quality LM, improve fuel utilization, and restore hormonal balance may be effective.
59
60 TABLES
Table 1: Subject characteristics (Mean ± standard deviation [SD])
Total Male Female
N 49 23 26
Age (yrs) 35.0 ± 8.9 37.4 ± 10.3 32.8 ± 6.9
Height (cm) 170.7 ± 9.7* 178.1 ± 6.4 164.1 ± 7.1
Weight (kg) 97.9 ± 17.7 102.2 ± 15.1 94.2 ± 19.3
BMI (kg·m-2) 33.6 ± 5.2 32.1 ± 3.3 34.9 ± 6.2
FM (kg) 39.2 ±10.8* 34.8 ± 8.8 43.1 ± 11.0
LM (kg) 58.7 ± 12.1* 67.4 ± 8.6 51.0 ± 9.4
LMI (kg·m-2) 20.0 ± 2.6* 21.2 ± 1.7 18.9 ± 2.9
%fat 40.0 ± 7.3* 33.8 ± 4.8 45.5 ± 4.1
VAT (cm) 6.0 ± 1.8 6.5 ± 1.9 5.5 ± 1.6
RMR (kcal/day) 1813.2 ± 311.2* 2011.1 ± 259.1 1638.2 ± 242.8
RERrest 0.9 ± 0.1 0.9 ± 0.0 0.8 ± 0.1
RERbike 1.0 ± 0.1 1.0 ± 0.1 1.0 ± 0.1
TC (mg/dL) 185.5 ± 39.5 191.4 ± 35.0 179.4 ± 44.5
LDL (mg/dL) 118.8 ± 34.3 124.3 ± 29.6 113.0 ± 38.4
HDL (mg/dL) 44.6 ± 12.9* 39.0 ± 7.9 50.5 ± 14.5
TRG (mg/dL) 110.7 ± 73.5* 140.7 ± 87.7 79.3 ± 35.2
GLUC (mg/dL) 87.2 ± 22.2 92.8 ± 29.6 81.4 ± 7.0
Insulin (uIU/mL) 9.7 ± 7.4 8.5 ± 4.9 10.9 ± 9.2
HOMA-IR 1.2 ± 0.9 1.1 ± 0.6 1.4 ± 1.1
Cortisol (µg/dL) 0.3 ± 0.2 0.3 ± 0.2 0.3 ± 0.2
Estradiol (pg/mL) 2.0 ± 0.8 1.7 ± 0.8 2.2 ± 0.8
Leptin (ng/mL) 36.1 ± 28.9* 15.0 ± 10.9 58.1 ± 25.2
61
Table 2: Risk stratification and frequencies based on BMI, %fat, and metabolic syndrome risk factors.
Stratification N (%)
BMI Overweight (25.0-29.9)
Obese (30-34.9) Obese II (35-39.9) Obese III (≥40)
13 (26.5%) 14 (28.6%) 18 (36.73%)
4 (8.6%)
%fat Moderate (M<25%; F<38%)
High (M≥25%; F≥38%)
1 (2.0%) 48 (98.0%)
Metabolic Syndrome 0 Risk Factors
1 Risk Factor 2 Risk Factors 3 Risk Factors 4 Risk Factors
14 (31.1%) 18 (40.0%) 12 (26.7%) 1 (2.2%)
0 (0%)
Additional Metabolic Risk Factors 0 Risk Factors
1 Risk Factor 2 Risk Factors 3 Risk Factors 4 Risk Factors 5 Risk Factors 6 Risk Factors
2 (4.4%) 7 (15.6%) 14 (31.1%) 11 (24.4%) 4 (8.9%) 6 (13.3%) 1 (2.2%) Note: Metabolic syndrome defined as the presence of 3+ risk factors including: abdominal obesity (VAT; >7cm), elevated triglycerides (≥150 mg/dl), low HDL cholesterol (men<40 mg/dl, women<50 mg/dl), and elevated fasting glucose (≥110 mg/dl). Additional
62
Table 3: Stratification and frequencies based on metabolic and hormonal factors.
Stratification N (%)
VAT Low (< 7cm)
Moderate (M 7-9cm; W 7-8cm) High (M>9 cm; W >8cm)
36 (73.5%) 10 (20.4%) 3 (6.1%)
Glucose Low (<70 mg/dL)
Normal (70-110 mg/dL) High (≥110 mg/dL)
1 (2.2%) 42 (93.3%)
2 (4.4%)
Triglycerides Normal (<150 mg/dL)
High (≥ 150 mg/dL)
38 (84.4%) 7 (15.6%)
HDL Low (M< 40 mg/dL; W< 50 mg/dL)
Normal (M≥40 mg/dL; W≥50 mg/dL) 25 (55.6%) 20 (44.4%)
LMI Low (<10%)
Normal (10th – 90th %) High >90% >97% 0 (0%) 33 (67.3%) 11 (22.4%) 5 (10.2%)
RMR Low (<125.6 kcal/d)
Normal (±125.6 kcal/d) High (>125.6 kcal/d)
22 (44.9%) 24 (49.0%) 3 (6.1%)
RERrest Low (<0.82)
Normal (0.85±0.03) High (>0.88)
13 (26.5%) 28 (57.1%) 8 (16.3%)
Total Cholesterol Low (<100 mg/dL)
Normal (100-199 mg/dL) High (>200 mg/dL)
4 (8.2%) 30 (61.2%) 15 (30.6%)
LDL Normal (<100 mg/dL)
Above normal (100-160 mg/dL) High (>160 mg/dL)
13 (28.9%) 26 (57.8%) 6 (13.3%)
HOMA-IR Normal (≤2.5)
High (>2.5)
44 (97.8%) 1 (2.2%)
Leptin Low (<10th percentile)
Normal (10th – 90th percentile) High (>90th percentile)
0 (0.0%) 14 (31.1%) 31 (68.9%)
Estradiol Low (<1.35 pg/mL)
Normal (1.35-2.97 pg/mL) High (>2.97 pg/mL)
11 (22.4%) 35 (71.4%) 3 (6.1%)
Cortisol Low
Normal High
7 (14.3%) 42 (85.7%)
63 FIGURES
Initial Electronic Correspondence
(n=114)
Excluded (n=50)
Did not meet inclusion/exclusion criteria (n=34) Did not respond to initial contact (n=16)
In-Person Enrollment Visit
(n=64)
Excluded (n=8)
taking dietary supplements (n=1)
>10 lbs of weight change in the last three months (n=2) unable to meet time requirements (n=1)
substantial dietary changes in the last three months (n=1) did not meet a number of inclusion/exclusion criteria (n=1) inconsistent medications (n=1)
taking multiple medications (n=1)
Enrolled
(n=56)
Excluded (n=7)
withdrew for personal reasons (n=4) no explanation for withdraw (n=3)
Tested and Analyzed
(n=49; men=23, women=26)
Figure 1: CON SORT fl ow diagram
64 Figure 2: Experimental timeline.
VISIT 1 VISIT 2 VISIT 3
2 Week Run-In 0-72 Hours
Visit 1: Enrollment Informed consent
Health history questionnaire Age, height, weight, BMI 4-day dietary intake analysis
and interpretation
Visit 2: Testing
Resting metabolic rate Body composition Fasted blood draw Saliva Sample
Visit 3: Testing
![Table 1: Subject characteristics (Mean ± standard deviation [SD])](https://thumb-us.123doks.com/thumbv2/123dok_us/8242396.2184397/60.918.110.744.203.992/table-subject-characteristics-mean-standard-deviation-sd.webp)