Page | 0
Multi-Spectral Identification Array
Zachary Eagan [email protected]
Senior Project
Computer Engineering Department
California Polytechnic State University
San Luis Obispo
June 2017
Advisor
Page | 1
Statement of Disclaimer
Page | 2
Table of Contents
Section Page
Statement of Disclaimer 1
Abstract 4
Acknowledgments 5
Background 6
Applications 7
System Design 7
LED Selection 8
Filter Selection 8
Camera Selection 9
Electronics Design 9
Array Board Design 9
LED Array Multiplexer 10
Software flow 11
Valid Pixels 11
Array Communication 12
Camera Communication 13
Testing 14
System Performance 14
Conclusion and Future Work 16
References 17
Appendix A (ABET Senior Project Analysis) 18
Summary of Functional Requirements 18
Primary Constraints 18
Economic 18
If manufactured on a commercial basis 22
Environmental 23
Manufacturability 23
Sustainability 23
Improvements. 24
Ethical 24
Page | 3
Social and Political 25
Development 25
Appendix B (Spectra of Selected Filters) 25
Appendix D (Electronics Schematics) 26
Appendix F (Software Flowchart) 30
Appendix G (Array Firmware) 30
Page | 4
Abstract
Page | 5
Acknowledgments
Page | 6
Background
Multispectral imaging is the practice of taking pictures with multiple discrete color bands. Most commonly utilized to produce the standard Red Green Blue image we are accustomed to seeing; multispectral imaging can provide vastly more information than a simple bitmap or grayscale image. Commonly multispectral imaging utilizes between three and twenty distinct bands of color, each of which provides a different view of the subject.
[1]
Deep red or near infrared light for example will show less fine detail however it can often pass straight through the first few microns of an object's surface to reveal pigments below.[2]
On the other side of the spectrum blue or ultraviolet light can reveal surface details far finer than a human hair and will produce a much crisper image.[1]
By combining these features Multispectral imaging can reveal information which is otherwise hidden to the human eye.Multispectral imaging is commonly accomplished through either filtering of ambient light or illumination of the subject with controlled spectra. The two methods each have merits and limitations. Multispectral imaging via a dedicated multispectral camera or set of lens filters traditionally suffers from mechanical failures when moving the filters, or from low numbers of filters. Some image sensors have been developed which have up to six built in filters, however these are extremely expensive and the filters cannot be modified.
[3]
Traditionally because of the high cost of manufacture these sensors only have between three and six filters.Multispectral imaging via illumination on the other hand suffers from the inverse square law of light, which limits the depth of field.
[2]
Illumination also faces challenges due to high cost of the controlled spectra light sources.[4]
This high cost is one of the challenges this project hopes to address.Commonly multispectral cameras utilise between three and six filters spanning the infrared through ultraviolet bands. Infrared light is most notably utilised in imaging systems such as the FLIR heat vision cameras and the Landsat global satellites.
[5]
The ultraviolet bands on the other hand are more commonly used to reveal fine detail in paintings or surface finishes.[6]
The most common multispectral cameras are centered in the visible light band. These are the standard Red Green Blue cameras used by most photographers. A common practice in the agriculture industry is to remove the infrared filter from a standard RGB camera, changing it to a Red Green InfraRed allowing broader spectra imaging.[5]
However this still allows only three distinct spectra of color.Multispectral illumination is commonly utilized in the production of high quality image capture for movies augmented with computer graphics.
[4]
Other applications include crime sceneinvestigation, medical imaging of skin disorders, and art forgery detection. Commonly
multispectral Illumination is accomplished using Light Emitting Diodes, gas discharge lamps, or low width band pass filters.
[7]
The filter method is prohibitively expensive for amateurPage | 7
Applications
This Multispectral imaging array is intended to reduce the cost of full image spectrometry. The primary uses under consideration are pollution monitoring, plant health monitoring, inert sample and full scene cataloging. The Array is most effective in dark environments so would be ideal for undersea applications. While the array is not sufficiently accurate to be used as a final indicator of material properties, it can serve as a preliminary scanning method to rule out obviously irrelevant or to identify potentially interesting subjects.
[8]
The array should be used primarily on objects between two and ten meters from the illumination source though the camera may be placed closer. The principles considered here can easily be adapted to alternative light sources depending on what is readily available, allowing variable range of use and manufacturing techniques.
The array has some applications for true color reproduction if the emissions spectra of the displaying screen is known however this has not been considered in this project.
[9]
The array could also be used as a variable color constant illumination source for applications such as theatre lighting, however this would require vastly improved heat sinking and increased safety tolerances.
System Design
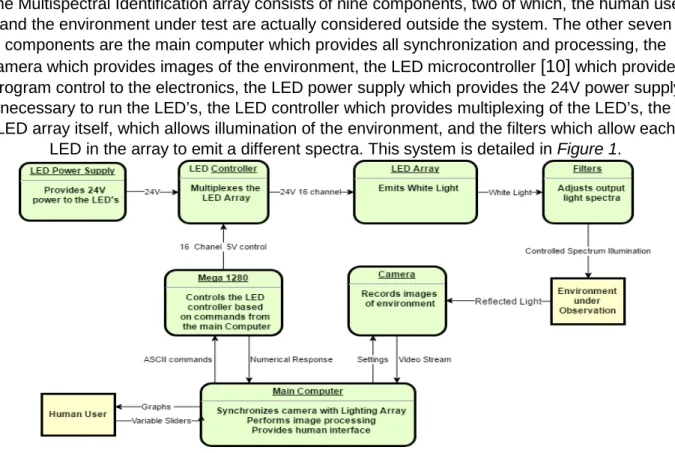
The Multispectral Identification array consists of nine components, two of which, the human user and the environment under test are actually considered outside the system. The other seven
components are the main computer which provides all synchronization and processing, the camera which provides images of the environment, the LED microcontroller
[10]
which providesprogram control to the electronics, the LED power supply which provides the 24V power supply necessary to run the LED’s, the LED controller which provides multiplexing of the LED’s, the LED array itself, which allows illumination of the environment, and the filters which allow each
LED in the array to emit a different spectra. This system is detailed in Figure 1.
Page | 8
LED Selection
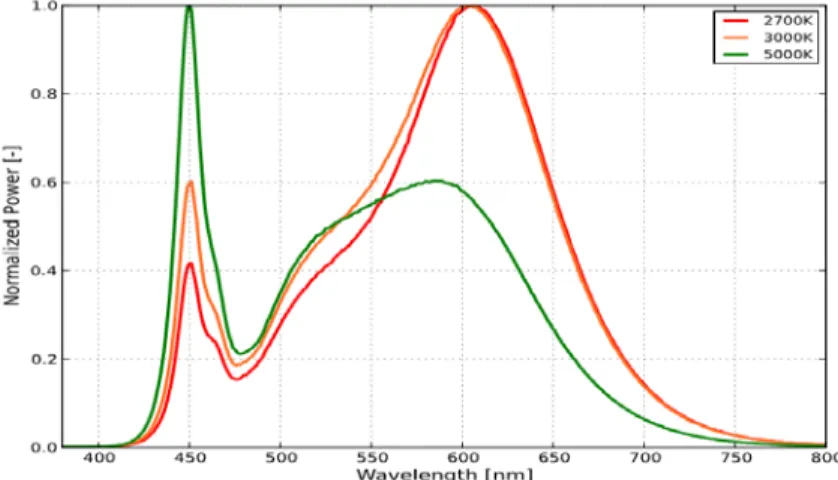
The LED’s used were chosen for high luminosity and a relatively broad spectrum. Multiple high power white LED’s were examined for traits such as luminosity, viewing angle, spectrum, heat dissipation and input voltage. By these metrics the Luxeon L150-3080502400000 was chosen.
[11]
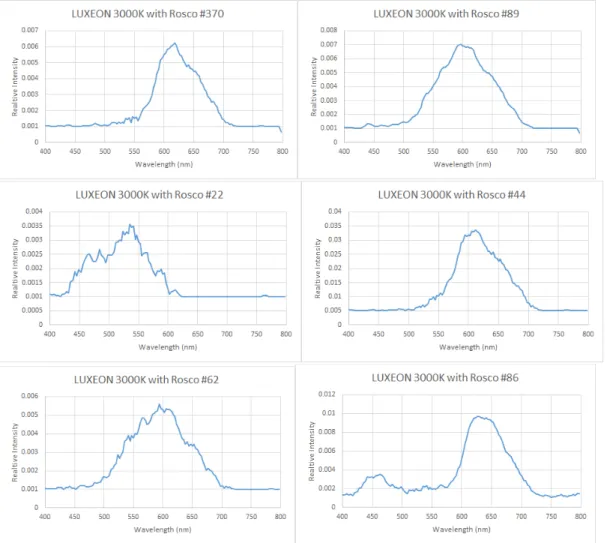
This Luxeon model is a 24v high efficiency LED in a standard SMD5050 package. The broad double peaked spectrum as seen in Figure 2 is produced by passing the light of a blue LED at 450nm through a phosphor coating which absorbs and emits the energy in a broader peak centered at 600nm.[11]
This spectrum is as close to ideal as is possible with current commercial grade LED’s. Of particular importance are the rapid drops in power at either end of the spectrum. These drops provide a clear range over which the array can be expected to operate, and ensures that no significant light is emitted outside the range of the calibration spectrometer.Figure 2: Luxeon LED Spectra
Filter Selection
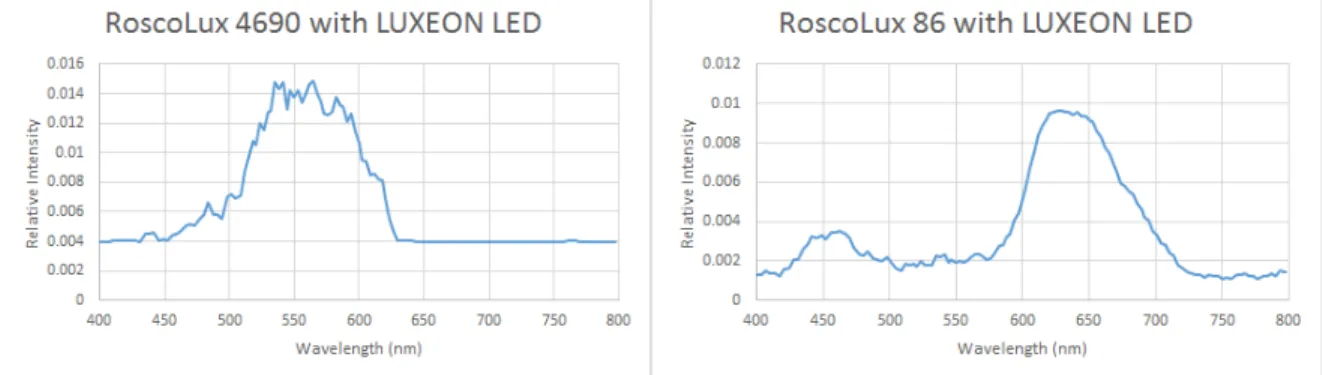
RoscoLux theatre and cinema grade filters were chosen due to their high availability, low cost, and high thermal stability.
[12]
Initially, random filters were chosen from the RoscoLuxSwatchbook with consideration given only to total absorption percentage. Only filters with absorptions between fifteen and sixty percent were considered. Lower absorption levels tended to produce spectra which were largely indistinguishable from the LED’s alone while higher absorption filters tended to be too dim for use at ranges of more than a meter and also became much hotter during prolonged use.
Page | 9
Figure 3: Captured spectra of a filter Figure 4: Captured Spectra of a filter
Camera Selection
The camera used was a Logitech C920 webcam.
[13]
This webcam was chosen for high compatibility with the openCV library. The C920 provides a full size 1080p uncompressed 30Hz video stream from which single images are taken in coordination with the lighting array. Settings such as ISO, exposure and aperture are set based on a few frames taken at startup.[14]
All automatic features are then disabled to ensure consistent images regardless of changes in the scene or lighting.To demonstrate the versatility of the design with other cameras a Nikon D3500 was integrated with the lighting array. This full DSLR still photo camera is not directly supported by openCV and has a far lower frame rate than the C920.
[14]
However, the Nikon D3500 is able to take far higher resolution images with greater color depth. Integration with the openCV libraries required triggering through the external software package gphoto2.Electronics Design
Array Board Design
Several board designs were considered for the LED array. Initial concepts included a
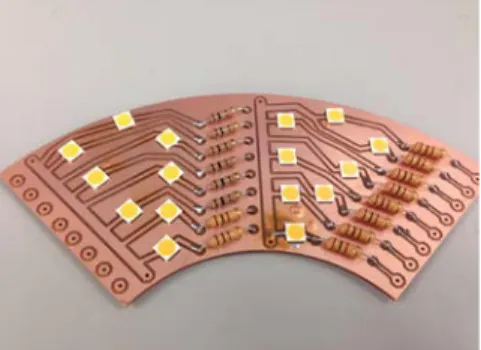
standalone square, or circular array, with even spacing of LED’s. However in order to present as even an exposure as possible from each LED, and to minimize shadows caused by a nonzero angle of incidence it was chosen to place the LED’s in a circle around the camera. This was later revised to the final circular arrangement of eight groups of eight LED’s.
Page | 10
Figure 5: One quarter of the LED array showing two groups of eight LEDs
The Array board was milled from FR1 double sided copper clad using an Othermill provided by the innovation sandbox. If chemical etching is used, then the more common FR4 fiberglass copper clad may be used. However, if used with the Othermill FR4 will dull the bits and produce harmful fiberglass dust.
[15]
LED Array Multiplexer
The LED Array Multiplexer controls power to the array. The multiplexer uses N channel
MOSFETS to control the connection of the Array anode line to the 24V input supply, as well as the connection to ground for the Array’s cathode lines. So long as the electrical connections for the LED’s in the array are compatible, the physical layout is unimportant. To power a single LED both the anode for that LED’s row and the cathode for that LED’s column must be active.
Powering multiple LED’s is possible by activating multiple anodes or cathodes simultaneously. When powering multiple LED’s, it is important to keep in mind both the current requirements and heat dissipation. Since the MIA array was not designed to dissipate heat from more than one LED at a time the board can quickly exceed the thermal limits of the FR1 substrate. Similarly, the 24v power supply chosen for this project was not designed to handle the current draw of more than three LED’s at a time and will shut down to prevent damage.
Page | 11
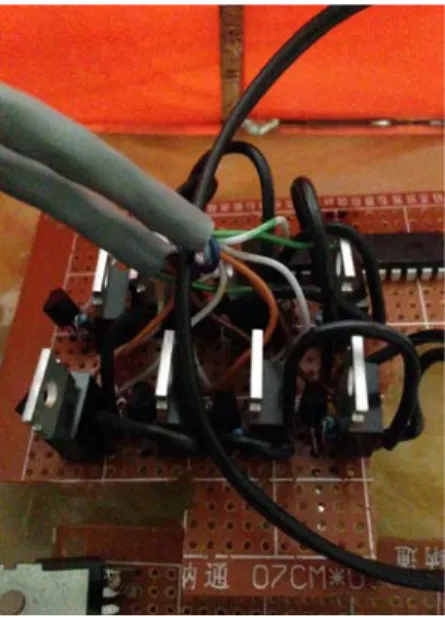
side is shown in Figure 6.
Figure 6: The Anode Control Circuit
Software flow
Over the course of the project several software designs were used to achieve different effects. To achieve real time image processing a multithreaded version was used which broke image retrieval and lighting coordination into one thread, while image processing and display was separated to a second thread. Using this method, a processed frame rate of nearly five frames per second was achieved. However, the performance was inconsistent even with all other programs closed and this version suffered from frequent loss of coordination with the lighting array.
The final version of the software is much reduced in scope however provides much more consistent results. The final version utilizes a single threaded flow which allows blocking until lighting array and camera are synchronized, this reduces the frame rate to as low as one
processed frame every three seconds however each image used is guaranteed to represent the full brightness of its associated lighting environment. To reduce the appearance of a slow frame rate, captured images which would otherwise be discarded are redirected to the main image display. This provides real time video allows a more fluid user interface. It should be noted though that this means analysis of pixels will not correspond to the objects selected for viewing if those objects moved between the time selected and the last multispectral frame.
Valid Pixels
Validity of pixels for use in a solve is determined by two factors, the saturation of the pixel, and the difference between the intermixed ambient, or white light frames.
Page | 12
result of shadows or objects which are out of the range of the lighting array. Additionally, most cameras do not have linear sensitivity outside this range and so as a general rule, pixels outside this range should be considered invalid.
Since it is not always known when taking data whether the objects under observation are moving or not, a series of frames are taken before, after and interspersed with the illuminated images. If ambient light is sufficient, these frames may be taken with no illumination otherwise an unfiltered white light source is used. To determine motion in the image which may corrupt a solve the difference of these frames is compared to a threshold value. Pixels which change more than the threshold value between any two interspersed frames are considered invalid. Generally for slow moving objects motion is only a problem at the edges however fast moving objects may be thrown out entirely.
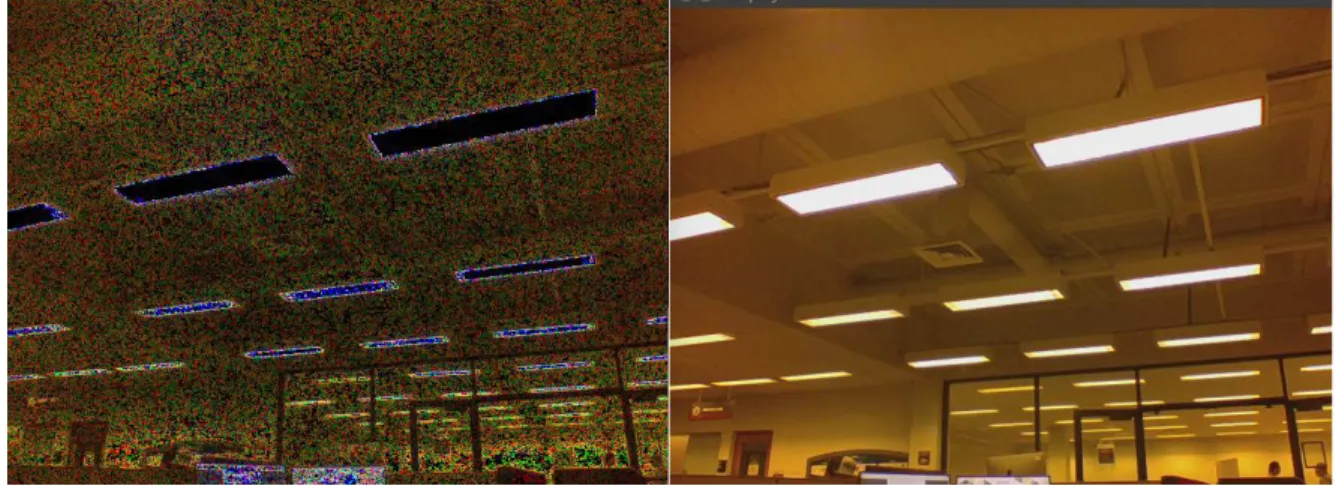
All remaining pixels are considered valid, at this point the average ambient light for each pixel is subtracted from the illuminated frames which leaves only data from the illumination source and noise. Figure ?? shows the valid pixels in a bright room, fluorescent lights are almost entirely removed from consideration and pixels which are entirely green red or black indicate a location the filters have identified as potentially moving. In the case of moving pixels the color displayed is indicative of the direction the filter thinks the pixel is traveling however this is a feature from an earlier use of this filter and all moving pixels are simply ignored.
Figure 7: filtered image on the left, unfiltered image on the right
Array Communication
Page | 13
Camera Communication
Communication with the camera is twofold, during initialization some settings which are not supported by openCV are handled via the V4L2 Linux video API. This allows greater control over camera settings however is a much more complicated API so once settings have been written to the camera’s memory the file handle for this API is closed and the camera is reopened using the standard openCV methods. This is effective for the Logitec C920 camera used
however other cameras may not maintain the settings once the V4L2 handle is closed.
Since the openCV library does not support taking single images from webcams the file handle to the C920 camera points to a FIFO buffer in which up to eight frames are stored. This buffer updates continuously at a measured speed of 29.8Hz. The exact buffer size is a function of the particular version of openCV used and the underlying platform specific driver. In order to ensure that frames read from this buffer are the latest and thus correspond to the current lighting environment, the buffer must be continuously emptied. This was the great advantage of the multithreaded version of the MIA software which allowed continuous retrieval of images to keep the buffer empty. Frames retrieved which have been buffered require slightly less time to load than frames which are retrieved directly from the camera, thus by timing the retrieval, the software determines whether or not a frame is valid under the current lighting environment. To be safe the current code always throws out at least one frame for every lighting environment. This reduces the maximum frame rate dramatically but ensures valid results.
Spectral Solve
The spectral solve used in the array relies on the assumption that 64 spectra, is sufficiently close to infinite random spectra to produce an approximately true result. The ideal version of the array would use an infinite number of randomized spectra whose average sum is 1.
Mathematically the solve used to produce the spectral graph is as follows. 𝑆𝑆𝑃𝑃≃ ∑𝑁𝑁𝑛𝑛=0 �𝑆𝑆𝐼𝐼[𝑛𝑛] ∗ 𝐼𝐼𝐶𝐶𝐼𝐼𝑅𝑅∗𝑁𝑁� 𝑤𝑤ℎ𝑒𝑒𝑛𝑛𝑁𝑁→∞𝑙𝑙𝑙𝑙𝑙𝑙𝑎𝑎𝑛𝑛𝑎𝑎 ∑𝑁𝑁𝑛𝑛=0 𝑆𝑆[𝑁𝑁𝑛𝑛] ≃1 𝑎𝑎𝑛𝑛𝑎𝑎𝐼𝐼𝐶𝐶 ≥ 𝐼𝐼𝑅𝑅 Where
SP = Spectra of one pixel
N = Total Number of illumination spectra SI = Spectra of illumination source IR = Illumination value recorded by pixel
IC = Illumination value recorded by calibration pixels
Page | 14
the actual spectra which would be received by a spectrophotometer when the subject is illuminated by a flat white light.
Testing
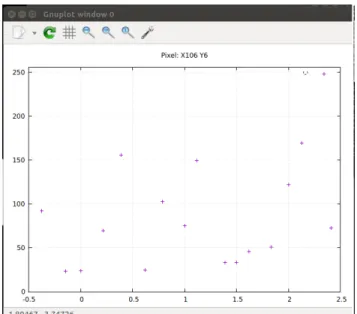
Testing of the Array was performed in three stages, first the solve algorithm was modeled using a series of spreadsheets to provide an analytic basis on which to judge the performance of the Array. In these spreadsheets the effects of using random, sinusoidal, stepped, bell curved, linear and flat spectral curves was examined. Also examined was the effect of using various numbers of illumination spectra. Then the uncelebrated array was tested on its ability to differentiate objects based on color. For this test a version of the code plotted the relative intensities of each illumination spectra on a graph, and produced an image showing only pixels which matched each point on that graph to within a threshold. This test was intended to identify objects with extremely similar color. The final test utilized the calibrated data from spectrometer measurements of the filtered light sources to attempt to produce similar quality spectral solves to the spreadsheet tests.
System Performance
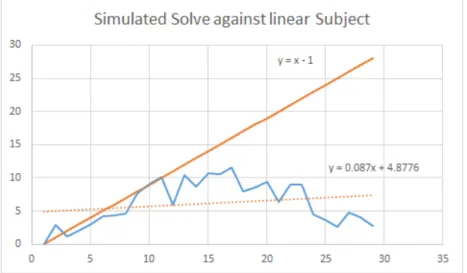
The first test using spreadsheets to simulate the solution did not return the expected perfect results. Further analysis indicated a fundamental flaw in the solve which must be rectified before the Array will be able to produce usable graphs. The problem is that while impulses, steep bell curves and other highly correlated spectra will produce approximately usable graphs, all secondary peaks cause an inflation in the values associated with the primary. For random or multi-peaked spectra this problem tends to inflate the error to over 78% essentially an output graph which is almost but not entirely unrelated to the actual spectra of the sample. Figure performance 1 shows the most closely correlated graph which was achieved using output spectra from actual measurements of the filters during calibration. For this test an imaginary subject with a linear spectrum was used as it would be extremely clear if the output graph was accurate. Unfortunately, this closest matching spectrum still had an average error of 36%.
Figure 8: The orange line indicates spectra under test while blue indicates the computed curve
Page | 15
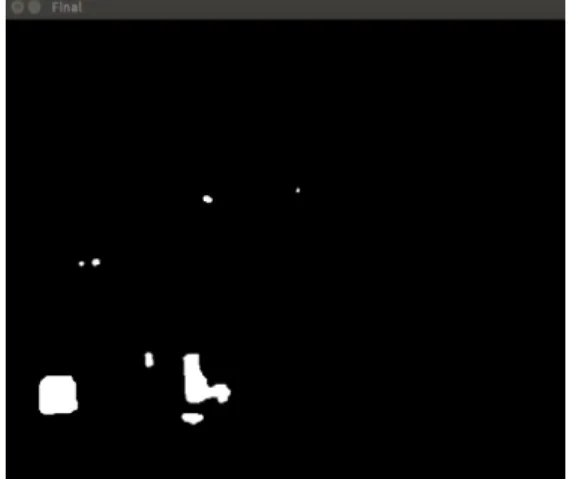
both the mathematical error for similar systems and solutions for producing accurate curves. One notable paper from 1977 presents a methodology remarkably similar to this project including simulations which indicate effectiveness of the method. Though there has not been time to include this new research into an updated version it indicates future work is merited. The second tests however, which focused on the system's ability to differentiate objects were much more successful. These tests were performed informally in a dark room. Under these conditions the array was able to consistently locate objects within the room. Subjects included a role of yellow tape a blue backpack a blue highlighter, a cardboard box, and a whiteboard. The array was able to locate each object with the exception of the whiteboard. When directed to locate the whiteboard the array also identified the walls as sufficiently similar. However, the array was able to differentiate the pen even when placed on the blue backpack.
Figure 9: Test to locate cardboard objects within image, several were missed however all white sections do correspond to cardboard objects
The third test an example of which is shown in Figure 10 produced graphs of similarly poor quality to the first test and was abandoned quickly in favor of further tests of object
Page | 16
Figure 10: Generated graph with low correlation to actual spectra
Conclusion and Future Work
Page | 17
References
[1]A. Cosentino, "Identification of pigments by multispectral imaging; a flowchart
method",
Heritage Science
, vol. 2, no. 8, 2017.
[2]S. Park and F. Huck, "Estimation of spectral reflectance curves from multispectral
image data",
Applied Optics
, vol. 16, no. 12, p. 3107, 1977.
[3]A. Bodkin, A. Shenis and A. Norton, "Snapshot Hyperspectral Imaging – the
Hyperpixel ArrayTM Camera",
Algorithms and Technoloies for Multispectral
Hyperspectal and Ultraspectral Imageery
, 2017.
[4]C. Legendre, X. Yu and P. Dubevec, "Optimal LED Selection for Multispectral
Lighting Reproduction",
SIGGRAPH
, 2017.
[5]"SPECTRAL IMAGING APPLICATIONS",
videometer
, 2017. [Online]. Available:
https://videometer.com/. [Accessed: 14- Jun- 2017].
[6]"MCI Imaging Studio |Smithsonian",
Si.edu
, 2017. [Online]. Available:
https://www.si.edu/mciimagingstudio. [Accessed: 14- Jun- 2017].
[7]J. Mansfield, "Multispectral Imaging: A Review of Its Technical Aspects and
Applications in Anatomic Pathology",
Veterinary Pathology OnlineFirst
, 2017.
[8]"Cimel Electronique | Sustainable Observing Networks",
Cimel.fr
, 2017. [Online].
Available: http://www.cimel.fr/?lang=en. [Accessed: 14- Jun- 2017].
[9]C. Legendre, X. Yu and P. Dubevec, "Efficient Multispectral Reflectance Function
Capture for Image- Based Relighting",
SIGGRAPH
, 2017.
[10]
Atmel ATmega640/V-1280/V-1281/V-2560/V-2561/V
. San Jose: Atmel Corporation,
2017.
[11]
LUXEON 5050
. San Jose: LumiLEDS, 2017.
[12]"Roscolux | Rosco",
Us.rosco.com
, 2017. [Online]. Available:
http://us.rosco.com/en/products/catalog/roscolux. [Accessed: 14- Jun- 2017].
[13]
HD Webcam C920
. Romanel-sur-Morges, Switzerland: Logitech, 2017.
[14]"OpenCV: OpenCV modules",
Docs.opencv.org
, 2017. [Online]. Available:
http://docs.opencv.org/master/. [Accessed: 14- Jun- 2017].
[15]"FR-1 (Circuit Boards) — Other Machine Co.",
Othermachine.co
, 2017. [Online].
Available: https://othermachine.co/support/materials/fr-1/. [Accessed: 14- Jun- 2017].
[16]"National Data Buoy Center",
Ndbc.noaa.gov
, 2017. [Online]. Available:
http://www.ndbc.noaa.gov/. [Accessed: 14- Jun- 2017].
Page | 18
Appendix A (ABET Senior Project Analysis)
Summary of Functional Requirements
The MultiSpectral Identification Array (MIA) is a combination of multiple filtered light sources with a camera and computer. The Array is designed to illuminate a subject with a series of up to sixty-four filtered light sources, take a picture in each lighting environment, then analyse the captured frames to produce a spectroscopy style graph for each pixel. The array, has extremely limited accuracy as a spectrometer however has shown capable of differentiating objects and thus has applications in machine vision.
Primary Constraints
The primary constraints for the project were, cost, mobility, and manufacturability. Since this device was intended to be useful for amateur data collection, ideally in marine environments, the cost, and difficulty of acquiring materials could not be prohibitive for a single individual. The total array, including camera and controlling computer also had to be sufficiently small to fit in a mobile enclosure. Finally, the array must be easy to manufacture, if necessary by hand but ideally with chemical etching or milling of surface mount circuit boards. While the software is not designed to be portable it is primarily based on the cross platform openCV library which will allow portability with relatively minor modifications.
Economic
Initial estimates of the materials costs for the project where between $142 and $712. This wide range was due to uncertainty about what primary components would be used and what the final manufacturing process would be. The main factors in the cost as estimated at the beginning of the project were the LED’s, the Camera, and the main computer. At the time the most expensive approach utilized high end colored LED’s with a DSLR camera and Nvidia Jetson TK1 stand-alone graphics board for the main computer.
The actual cost of producing an exact copy of MIA using off the shelf components is $376.11 as detailed in the Bill of Materials. However, many of the components may be obtained with little effort by recycling from other electronics. This simultaneously reduces costs and is far more environmentally friendly. The attached BOM identifies which components of the final array were recycled either from other projects, discarded electronics, or which were simply appropriated from personal supplies. Additionally, project development required roughly one and a half times as many LED’s as are listed in the final BOM so actual the per unit cost may be slightly higher to reflect price breaks.
Part Categor
y Part Type
Selected
Part Vendor Qty
Unit
Cost Cost
Purchased ?
Received
Page | 19 Central Control Main Computer hp Celeron Stream Amazo
n 1 $220 $220.00 Yes Yes
(Recycled, personal laptop was refitted to run openCV under a linux environment) https://www. amazon.com /HP-Stream- 14-ax010nr- Celeron-Personal/dp/ B01JLCKP3 4/ref=sr_1_3 ?ie=UTF8&qi d=14973084 49&sr=8-3&keywords =hp+celeron +laptop Camera Logitec C920 Amazo
n 1 $62 $61.99 No Yes
(Borrowed From CalPoly) https://www. amazon.com /Logitech- Widescreen- Calling- Recording-Desktop/dp/ B006JH8T3 S/ref=sr_1_1 ?s=pc&ie=U TF8&qid=14 97308789&s r=1-1&keywords =Logitech+C 920 Array Controller Arduino Mega128 0 Amazo
n 1 $9.99 $9.99 Yes Yes
Page | 20 pf_rd_s=des ktop-rhs-carousels&pf _rd_t=301&p d_rd_w=qzg KQ&pf_rd_i= ARduino+Me ga+1280&pd _rd_r=YBVQ BWVQ5CJP DGGGAE01 &psc=1 LED Array LED's Luxeon White Warm 3000K
SMD Digikey 64 $0.75 $48.15 Yes Yes
https://www. digikey.com/ product-detail/en/lumi leds/L150-3090502400 000/1416- 1965-1-ND/6196411 Resistor Current Limiting 100 Ohm
1/2W IEEE 64 $0.10 $6.40 Yes Yes
Copper Clad Blanks FR1 Double Sided 4"X5" OtherM
achine 4 $1.28 $5.12 Yes Yes
https://other machine.co/s tore/material s/pcb/ Filters RoscoLux Swatchbo ok Adoram
a 1 $1.75 $1.75 Yes Yes
https://www. adorama.co m/rosb.html? gclid=CMmpl 6q3udQCFY F-fgodIyAIGA Array Power Wires 24 Awg
stranded 20 $0.01 $0.20 No Yes (Recylced)
Pins
Male Pin
Page | 21 Power Suply HP 24V 132mA Printer
supply Ebay 1 $9.99 $9.99 Yes Yes (Recycled)
https://www. ebay.com/i/1 2252724173 0?chn=ps&di spItem=1 Power Switch Togle Switch SparkF
un 1 $1.75 $1.75 Yes Yes (Recycled)
https://www. sparkfun.co m/products/9 276
MOSFET IRFZ44N
Amazo
n 16 $0.27 $4.26 Yes Yes
https://www. amazon.com /SODIAL- IRFZ44N- IRFZ44- Transistor-N-Channel/dp/ B00L8VC9T K/ref=sr_1_1 ?s=electroni cs&ie=UTF8 &qid=14973 10427&sr=1-1&keywords =IRFz44N NPN
Transistor 2N3904 IEEE 8 $0.06 $0.47 Yes Yes
Pullup Resistor
4.7KOhm
1/4W IEEE 8 $0.10 $0.80 Yes Yes
Pull Down Resistor
1KOhm
1/4W IEEE 8 $0.10 $0.80 Yes Yes
ProtoBoard
universal copper rectangle
Amazo
n 1 $4.40 $4.40 Yes Yes
Page | 22
id=14973097 47&sr=1-6&keywords =protoboard
Note: Quantities listed reflect only what is required to rebuild exactly the final Multispectral Imaging Array. Additional costs were incured in development and most items must be purchased in bulk
Total $376.11
% Purchase d 87.5 Total Exclu ding Recycl ed Parts $72.15 % Received 100
Thanks to the generosity of the Innovation Sandbox for milling the printed circuit boards and a convenient surface mount soldering station provided by Dr. Bo Liu of the Bio Resource
Agricultural Engineering Department manufacturing costs were kept to a minimum. The optical spectrometer used in calibrating the array was loaned to the project by the physics department.
No initial estimates on total time in hours were made at the start of the project. However, it was estimated that the project would take the full two quarters and extend into the summer for additional development. As of the start of Senior Project Expo on Friday, 6/02/2017, I had logged 94 hours and 24 minutes in my project notebook. It is highly likely that as many as twenty hours of software development were not officially logged.
If manufactured on a commercial basis
If manufactured on a commercial basis this product would not be a bulk item. Based on the target market of marine buoys for the national data Buoy Network
[16]
and the Argo free floating sensor network[17]
the maximum total national consumption of this array would beapproximately 5200 units. These buoys are launched at a rate of roughly 800 per year. The manufacturing cost of the array is extremely low, using hand assembly the time cost is
Page | 23
Given an appropriate waterproof enclosure, users should expect approximately one noncritical component failure every two months. This is based on experience working with the present version of the array and could be dramatically improved by increasing safety tolerances and heatsinking. The array can be left on unattended for significant lengths of time, primarily depending on available storage for collected data streams. The cost to operate on a remote buoy as suggested would primarily be in terms of power and data storage. The Array requires approximately 3GB of storage per hour of runtime and uses roughly 73 watts of power. Combined this would allow the array to be used only sparingly on most conventional buoys. When attached to the California power grid at approximately 12 cents per kilowatt hour the Array requires only 20.73 cents per day of operation.
Environmental
Environmental impacts of the manufacture is primarily in the rosin core lead solder and the electricity usage of the soldering iron. The cellulose and resin based FR1 copper clad blanks are non-toxic and utilizing a CNC mill instead of chemical etching significantly reduces
manufacturing impact on the environment. This analysis ignores the high environmental cost of manufacturing the stock integrated circuits used as well as the impact of the entire laptop which is no doubt significant but is largely a proprietary secret.
Manufacturability
Describe any issues or challenges associated with manufacturing.
The most complex aspect of the project, the Array control circuit was assembled by hand using a proto-board. This aspect required approximately three hours to complete and due to a mix-up with labeling on the NPN and PNP transistors had to be redone requiring an additional half hour. This aspect of the project however could be made significantly easier and less time consuming by utilizing a milled circuit board similar to the main LED Array.
Sustainability
The hardest part of maintaining the completed system is ensuring that a control failure never occurs. In the event that a single LED is left on longer than a few minutes it will overheat and the limiting resistor will burn out. A simple watchdog timer could be added to prevent this event however this version of the Array does not include such a safety feature. Otherwise maintaining the device is a simple matter of wiping down the filters or camera lenses if they get too dusty, and ensuring that the main computer always has sufficient memory to store the video stream.
The Project is designed in part to increase collected data about water quality and marine ecosystems. If adopted it could have a positive effect against the use of harsh chemicals close to shore. However, as a one off device the manufacture and use of this device must be
Page | 24
Improvements.
Upgrades to the system which would cause a dramatic improvement are as follows.
● First redesign of the array from a hollow circle to a more maintainable standalone rectangle. The hollow circle design was intended to minimize shadows and provide a consistent incidence angle for the light however given the effective range of use this turned out to be unnecessary so long as the LED’s are within a few centimeters of each other.
● An improved casing and battery based power supply would allow the array to become mobile enough for field tests.
● Reselection of the filters used could provide more consistent results. A lot of data has been gathered on the effectiveness of the current filters and trends are clear which could advise future selection. Namely, filters which produce a thin bell curve are significantly more useful and these are most often produced by higher absorption filters.
● Additional heat sinking and safety tolerances are a high priority improvement. Full watt resistors and aluminum slinked PCB would allow the use of the Array to expand into the theatre lighting industry.
● A faster main computer would be much less frustrating to operate. The current model often struggles with heavy image processing algorithms and has low available storage for the video stream.
The primary challenge with upgrading the design is utility. More theoretical research and analysis of the project must be done to determine if further upgrades are warranted. Given that they are warranted there is very little to cost to further upgrades in either time or money with the exception of upgrading the main computer.
Ethical
Page | 25
Health and Safety
The primary health and safety concern with the Multispectral Array is the risk of triggering Photosensitive Epileptic Seizures. The flashing multicolored lights of the array closely match descriptions of common triggers of PSE seizures. This can affect many animals as well as humans. A less dangerous side effect of viewing the device in operation is a mild headache and temporary spots in the vision. The lights used are extremely bright and absolutely should not be used around species known to be sensitive to light.
Social and Political
The array is intended to be used in environmental research. As such it is potentially a politically controversial device. There is also the potential for use in cataloging or differentiating humans based on otherwise imperceptible skin coloration. This would be the absolute worst use of the device currently imaginable and is not intended in any way.
Development
During the development of this project, I learned and became proficient at surface mount
soldering, eagleCad component design, image processing techniques, and medium size project organization including the use of the git version management system. Most importantly I learned how to log nearly every hour spent on a project, to write everything down, and to keep track of all my work in an organized fashion.
Page | 26
Appendix D (Electronics Schematics)
Page | 27
Page | 28
Figure D3 shows the backside of the LED array board. This side is primarily used to conduct current to the anodes of the LED’s. Components shown are mounted on the A side.
Figure D4 shows the front side of the LED array board. This side provides the mountings for components shown. Pads for the LED’s are SMD5050 compatible. Scale shown is in
Page | 29
Page | 30
Appendix F (Software Flowchart)
Appendix G (Array Firmware)
#define NUM_AN 8#define NUM_CA 2 #define NUM_LED 16
#define ANOD_START 30 #define CATH_START 38
void setup() {
for (int i = 0; i < NUM_AN; i++) {
Page | 31
for (int i = 0; i < NUM_CA; i++) {
pinMode(i + CATH_START, OUTPUT); digitalWrite(i + CATH_START, LOW); }
Serial.begin(115200, SERIAL_8E2); }
boolean refresh; char cur_led = 0; char cur_an = 0; char cur_ca = 0;
void loop() {
while (!Serial.available()); refresh = false; switch(Serial.read()) { case 'I':
cur_led = NUM_LED; // default state is all LED off refresh = true;
break; //For other Arrays may be white
case 'N':
cur_led++;
cur_led %= NUM_LED ; break;
case 'R': refresh = true; break;
Page | 32
default : refresh = false;
break; //Other options NULL }
//Set the LED array to correct value if a refresh instruction received if (refresh) {
if (cur_led < NUM_LED) {
cur_an = cur_led % NUM_AN;
cur_ca = cur_led / (NUM_AN + 1); } else {
cur_an = NUM_AN + 1; cur_ca = NUM_CA + 1; }
for (int i = 0; i < NUM_CA; i++) { if (i != cur_ca) {
digitalWrite(i + CATH_START, LOW); } else {
digitalWrite(i + CATH_START, HIGH); }
}
for (int i = 0; i < NUM_AN; i++) { if (i != cur_an) {
digitalWrite(i + ANOD_START,HIGH); } else {
digitalWrite(i + ANOD_START, LOW);
}
Page | 33 }
//clear buffer, only one command at a time please while(Serial.available())
Serial.read();
if (refresh)
delayMicroseconds(1); //Delay to ensure all states have set Serial.write(cur_led);
Serial.write(cur_led); Serial.print("e");
//Serial.println(cur_led + 0); }
Appendix H (Software)
For full Software please see the git repository at: