DOI 10.1007/s10910-009-9564-y
O R I G I NA L PA P E R
A mathematical model for a copolymer in an emulsion
F. den Hollander · N. Pétrélis
Received: 3 June 2007 / Accepted: 22 April 2009 / Published online: 16 July 2009 © The Author(s) 2009. This article is published with open access at Springerlink.com
Abstract In this paper we review some recent results, obtained jointly with Stu Whittington, for a mathematical model describing a copolymer in an emulsion. The copolymer consists of hydrophobic and hydrophilic monomers, concatenated ran-domly with equal density. The emulsion consists of large blocks of oil and water, arranged in a percolation-type fashion. To make the model mathematically tractable, the copolymer is allowed to enter and exit a neighboring pair of blocks only at diago-nally opposite corners. The energy of the copolymer in the emulsion is minusαtimes the number of hydrophobic monomers in oil minusβtimes the number of hydrophilic monomers in water. Without loss of generality we may assume that the interaction parameters are restricted to the cone{(α, β)∈R2: |β| ≤α}. We show that the phase diagram has two regimes: (1) in the supercritical regime where the oil blocks perco-late, there is a single critical curve in the cone separating a localized and a delocalized phase; (2) in the subcritical regime where the oil blocks do not percolate, there are three critical curves in the cone separating two localized phases and two delocalized phases, and meeting at two tricritical points. The different phases are characterized by different behavior of the copolymer inside the four neighboring pairs of blocks.
Keywords Random copolymer·Random emulsion·Localization·Delocalization· Phase transition·Percolation
Invited paper on the occasion of the 65th birthdays of Ray Kapral and Stu Whittington from the Department of Chemistry at the University of Toronto.
F. den Hollander (
B
)Mathematical Institute, Leiden University, P.O. Box 9512, 2300 RA, Leiden, The Netherlands e-mail: [email protected]
F. den Hollander·N. Pétrélis
1 Introduction
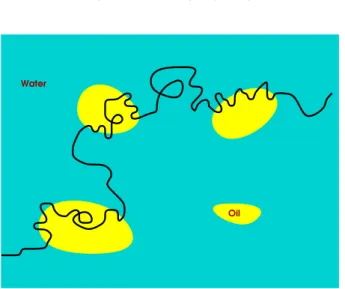
The physical situation we want to model is that of a copolymer in an emulsion (see Fig.1). The random interface model described below was introduced in den Hollander and Whittington [3], where the qualitative properties of the phase diagram were obtained. Finer details of the phase diagram are derived in den Hollander and Pétrélis [4,5].
1.1 The model
Each positive integer is randomly labelled A or B, with probability12 each, indepen-dently for different integers. The resulting labelling is denoted by
ω= {ωi: i ∈N} ∈ {A,B}N (1.1)
and represents the randomness of the copolymer, with A indicating a hydrophobic monomer and B a hydrophilic monomer. Fix p∈(0,1)and Ln∈N. PartitionR2into
square blocks of size Ln:
R2=
x∈Z2
Ln(x), Ln(x)=x Ln+(0,Ln] 2.
(1.2)
Each block is randomly labelled A or B, with probability p, respectively, 1− p,
independently for different blocks. The resulting labelling is denoted by
= {(x): x∈Z2} ∈ {A,B}Z2 (1.3)
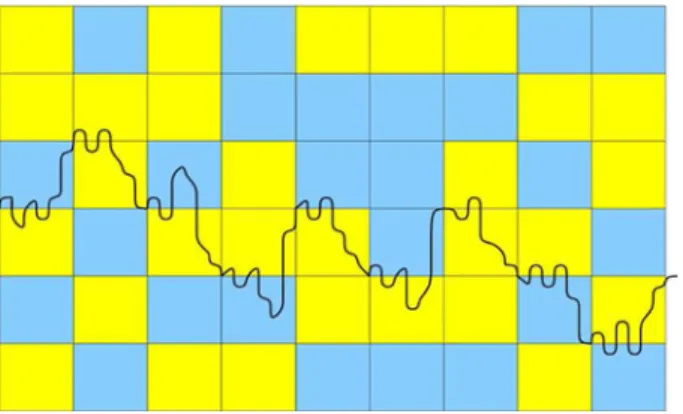
Fig. 2 A directed self-avoiding path crossing blocks of oil and water diagonally. The light-shaded blocks
are oil, the dark-shaded blocks are water. Each block is Lnlattice spacings wide in both directions. The
path carries hydrophobic and hydrophilic monomers on the lattice scale, which are not indicated
and represents the randomness of the emulsion, with A indicating an oil block and B a water block (see Fig.2).
LetWnbe the set of n-step directed self-avoiding paths starting at the origin and
being allowed to move upwards, downwards and to the right. Let
• Wn,Ln is the subset ofWnconsisting of those paths that enter blocks at a corner, exit blocks at one of the two corners diagonally opposite the one where they entered, and in between stay confined to the two blocks that are seen upon entering.
In other words, after the path reaches a site x Lnfor some x∈Z2, it must make a step
to the right, it must subsequently stay confined to the pair of blocks labelled x and
x+(0,−1), and it must exit this pair of blocks either at site x Ln+(Ln,Ln)or at site
x Ln+(Ln,−Ln)(see Fig.2). This restriction—which is put in to make the model
mathematically tractable—is unphysical. Nonetheless, the model has physically very relevant behavior.
Givenω, and n, with each pathπ∈Wn,Ln we associate an energy given by the Hamiltonian
Hnω,,L
n(π)= −
n
i=1
α1
ωi =L(πni−1,πi)=A
+β1
ωi =(πLni−1,πi)=B
, (1.4)
whereα, β ∈RandLn
(πi−1,πi)denotes the label of the block that the edge(πi−1, πi) lies in. What this Hamiltonian does is count the number of A A-matches and
B B-matches and assign them energy−αand−β, respectively. Note that the interac-tion is assigned to edges rather than to vertices, i.e., we identify the monomers with the steps of the path. We will see shortly that without loss of generality we may restrict the interaction parameters to the cone
1.2 The free energy
Givenω, and n, we define the quenched free energy per step as
fnω,,L
n = 1
n log Z
ω, n,Ln,
(1.6)
Zω,n,L
n =
π∈Wn,Ln exp
−Hnω,,L
n(π) .
We are interested in the limit n→ ∞subject to the restriction
Ln→ ∞ and
1
nLn→0. (1.7)
This is a coarse-graining limit where the path spends a long time in each single block yet visits many blocks. In this limit, there is a separation between a copolymer scale and an emulsion scale (see Fig.2).
The starting point of the analysis is the following variational representation of the free energy. Let
• Ais the set of all 2×2-matrices(akl)kl∈{A,B}2whose elements are≥2.
• R(p)is the set of all 2×2 matrices(ρkl)kl∈{A,B}2 whose elements are the possi-ble limiting frequencies at which the four types of block pairs are visited along a
coarse-grained path (=a path on the corners of the blocks crossing diagonally), with k indicating the label of the block that is crossed and l indicating the label of the block that is not crossed (see Fig.3).
• (ψkl(α, β;akl))kl∈{A,B}2is the 2×2 matrix of free energies per step of the copoly-mer in a kl-block of size L×L when the total number of steps inside the block
is aklL, in the limit as L→ ∞.
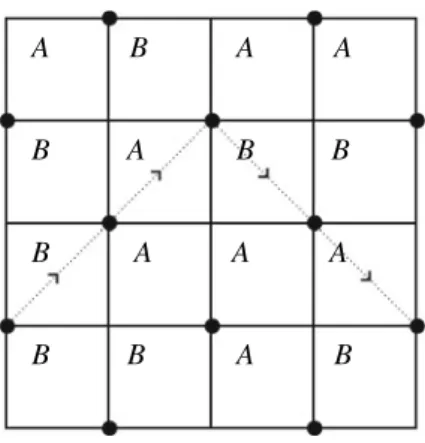
Fig. 3 The coarse-grained path
sampling. The dashed lines
with arrows, which denote the
steps in this path, indicate where the copolymer enters and exits. In between, the copolymer stays confined to the two neighboring blocks, as in Fig.2. The block pairs visited by the
coarse-grained path in this example are B B, A A, B A and
A B, where the first (second)
symbol indicates the type of block that is crossed (not crossed) diagonally
A B A A
B A B B
B A A A
Theorem 1.1 For all(α, β)∈R2and p∈(0,1),
lim
n→∞ f
ω,
n,Ln = f = f(α, β;p) (1.8)
existsω, -a.s., is finite and non-random, and is given by
f = sup
(akl)∈A sup
(ρkl)∈R(p)
klρklaklψkl(α, β;akl)
klρklakl .
(1.9)
Theorem1.1says that the free energy per step is obtained by keeping track of the times spent in each of the four types of block pairs, summing the free energies of the four types of block pairs given these times, and afterward optimizing over these times and over the coarse-grained random walk. Note that the latter carries no entropy, because of (1.7). For details of the proof we refer to den Hollander and Whittington [3].
It can be shown that f(α, β;p)is convex in(α, β)and continuous in p, and has the symmetry properties
f(α, β;p)= f(β, α;1−p),
(1.10)
f(α, β;p)= 1
2(α+β)+ f(−β,−α;p).
These equations are the reason why without loss of generality we may restrict the parameters to the cone in (1.5).
Theorem1.1shows that, in order to get the phase diagram, what we need to do is collect the necessary information on the two key ingredients of (1.9), namely, the four block pair free energiesψkl, k,l∈ {A,B}, and the percolation setR(p). We will see
that only very little is needed aboutR(p).
The behavior of f as a function of(α, β)is different for p ≥ pc and p < pc,
where pc≈0.64 is the critical percolation density for directed bond percolation on
the square lattice. The reason is that the coarse-grained paths, which determine the
setR(p), samplejust like paths in directed bond percolation on the square lattice rotated by 45 degrees sample the percolation configuration (see Fig.3).
1.3 Free energies per pair of blocks
Because A A-blocks and B B-blocks have no interface, we have for all(α, β) ∈ R2 and a≥2,
ψA A(α, β;a)=21α+κ(a,1) and ψB B(α, β;a)=12β+κ(a,1), (1.11)
whereκ(a,1)is the entropy per step of walks that diagonally cross a block of size
L×L in a L steps, in the limit as L → ∞. There is an explicit formula forκ(a,1), which we will not specify here.
To computeψA B(α, β;a)andψB A(α, β;a)is harder. The following variational
Proposition 1.2 For all(α, β)∈R2and a≥2,
aψA B(α, β;a)= sup
0≤b≤1,c≥b a−c≥2−b
cφI(α, β;c/b)+(a−c)12α+κ(a−c,1−b),
(1.12)
whereφI(α, β;c/b)is the free energy per step associated with walks running along a linear interface over a distance cL in bL steps, andκ(a−c,1−b)is the entropy per step of walks that diagonally cross a block of size(1−b)L×L in(a−c)L steps, both in the limit as L→ ∞.
There is an explicit formula forκ(a−c,1−b), which we will not specify here either. The idea behind Proposition1.2is that the copolymer follows the A B-interface over a distance bL during cL steps and then wanders away from the A B-interface to the diagonally opposite corner over a distance(1−b)L during(a−c)L steps. The
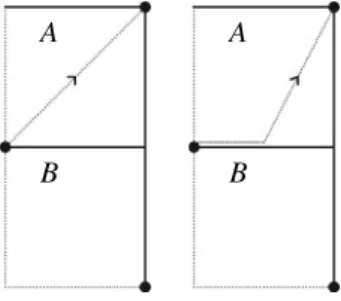
opti-mal strategy is obtained by maximizing over b and c (see Fig.4). A similar variational expression holds forψB A.
With (1.11) and (1.12) we have identified the four block pair free energies in terms of the single linear interface free energyφI. This constitutes a major simplification, in view of the methods and techniques that are available for linear interfaces. We refer the reader to the monographs by Giacomin [1] and den Hollander [2], which describe a body of mathematical ideas, techniques and results for copolymers in the vicinity of linear interfaces.
1.4 Percolation set
Let
ρ∗(p)= sup
(ρkl)∈R(p)
[ρA A+ρA B]. (1.13)
This is the maximal frequency of A-blocks crossed by an infinite coarse-grained path. The graph of p →ρ∗(p)is sketched in Fig.5. For p≥ pcthe oil blocks percolate,
and the maximal time spent in the oil by a coarse-grained path is 1. For p< pc, on the
other hand, the oil blocks do not percolate and the maximal time spent in the oil is<1.
Fig. 4 Two possible strategies
inside an A B-block: The path can either move straight across or move along the interface for awhile and then move across. Both strategies correspond to a coarse-grained step diagonally upwards
A
B
A
Fig. 5 Qualitative picture of
p →ρ∗(p)
For(α, β)∈CONE, the copolymer prefers the oil over the water. Hence, the behavior of the copolymer changes at p= pc.
2 Phase diagram forp≥pc
The phase diagram is relatively simple in the supercritical regime. This is because the
oil blocks percolate, and so the coarse-grained path can choose between moving into
the oil or running along the interface between the oil and the water (see Fig.6). The key result identifying the critical curve in the supercritical regime is the follow-ing. Note that the criterion in (2.1) is in terms of the free energy of the single interface, and does not (!) depend on p.
Proposition 2.1 Let p≥ pc. Then(α, β)∈Lif and only if
sup
μ≥1
μφI(α, β;μ)−1 2α−
1
2log 5 > 1 2log
9
5. (2.1) Proposition2.1says that localization occurs if and only if the free energy per step for the single linear interface exceeds the free energy per step for an A A-block by a
certain positive amount. This excess is needed to compensate for the loss of entropy that occurs when the path runs along the interface for awhile before moving upwards from the interface to end at the diagonally opposite corner (recall Fig.4). The constants
1
2log 5 and 1 2log
9
5are special to our model. For the proof of Proposition2.1we refer the reader to den Hollander and Whittington [3].
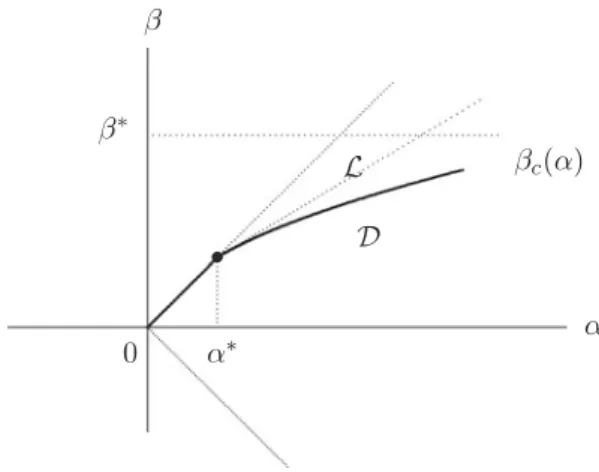
With the help of Proposition2.1we can identify the supercritical phase diagram. This runs via an analysis of the single interface free energyφI, for which we again refer to den Hollander and Whittington [3]. The phase diagram is sketched in Fig.7. The two phases are characterized by
D= {(α, β)∈CONE: f(α, β;p)= 12α+12log 5},
(2.2)
L= {(α, β)∈CONE: f(α, β;p) > 12α+12log 5},
and are separated by a single critical curveα →βc(α).
The intuition behind the phase diagram is as follows. Pick a point(α, β)insideD. Then the copolymer spends almost all of its time deep inside the A-blocks. Increaseβ while keepingαfixed. Then there will be a larger energetic advantage for the copoly-mer to move some of its monocopoly-mers from the A-blocks to the B-blocks by crossing
the interface inside the A B-block pairs. There is some entropy loss associated with
doing so, but ifβ is large enough, then the energy advantage will dominate, so that
A B-localization sets in. The value at which this happens depends onαand is strictly positive. Since the entropy loss is finite, forαlarge enough the energy-entropy com-petition plays out not only below the diagonal, but also below a horizontal asymptote. On the other hand, forαsmall enough the loss of entropy dominates the energetic advantage, which is why the critical curve has a piece that lies on the diagonal. At the critical value α∗, the critical curve has a slope discontinuity, because the linear interface free energy is already strictly inside its localized region. The larger the value ofαthe larger the value ofβ where A B-localization sets in. This explains why the critical curve moves to the right and up.
In den Hollander and Pétrélis [4] the following theorem is proved, which completes the analysis of the phase diagram in Fig.7.
Theorem 2.2 Let p≥ pc.
(i) α →βc(α)is strictly increasing on[0,∞).
(ii) For everyα∈(α∗,∞)there exist 0<C1<C2<∞andδ0>0(depending
on p andα)such that
C1δ2≤ f (α, βc(α)+δ;p)− f (α, βc(α);p)≤C2δ2 ∀δ∈(0, δ0]. (2.3)
(iii) (α, β) → f(α, β;p)is infinitely differentiable throughoutL.
Fig. 7 Qualitative picture of the
phase diagram for p≥pc. There are two phases, separated by a single critical curve
α →βc(α)
(ii) shows that the phase transition along the critical curve in Fig.7is second order
off the diagonal. Theorem2.2(iii) tells us that the critical curve in Fig.7is the only location inCONEwhere a phase transition of finite order occurs.
3 Phase diagram forp < pc
In the subcritical regime the phase diagram is much more complex than in the super-critical regime. The reason is that the oil does not percolate, and so the copolymer no longer has the option of moving into the oil nor of running along the interface between the oil and the water (in case it prefers to localize). Instead, it has to every now and then cross blocks of water, even though it prefers the oil.
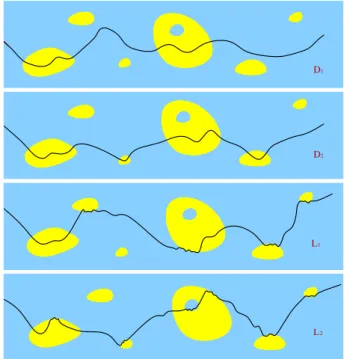
It turns out that there are three (!) critical curves, all of which depend on p. The phase diagram is sketched in Fig.8. For details on the derivation, we refer to den Hollander and Pétrélis [5]. The copolymer has the following behavior in the four phases of Fig.8, as illustrated in Figs.9and10:
– D1: fully delocalized into A-blocks and B-blocks, never inside a neighboring pair. – D2: fully delocalized into A-blocks and B-blocks, sometimes inside a neighboring
pair.
– L1: partially localized near the interface in pairs of blocks of which the B-block is crossed diagonally.
– L2: partially localized near the interface in both types of blocks.
(This is to be compared with the much simpler behavior in the two phases of Fig.7, as given by Fig.4.)
The intuition behind the phase diagram is as follows. InD1andD2,βis not large enough to induce localization. In both types of block pairs, the reward for running along the interface is too small compared to the loss of entropy that comes with hav-ing to cross the block at a steeper angle. InD1, whereαandβ are both small, the copolymer stays on one side of the interface in both types of block pairs. InD2, where
Fig. 8 Qualitative picture of the
phase diagram for p<pc. There are four phases, separated by three critical curves, meeting at two tricritical points
Fig. 9 Behavior of the copolymer, inside the four block pairs containing oil and water, for each of the four
phases in Fig.8
doing the crossing. Sinceβis small, it still has no interest to localize. InL1andL2,β is large enough to induce localization. InL1, whereβis moderate, localization occurs in those block pairs where the copolymer crosses the water rather than the oil. This is becauseα > β, making it more advantageous to localize away from water than from oil. InL2, whereβis large, localization occurs in both types of block pairs.
L
1
D1
D2
L
2
Fig. 10 Illustration of the four phases in Fig.8according to Fig.9. Compare with Fig.6
αandβ. Note that there are two tricritical points, one that depends on p and one that does not.
Very little is known so far about the fine details of the four critical curves in the subcritical regime. The reason is that in none of the four phases does the free energy take on a simple form (contrary to what we saw in the supercritical regime, where the free energy is simple in the delocalized phase). In particular, in the subcritical regime there is no simple criterion like Proposition2.1to characterize the phases. In den Hollander and Pétrélis [5] it is shown that the phase transition betweenD1 and
D2and betweenD1andL1is second order, while the phase transition betweenD2 andL1is at least second order. It is further shown that the free energy is infinitely differentiable in the interior ofD1andD2. The same is believed to be true forL1and
L2, but a proof is missing.
It was argued in den Hollander and Whittington [3] that the phase diagram is
dis-continuous at p= pc. Indeed, none of the three critical curves in the subcritical phase
diagram in Fig.8converges to the critical curve in the supercritical phase diagram in Fig.7 as p ↑ pc. This is because percolation versus non-percolation of the oil
completely changes the character of the phase transition(s).
Acknowledgments NP was supported by a postdoctoral fellowship from the Netherlands Organization for Scientific Research (grant 613.000.438).
References
1. G. Giacomin, Random Polymer Models (Imperial College Press, London, 2007)
2. F. den Hollander, Random Polymers, Lecture Notes in Mathematics 1974 (Springer, Berlin, 2009) 3. F. den Hollander, S.G. Whittington, Localization transition for a copolymer in an emulsion. Theor. Prob.
Appl. 51, 193–240 (2006)
4. F. den Hollander, N. Pétrélis, On the localized phase of a copolymer in an emulsion: supercritical percolation regime. Commun. Math. Phys. 285, 825–871 (2009)