THE ROLE OF AtGEN1 IN ARABIDOPSIS THALIANA MEIOTIC RECOMBINATION
Daniela Fernanda Muñoz
A thesis submitted to the faculty at the University of North Carolina at Chapel Hill in partial fulfillment of the requirement for the degree of Master of Science in the
Curriculum in Genetics and Molecular Biology in the Medical School.
Chapel Hill 2016
Approved by:
Gregory P. Copenhaver Jeff Sekelsky
© 2016
ABSTRACT
Daniela Muñoz : The role of AtGEN1 in Arabidopsis thaliana meiotic recombination
Under the direction of: Gregory P. Copenhaver
During prophase of meiosis I, homologous chromosomes pair, synapse and exchange DNA by recombining through crossovers (COs). Recombination is necessary in many organisms for correct chromosome segregation, and thus fertility, including in humans and the plant Arabidopsis thaliana (Osman et al., 2011). The enzyme(s) that resolves what is thought to be the main intermediate DNA structure of recombination, a double Holliday junction (dHJ), remains elusive in most eukaryotes including in Arabidopsis. Three nuclear
endonucleases have been found resolve eukaryotic HJs in vitro: Mus81-Mms4 (EME), Slx1-Slx4 and, Yen1/GEN1. AtMUS81 generates about 15% of all COs (Berchowitz et al., 2007), while the two homologs of the SLX1-SLX4 complex have been identified but remain to be characterized (At2g30350 and At5g43210). In humans Mus81-Mms4 (EME), Slx1-Slx4 have been found to work in the same pathway, which is separate from GEN1’s activity (reviewed by (West et al., 2015)). Arabidopsis has two Yen1/GEN1orthologs: AtGEN1 (At1g01880) and
these genes. Bauknecht and Kobbe demonstrated that both AtGEN1 and AtSEND1 have dHJ resolving activity in vitro (Bauknecht and Kobbe, 2014). Olivier et. al went more deeply into understanding the role of AtGEN1 and AtSEND1 in DNA repair and meiosis (Olivier et al., 2015). This is the first characterization of these genes in Arabidopsis and revealed that knockout of
AtGEN1 and AtSEND1 single and double mutants do not show growth defects, sensitivity to DNA damage or infertility. They also demonstrated that the
combined loss of AtMUS81 and AtSEND1 leads to severe developmental
ACKNOWLEDGEMENTS
TABLE OF CONTENTS
LIST OF TABLES………...…viii
LIST OF FIGURES……….ix
LIST OF ABBREVIATIONS...x
LIST OF SYMBOLS………...xii
CHAPTER I: THE ROLE OF GEN1 IN ARABIDOPSIS THALIANA MEIOTIC RECOMBINATION...1
INTRODUCTION...1
HOLLIDAY JUNCTION RESOLUTION...7
METHODS...14
FLUORESCENT-TAGGED-LINES (FTLs)...14
SALK T-DNA LINE IDENTIFICATION...16
PLANT GROWTH...18
DNA EXTRACTION...19
GENOTYPING AND SEQUENCING...20
POLLEN TETRAD COUNTING...23
RESULTS...24
DISCUSSION...31
LIST OF TABLES
TABLE 1 – FTLs (Fluorescent Tagged Lines) used in this study...15
TABLE 2 – Primers for identification of T-DNA insertions in AtGEN1-1 and AtGEN12...20
TABLE 3 – Tetrad counting data and analysis for Set#1 AtGEN1-1...27
TABLE 4 – Tetrad counting data and analysis for Set#2 AtGEN1-1...28
LIST OF FIGURES
FIGURE 1 – Model of meiotic recombination...6 FIGURE 2 – Central question: is AtGEN1 involved in CO or NCO
formation in Arabidopsis?...13 FIGURE 3 – A) Fluorescent-Tagged-Line insertional cassette.
B) Location of FTL interval I3a, GEN1 and SEND1 in the Arabidopsis genome.
C) Graphic depiction of patterns of fluorescence observed in
counted pollen tetrads...15 FIGURE 4 – Gene model of Arabidopsis AtGEN1...18 FIGURE 5 – Gene model of Arabidopsis AtSEND1...18 FIGURE 6 – Gel Electrophoresis of PCR products of AtGEN1-1
and AtGEN1-2...27 FIGURE 7 – Genetic distances between siblings segregating
for the Atgen1-1-/- mutation...28 FIGURE 8 – Genetic distances between siblings segregating
LIST OF ABBREVIATIONS
bp Base pairs
CFP Cyan fluorescent protein
cM Centimorgan (1cM = 1%recombination)
CO Crossover
Col Columbia ecotype of Arabidopsis thaliana
DCO Double-crossover dHJ double-Holliday junction DNA Deoxyribonucleic acid DSB Double strand break
DSBR Double-Strand-Break-Repair
dsRED Discosoma sp. red fluorescent protein FTL Fluorescent-Tagged-Lines
GC Gene conversion
HJ Holliday junction
HR Homologous recombination
I Interval
JM Joint molecule
Mb Megabase (1 million base pairs) NCO Non-crossover
PGM Pollen growth media
qrt quartet mutation RNA Ribonucleic acid
RTR RECQ4A, AtTOP3α, AtRMI1 protein group SC Synaptonemal complex
SCO Single crossover
SDSA Synthesis-Dependent-Strand-Annealing SE Standard error
SEI Single-end invasion ssDNA Single-stranded DNA T-DNA Transfer DNA
TT Tetratype
wt Wild type
LIST OF SYMBOLS
ʹ′ Prime Symbol
⊗ Self-crossing SPO11 Protein ✃ Resolvase ⁌ Helicase
CHAPTER I: UNDERSTANDING THE ROLE OF AtGEN1 IN
ARABIDOPSIS THALIANA MEIOTIC RECOMBINATION
INTRODUCTION:
During sexual reproduction, diploid organisms (such as humans and the model plant Arabidopsis thaliana) must halve their genomes in order to create haploid gametes (sperm and eggs) through meiosis. Once fertilization occurs, ploidy is restored and a diploid zygote is produced. Prior to entering meiosis the genome is duplicated, therefore at the onset of meiosis there are four chromatids per pair of homologous chromosomes, which will end up in four separate
gametes. Meiosis is a two-step cell division, separating homologous
There are many known regulatory events in Arabidopsis HR (and other eukaryotes studied), which determine the number and placement of CO events. Two examples of these regulatory events are CO assurance and CO
interference, which remain to be fully understood (Jones and Franklin, 2006; Berchowitz and Copenhaver, 2010; Osman et al., 2011). CO assurance makes sure at least one CO event occurs per chromosome. This is called the “obligate CO” (Page and Hawley, 2003; Tercero and Boulton, 2011). Interference is a phenomenon that decreases the chances of COs occurring nearby other CO events (Sturtevant, 1915; Copenhaver et al., 2002; Berchowitz and Copenhaver, 2010). Research has shown that Arabidopsis possesses both CO assurance and CO interference, though how sites are chosen to be CO or NCOs is yet to be understood. HR is a necessary step in meiosis for a great majority of eukaryotes studied; in its absence catastrophic chromosomal errors occur leading to sterility as is the case in Arabidopsis(Grelon et al., 2001). HR can also lead to new allelic combinations, and breakage of linkage between genes. Therefore, from an
agricultural standpoint, understanding meiotic recombination is vital for crop breeding.
structures produced at different steps during recombination (Allers and Lichten, 2001). The DSBR model asserts that HR begins by the introduction of
coordinated genome-wide double-strand-breaks (DSBs) (Klar and Miglio, 1986; Paigen and Petkov, 2012; Lam and Keeney, 2015). Research has shown that in Arabidopsis (and other eukaryotes such as S. cerevisiae) the final number of COs is orders of magnitude smaller than the initial number of DSBs, therefore the great majority of DSBs become non-crossovers (NCOs) (Allers and Lichten, 2001). How DSBs are destined to become either COs or NCOs is not yet understood and it’s the aim of much research.
At this juncture, the Synthesis-Dependent-Strand-Annealing (SDSA) pathway can lead to the dissolution of JMs, producing NCOs (Allers and Lichten, 2001; McMahill et al., 2007). In S. cerevisiae it is believed that virtually all NCOs are formed at this step. It is difficult to confirm this in multicellular metazoans, as synchronized meiosis cannot be induced. JMs can either be dissolved by the action of helicases, be processed by structure-selective endonucleases (SSEs), or continue through the DSBR pathway. These helicases and SSEs are important not only in HR, but also in the context of DNA repair in general, as JMs can be formed during replication and mitotic recombination (Wyatt and West, 2014).
recombination) can lead to either COs or NCOs depending on the orientation of the cuts introduced at the two Holliday junctions: if cuts are co-oriented NCOs are formed, whereas if the cuts oppositely-oriented COs are made.
In many organisms, the DSBR pathway can resolve COs in two ways: a class I pathway which is sensitive to nearby CO formation (interference), and a class II pathway which is interference-insensitive (de los Santos et al., 2003; Falque et al., 2010; Osman et al., 2011). Our lab and others demonstrated that Arabidopsis has both of these pathways (Higgins, 2004; Berchowitz et al., 2007; Berchowitz and Copenhaver, 2010; Osman et al., 2011).
Holliday junction resolvases have been found in bacteria, archae, and eukaryotes (Wyatt and West, 2014). Because of the great overlap that exists in the mechanisms and enzymes needed during DNA repair, mitotic recombination, and HR (Matos and West, 2014; Wyatt and West, 2014), there seems to be a high level of homology in eukaryotic resolvases. So far there are three nuclear eukaryotic endonucleases have been found to resolve Hjs in-vitro: Mus81-Mms4 (EME), Slx1-Slx4 and, Yen1/GEN1. Mus81-Mms4 and Slx1-Slx4 have been found to act in the same resolution pathway, whereas Yen1/GEN1 acts
GEN1; AtGEN1 and AtSEND1 (Bauknecht and Kobbe, 2014). The aim of this work is to understand the role that AtGEN1 plays in Arabidopsis HR.
Fig. 1 – Model of meiotic recombination. Homologous chromosomes pair and DSBs are
Holliday Junction Resolution
How Holliday junctions are processed in different eukaryotes is a highly debated and studied subject (Tercero and Boulton, 2011). Based on work done in
JMs destined to become COs are thought to only be dHJs, and are
processed by resolvases. The main resolvase(s) which cleaves dHJs is yet to be identified in most organisms (Schwartz and Heyer, 2011) including in
Arabidopsis. Three nuclear endonucleases have been found to resolve HJs in vitro; Slx1-Slx4, Mus81-Mms4 (EME), and Yen1/Gen1. Arabidopsis has orthologs of Slx1-Slx4 whose role in HR is yet to be described, but it does have
well-characterized homologs of the Mus81-Mms4 (EME) complex. Previous work from our lab described the role of the endonuclease AtMUS81 (endonuclease MMS and UV-sensitive protein81) in class II COs in Arabidopsis (Berchowitz et al., 2007), which creates about 15-20% of all COs. So far AtMUS81 is the only known resolvase that has a role in meiotic recombination in Arabidopsis
(Berchowitz et al., 2007). Since AtMus81 generates a small fraction of COs, the majority of COs in Arabidopsis are resolved by an unknown endonuclease (Berchowitz et al., 2007).
HR, chromosomal missegregation is observed, thus Atmsh4/Atmsh5 mutants display a severe infertility phenotype. Interestingly, upon the loss of AtMSH4 and AtMUS81, ~10% of Arabidopsis COs remain (Berchowitz et al., 2007b). This phenomenon is also observed in other eukaryotes; in S. cerevisiae upon loss of known resolution pathways ~20% COs are still formed, in Drosophila ~10% COs, and in S. pombe ~15%, leading to the suggestion that an unknown resolvase(s) is creating COs when the main resolution pathways are not present (Schwartz and Heyer, 2011).
In the search for dHJ resolvases, XPG-like endonuclease1 (GEN1) was identified by mass spectrometry from human HeLa cell-free extracts, whereas the
S. cerevisiae’s ortholog Yen1, was detected by searching a yeast gene fusion library for nucleases capable of HJ resolution (Ip et al., 2008). Yen1 and GEN1 are part of the Rad2/XPG family of nucleases, which act in DNA repair, with a number of members linked to human cancers (Torgovnick and Schumacher, 2015). Unlike MUS81, Yen1/GEN1 acts as a “canonical resolvase”, meaning that it introduces symmetrical cuts across a HJ, creating easily ligatable products (Wyatt and West, 2014). Since its discovery, orthologs of Yen1/GEN1 have been found and studied in Drosophila, C. elegans, Rice (Oryza sativa), and A. thaliana.
In S. cerevisiae Yen1 is partially redundant with Mus81 (Ma, 2006; Blanco et al., 2010), thus in the absence of Mus81, Yen1 is used to process unresolved
Harper, 2010; Matos et al., 2011; Schwartz and Heyer, 2011; Chen and Åström, 2012).
In Drosophila, DmGEN1 has been found to play an important role in mitotic recombination, whereas its meiotic role is diminished (Andersen et al., 2011)(Bellendir and Sekelsky, 2013) thus showing divergence of function
amongst eukaryotes. In C. elegans GEN1 resolves meiotic intermediates, and is also required for proper progression through meiosis in a separable role from its resolving activity (2004; Bailly et al., 2010; Blanco et al., 2010). Though S. pombe resolves virtually all HJs through Mus81 and lacks an ortholog of Yen1/GEN1, ectopic expression of human GEN1 rescues HJ resolution in the absence of Mus81 (Lorenz et al., 2010). This last piece of evidence is important, as it shows that the HJ resolution function of GEN1 in-vitro, translates into an in-vivo system (Lorenz et al., 2010).
The rice homolog of GEN1 (OsGEN1-L) has been found to be important in anther development while its vegetative development seems to be normal
Arabidopsis has two orthologs of Yen1/GEN1; AtGEN1 (At1g01880) and AtSEND1 (At3g48900), named after the rice OsSEND1. Kobbe et al. isolated and studied the biochemical properties of AtGEN1 and AtSEND1. They found that the N-terminal regions of AtGEN1 and AtSEND1 share about 34% amino acid
similarity, and also share about 18% and 28% respectively in amino acid sequence similarity with their homologs from S. cerevisiae, Drosophila, C. elegans, and humans. As members of the Rad2/XPG family of endonucleases, AtGEN1 and AtSEND1 have the characteristic domains of the family; a XPG-N (N-terminal) domain, a short linker sequence, and a XPG-I (internal) domain followed by a partially overlapping helix-hairpin-helix domain (Bauknecht and Kobbe, 2014).
Kobbe. et al, also demonstrated that both AtGEN1 and AtSEND1 have the ability to resolve various DNA structures in-vitro, including dHJs. AtGEN1 and AtSEND1 were both found to act as canonical resolvases, introducing
symmetrical cuts across HJs, but they show different preferred sequences (Bauknecht and Kobbe, 2014). It will be interesting in the near future to
In a recent publication by Olivier et.al, they begin to characterize the roles of AtGEN1 and AtSEND1 in Arabidopsis DNA repair. They found that single and double mutants AtGEN1 and AtSEND1 are fertile, thus showing that they are not the main dHJ resolvases in Arabidopsis. They also found that in Arabidopsis, as in Drosophila, in the absence of AtMUS1AtSEND1 is an important backup endonuclease. The double mutants of AtMUS1 and AtSEND1 show severe developmental defects, yet double mutants of AtMUS1 and AtGEN1 do not show this phenotype, therefore in Arabidopsis AtGEN1 and AtSEND1 have evolved different functions.
METHODS:
FLUORESCENT-TAGGED-LINES (FTLs)
Tetrad analysis is an important tool in the study of meiosis and recombination (Mather and Beale, 1942). This method has been largely
developed in fungi, where analysis of all spores produced allows assessment of parental chromosomal behavior. Yet this powerful technique is not possible in most eukaryotes. The Arabidopsis qrt mutation results in the production of groups of four meiotically-related pollen grains bound by their outer cell walls, with their cytoplasm remaining separate (Preuss et al., 1994). This mutation has allowed the development of tetrad analysis in a higher eukaryote by the Copenhaver lab utilizing post-meiotic expression of fluorescent proteins from known chromosomal locations (Copenhaver et al., 2000; Francis et al., 2007; Berchowitz and
Copenhaver, 2008).
marker(s) at a known genomic location. These lines have been extensively backcrossed and checked to make sure that no other insertion site exists, and thus FTLs plants are wild-type besides at the site of the insertion and qrt.
Two or three FTLs can be combined in order to create genetic intervals, and recombination between these two sites is studied by analyzing the
distribution of the fluorescent marker proteins (Fig. 3c). This study used interval I3a, made up of two FTLs, one encoding CYAN (FTL1500) and the other dsRED (FTL1371) (Table 1) located on chromosome 3 in cis and separated by
approximately 4 MB (Berchowitz et al., 2007) (Fig.3b). Using tetrad analysis we can calculate recombination rates by utilizing the Perkins equation (Perkins, 1949). Depending on the separation of the markers three different patterns can be observed; a parental ditype (PD), non-parental ditype (NPD), and a tetratype (T) (Fig. 3c).
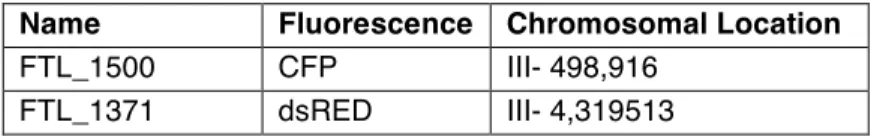
Name Fluorescence Chromosomal Location
FTL_1500 CFP III- 498,916 FTL_1371 dsRED III- 4,319513
Fig. 3 - A) Fluorescent-Tagged-Line insertional cassette. B) Location of FTL interval I3a, GEN1
and SEND1 in the Arabidopsis genome. C) Graphic depiction of patterns of fluorescence observed in counted pollen tetrads.
SALK T-DNA LINE IDENTIFICATION
Utilizing the “Blast Sequence Analysis Tool” by NCBI (Madden, 2013) a search using the human GEN1 protein sequence was used to find orthologs in Arabidopsis. The search yielded two genes in Arabidopsis, At1g01880 (AtGEN1) and At3g48900 (AtSEND1); located in chromosome 1 and chromosome 3
were identified. Two insertional mutant lines were selected for AtGEN1;
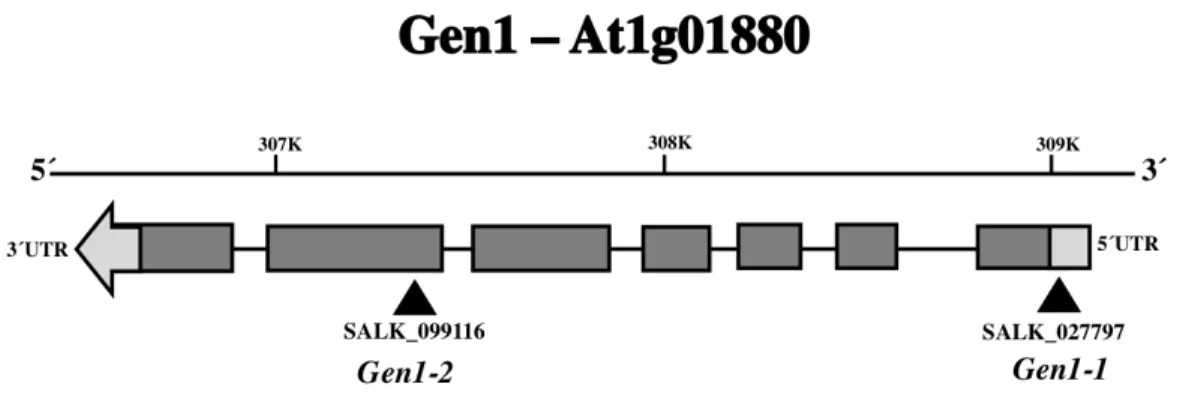
Salk_027797 (GEN1-1) and Salk_099116 (GEN1-2) (Fig. 4). Although recently a knockout allele of AtGEN1 has been described, unfortunately it belongs to a different ecotype of Arabidopsis known as Wassilewskija (WS). Our FTL system uses the Columbia ecotype; therefore to avoid possible problems with SNPs, it would be better to find an insertional mutant in this background.
Though not used in this study, T-DNA insertional lines were also identified for AtSEND1; Salk_106839 (SEND1-1), and Salk_135735 (SEND1-2) which was recently confirmed as a knockout line (Olivier et al., 2015), therefore it can be used in subsequent studies (Fig. 5). The allele Atgen1-1 is located in the 5ʹ′ UTR (Coordinates: 308791-309017) and Atgen1-2 in the sixth exon (Coordinates: 307301-307716)(Alonso et al., 2003) (Fig. 4). Atgen1-2 is part of the curated collection of confirmed homozygous T-DNA insertional mutants
Fig. 4 – Gene model of Arabidopsis AtGEN1. T-DNA insertion lines used marked by upward triangles. Light gray boxes mark the 5ʹ′ and 3ʹ′ UTRs, the dark gray boxes represent the exons, and the lines between them introns. The size of the gene is given in Kilobases in the bar above.
Fig. 5 - Gene model of Arabidopsis AtSEND1. T-DNA insertion lines identified marked by upward
triangles. Light gray boxes mark the 5ʹ′ and 3ʹ′ UTRs, the dark gray boxes represent the exons, and the lines between them introns. The size of the gene is given in Kilobases in the bar above.
PLANT GROWTH
4°C. Plants were grown using long-days (16hr+8hr) in a climate controlled room at 21°C under fluorescent lights.
DNA EXTRACTION
DNA was extracted using a protocol adapted from Mc.Kinney et al.1995 (McKinney et al., 1995). One to two basal leaves were excised from Arabidopsis rosettes and placed in 400 μls of Edward’s Buffer (50 mM Tris pH 8.0, 200 mM NaCl, 0.2 mM EDTA, 0.5% SDS, 100 mg/ml glycogen), and ground using a hand pestle until no large bits of leaf are seen. 200 μls of phenol:chloroform:isoamyl alcoholpcia (25:24:1 Saturated with 10 mM Tris, pH 8.0, 1 mM EDTA) (Fisher BioReagents #BP1752) was added and spun at 14,000 rpm for 20mins. The supernatant was extracted and transferred to a new 1.7ml Eppendorf tube containing 400 μls of molecular grade ethyl alcohol (SIGMA-ALDRICH #E7023). The solution containing the aqueous supernatant and alcohol was then
centrifuged at 14,000 rpm for 20 mins to pellet DNA. The supernatant was then discarded and 500 μls of 70% ethyl alcohol was added to rinse the DNA pellet. The tube was then spun at 14,000 rpm for 10 mins. This process was done twice. After the second wash, the alcohol was discarded. Excess alcohol was removed by pipetting and pellets were left to air dry. Once the pellet dried, 50 μls of
GENOTYPING AND SEQUENCING
Primers:
Primers were ordered from Integrated DNA Technologies
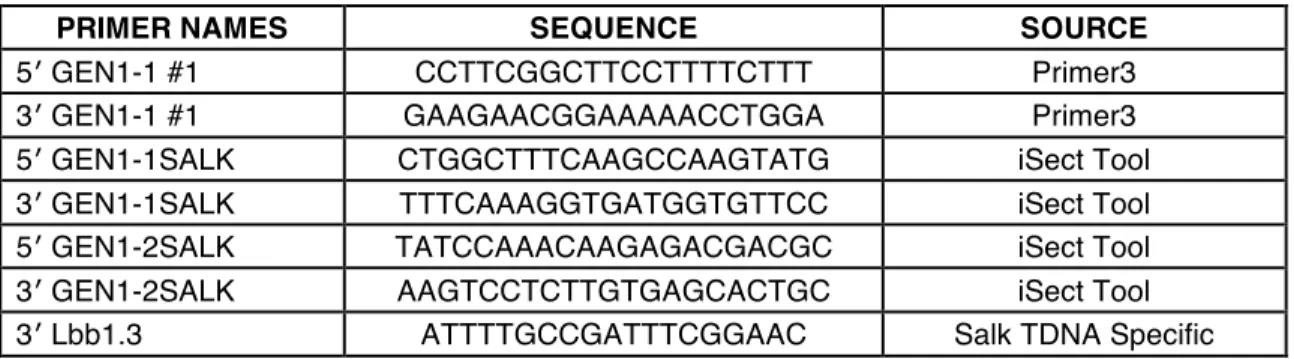
(https://www.idtdna.com/site). Two different sets of primers were used to identify the AtGEN1-1 allele; the first set was created from the full genomic sequence using Primer3 Input software (http://bioinfo.ut.ee/primer3-0.4.0/) and the second using the iSect Tool by the Salk Institute. The iSect tool has the primers that were used to identify and confirmed the T-DNA lines (Table 2), and was also used to obtain primers for the AtGEN1-2 line.
PRIMER NAMES SEQUENCE SOURCE
5′ GEN1-1 #1 CCTTCGGCTTCCTTTTCTTT Primer3 3′ GEN1-1 #1 GAAGAACGGAAAAACCTGGA Primer3 5′ GEN1-1SALK CTGGCTTTCAAGCCAAGTATG iSect Tool 3′ GEN1-1SALK TTTCAAAGGTGATGGTGTTCC iSect Tool 5′ GEN1-2SALK TATCCAAACAAGAGACGACGC iSect Tool 3′ GEN1-2SALK AAGTCCTCTTGTGAGCACTGC iSect Tool 3′ Lbb1.3 ATTTTGCCGATTTCGGAAC Salk TDNA Specific
Table 2. Primers for identify TDNA insertions in AtGEN1-1 and AtGEN1-2
PCR Reactions:
denaturing for 30 secs, 56°C annealing for 1.5 mins and, 72°C extension for 1.5 mins. A final extension at 72°C for 10 mins was perform to finalize PCR
reactions. Genotypes were identified using WT primers that flank the site of the T-DNA insertion. If the insertion is present, it prevents amplification across it and no product will be produced. Conversely, if plants do not contain the T-DNA insertion, the insertion-specific 3′ Lbb1.3 T-DNA primer won’t be able to anneal and no product will be produced when using the WT forward primer and 3′ Lbb1.3. These reactions were done more than once to confirm the results obtained. Plants which only showed a band under the WT primers were labeled as WT, plants that showed bands under the WT and T-DNA insertion primers were labeled heterozygous, while plants that did not show any amplification using the WT primers and only when the T-DNA primers were used were labeled as MT (mutant)
Gel Electrophoresis and Gel Extractions:
Sequencing:
Samples were submitted to UNC-CH Genome Analysis Facility and the data was analyzed using the 4Peaks application (Nucleobytes B.V.).
Crosses:
The F1 generation was generated by crossing plants that contained the T-DNA the insertion at the AtGEN1-1 and AtGEN1-2 alleles respectively, and homozygous FTL plants for the I3a interval (which are all also homozygous for the qrt1-2 mutation). The F1 crosses yielded a population of plants which were heterozygous for TDNA insertions at AtGEN1-1 and AtGEN1-2 and hemizygous for the I3a interval (dsRed+/- and CFP+/-) and heterozygote for qrt1-2. This
population was allowed set self-pollinated F2 seed. The F2 generation is therefore segregating at all three loci, and only plants that are I3a+/- and qrt1-2
-/-can be used for tetrad analysis. To prevent data collection bias, AtGEN1
genotypes were kept blind during pollen tetrad scoring. This means that a large plants number of plants need to be screened in order to find the right combination of phenotypes prior to tetrad counting. The F2 generation was used to generate Set #1 for the AtGEN1-1 allele. Because of the low proportion of plants that can be counted from the F2 generation, an F3 population was created which was segregating for the AtGEN1-1 and AtGEN1-2 loci, hemizygous for I3a and
for the AtGEN1-1 allele. The F3 generation was also used to create the plants used in tetrad analysis for the AtGEN1-2 locus.
POLLEN TETRAD COUNTING
Microscopy:
Segregation patterns for pollen tetrads (Fig. 3c) were analyzed using an epi-fluorescence Nikon Eclipse 1000 microscope (Melville, NY, USA) equipped with filters from Chroma Technology (Rochester, NY, USA).
Methodology:
In the F2 and F3 generations, plants which were hemizygous for I3a interval and homozygote mutant for qrt1-2-/- were selected for tetrad analysis. Small drops of PGM media (34 % sucrose, 4mM CaCl2, 3.25 mM boric acid, 0.1% Triton-X pH7.5) were added to a slide and one flower was dipped into the drop, with its anthers pointing down, to collect pollen in the PGM solution. The DsRED and CFP filters, or a multi-color filter, were used to find plants that produced tetrads (qrt1-2) with a 2:2 segregation pattern (Fig. 3c). Pollen tetrads were divided into three categories: PD, NPD, and TT (Fig. 3c), and data
RESULTS:
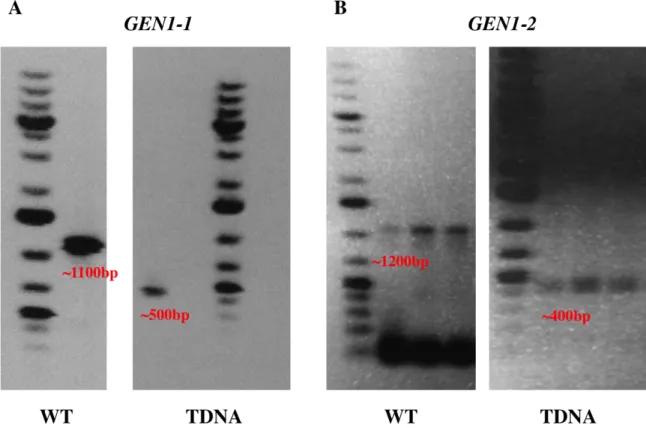
Genotyping results for the AtGEN1-1 and AtGEN1-2 alleles are shown in Fig. 6. Wild type primers were designed to flank the insertion site, this way if the insertion is present, these primers won’t amplify under standard PCR conditions. Confirmation of the presence of the insertion was also checked by using a primer that starts from within the T-DNA insertion in combination with one of the wild type primers (Table 2). Combining results obtained from these two sets of reactions we are able to determine whether a plant is wild type, heterozygote or homozygote mutant for the desired T-DNA insertions. For AtGEN1-1 at first the 5′ GEN1-1#1 and 3′ GEN1-1#1 primers were used, producing PCR products of the expected size for both the wild type sequence and T-DNA insertion site using the 5′ GEN-1#1 and 3′ Lbb1.3 combination (Table 2.) (Fig. 6) (Appendix I). Confirmation of the T-DNA insertion in this region was made by sequencing a purified PCR product from an agarose gel (Appendix I). The 5′ GEN1-1SALK and 3′ GEN1-1SALK confirmed Salk T-DNA primers were later ordered to improve upon the PCR reaction; they were verified by amplifying controls previously used and produced more robust bands, thus were used for subsequent PCR reactions (Fig. 6). The insertion was found to be 39bp upstream of the ATG start site in the 5′ UTR (Appendix).
on the site of the insertion, and yet sequencing revealed a number of anomalies. The combination of the wild type primers 5′ GEN1-2SALK and 3′ GEN1-1SALK produced the right product (Appendix I). Analysis of the 400-500bp fragment produced from the T-DNA reaction (Fig. 6), revealed overlapping sequences using both sets of primers (Appendix I). As is the case with many T-DNA
insertion lines, it’s possible that duplication(s) of the LB site has occurred leading to multiple priming sites within the insertion leading to multiple similarly sized fragments being amplified. Also, in the Frequently Asked Questions page for the Salk Institute T-DNA lines (http://signal.salk.edu/tdna_FAQs.html), other
researchers have observed the LBb1 primer alone can produce a band of ~450bp even in WT DNA under certain conditions (Question 25) and it was explained that sometimes it can appear as an artifact of this particular primer. Therefore it may be this artificial band that is creating the seemingly overlapping sequences. Because of the size of the wild type band (~1200bp) false positives can be avoided.
sequence prediction lead to no BLAST result hits (Appendix I). Also, in a previous sequencing attempt no prediction could be made from the resulting predicted sequences also because of the existence of too many overlapping sequences. The sequencing results are particularly perplexing due to the fact that these primers were obtained from the source that confirmed the location of the insertion as being homozygote (http://signal.salk.edu/tdna_FAQs.html), and when using both forward and reverse wild type primers the correct sequence is produced. Combining these data it seems possible that multiple LB sites in the insertion exist, which are producing confounding multiple sequences. Due to this ambiguity, the data produced using the AtGEN1-2 x I3a allele needs further verification through methods discussed later.
Two datasets were analyzed for the AtGEN1-1 x I3a and one for AtGEN1-2 x I3a as described in the methods. Linkage analysis was performed using the Stahl Lab Online Tools application “Map Distance, Interference, and Statistical Significance Based on Tetrad Data - The Traditional Method” program
Fig. 6 – Gel Electrophoresis (1.2% Agarose, TE Buffer) of PCR products. A. The expected WT band is ~1100 bp, while the band from the T-DNA insertion is ~500 bp. Presence of both
indicates a heterozygote plant. Control reactions using WT and MT DNA do not amplify using the MT and WT primers respectively. B. The expected WT band is ~1200 bp, while the band from the T-DNA insertion is ~400bp. Presence of both indicates a heterozygote plant. Control reactions using WT and MT DNA do not amplify when using the MT and WT primers respectively.
CO Analysis of AtGEN1-1 and AtGEN1-2
Gen1-1 x I3a (Set#1)
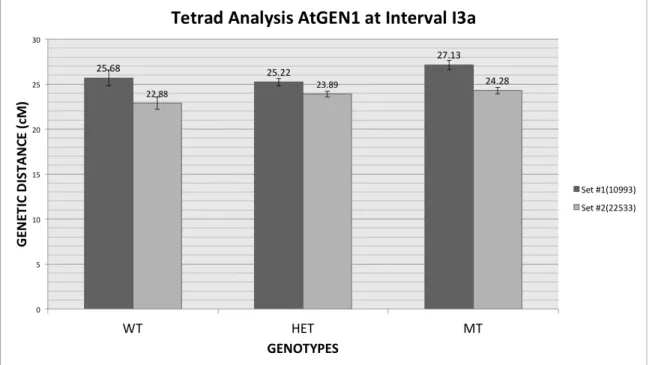
PD NPD TT TOTAL cM S.E.
WT 638 6 606 1250 25.68 0.8875
HET 3044 32 2744 5820 25.22 0.4222
MT 1919 25 1979 3923 27.13 0.5291
Total= 10993
Gen1-1 x I3a (Set#2)
PD NPD TT TOTAL cM S.E.
WT 1073 7 834 1914 22.88 0.6837
HET 6456 87 4986 11529 23.89 0.3212
MT 5010 67 4013 9090 24.28 0.3599
Total= 22533
Table 4. Tetrad counting data and Analysis for Set#2. PD (Parental Ditype), NPD (Non-Parental Ditype), TT (Tetratype), cM (Centimorgans = genetic distance), S.E. (Standard Error), WT (Wild Type - Gen1-1+/+; I3a+/-), HET (Heterozygote - Gen1-1+/-; I3a+/-),), MT (Mutant – gen1-1+/+; I3a+/-)
Fig. 7. Genetic distances between siblings segregating for the gen1-1-/-mutation. Standard Error
bar details in Tables 2 and 3.
the difference might be real, while the method 2 is by looking at the absolute value of the differences between the two map distances, if the difference is more than twice the standard error, it is thought to be significant
(http://molbio.uoregon.edu/~fstahl/EquationsMapDistance.html). For both datasets method 1 lead to a “maybe significant” outcome, meaning that taking into account the standard error of each, the genetic distances did not overlap. Method 2 on the other hand showed that this difference is less than twice the standard error; therefore the net difference between the genetic distances of wild type and mutant genotypes is not-significant.
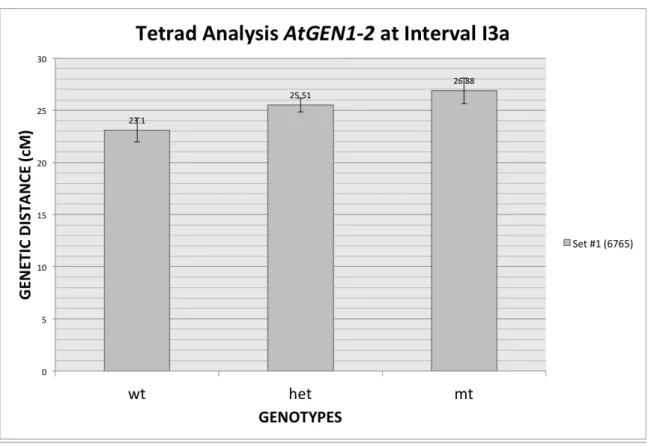
Gen1-2 x I3a
PD NPD TT TOTAL cM S.E.
WT 397 3 310 710 23.1 1.1496
HET 1574 27 1337 2938 25.51 0.6688
MT 392 6 385 783 26.88 1.236
Total= 4431
Fig. 8. Genetic distances between siblings segregating for the Atgen1-2-/-mutation. Standard Error bar details in Table 4.
In the dataset analyzed for the putative T-DNA insertion allele AtGEN1-2 x I3a a statistically significant increase in genetic distances was seen between wild type and mutant genotypes (23.1cM vs. 26.88cM) (Table 5, Fig. 8). By the same methodology presented for AtGEN1-1 x I3a, method 1 showed that the
DISCUSSION:
Given the nature of the two Salk T-DNA lines used in this study, the results obtained should be seen as preliminary evidence of AtGEN1’s possible involvement in Arabidopsis HR. Further confirmation of the Salk T-DNA insertion lines, and larger datasets counted tetrads are necessary to validate these results. Siblings segregating for the AtGEN1-1 T-DNA insertion and putative AtGEN1-2
T-DNA insertion showed no difference in external phenotypes, thus, vegetative development and fertility do not seem to be affected in plants which have
insertions in GEN1 (data not shown). Similar results were recently obtained from a WS ecotype mutant analysis of Atgen1-1 (Olivier et al., 2015). This phenotype is a strong indication that AtGEN1 is NOT the major endonuclease used during HR in Arabidopsis, as sterility is the result of COs not taking place.
The results obtained from analyzing FTL interval I3a point to AtGEN1
possibly having a function that limits CO production, and in its absence COs increase in frequency. In order to understand where these hypothetical “extra” COs are coming from, making double and triple mutants of AtGEN1, AtMUS81
increase in genetic distances between the wild type and mutant genotypes is not statistically significant in AtGEN1-1, and it is in AtGEN1-2. Interestingly, if these two lines are confirmed to be knockdowns or knockouts of AtGEN1, there may be a dosage-dependent phenotype in the increase of recombination frequency, as the heterozygotes for both alleles seem to have a genetic distance somewhere between the wild types and mutants.
Due to the issues encountered with the AtGEN1-2 allele, further confirmation of this T-DNA line is needed. This can be done by using
high-specificity Taq polymerase to create highly specific and stringent PCR conditions using both the 5′ GEN1-2SALK and 3′ GEN1-2SALK primers in combination with 3′ Lbb1.3. It is possible that the insertion was made in the opposite direction, thus using the 3′ GEN1-2SALK primer would allow us to check whether this is the case or not. The discovered phenotype can also be confirmed through complementation tests. Isolation of the wild type AtGEN1 transcript and transformation of T-DNA mutant plants using this vector can allow us to check whether CO levels decrease with the introduction of wild type, as it would be expected that it does indeed lead to NCO formation.
be confirmed at additional test loci to confirm that the results we observed are not locus-specific. Crosses have been made with an interval on chromosome 1 (I1a),) but they have yet to be counted. The single mutant for AtSEND1 is yet to be analyzed as well. Possible meiotic defects were found by Olivier et. al. in the double mutant of AtMUS81 and AtSEND1, which showed reduced pollen viability through Alexander staining, as well as the formation of abnormal tetrads (Olivier et al., 2015). Given the fact that AtGEN1 and AtSEND1 prefer different
sequences as demonstrated by Kobbe et. al., and overall divergence between the two genes, it would be interesting to see whether mutations in AtSEND1 have an HR phenotype. Although our preliminary data indicates that AtGEN1 may be involved in limiting COs, it does not mean that AtSEND1 acts in the same fashion. Future studies using single and double mutants for AtGEN1 and
APPENDIX I – SALK T-DNA line Genotyping
Genotyping AtGEN1-1 T-DNA Insertion
5′ GEN1-1 #1 + 3′ Lbb1.3
5′ GEN1-1 #1 (CCTTCGGCTTCCTTTTCTTT)
ATGCNTTTGCTGGTTAGGCTTTTCGGTTTGTGATCTTAATAACACATTGCGGACGTTT TTAATGTACTGGGGTGGTTTTTCTTTTCACCAGTGAGACGGGCAACAGCTGATTGCC CTTCACCGCCTGGCCCTGAGAGAGTTGCAGCAAGCGGTCCACGCTGGTTTGCCCC AGCAGGCGAAAATCCTGTTTGATGGTGGTTCCGAAATCGGCAAAATANNNNNNN
3′ Lbb1.3 (TTTCAAAGGTGATGGTGTTCC – REVERSE COMPLEMENT –
GGAACACCATCACCTTTGAAA) NCAANGNTTTTCGCCTGCTGGGGCAACCGCGTGGNACCGCTTGCTGCAACTCTCTC AGGGCCAGGCGGTGAAGGGCAATCAGCTGTTGCCCGTCTCACTGGTGAAAAGAAA AACCACCCCAGTACATTAAAAACGTCCGCAATGTGTTATTAAGATCACAAACCGAAA AGCCTAAACCAGCAAAAGGCGAATTAAAAGAAAAGGAAGCCGAAGGANNNNN (REVERSE-COMPLEMENT SEQUENCE) CCTTCGGCTTCCTTTTCTTTTAATTCGCCTTTTGCTGGTTTAGGCTTTTCGGTTTGTG ATCTTAATAACACATTGCGGACGTTTTTAATGTACTGGGGTGGTTTTTCTTTTCACCA GTGAGACGGGCAACAGCTGATTGCCCTTCACCGCCTGGCCCTGAGAGAGTTGCAG CAAGCGGTNCCACGCGGTTGCCCCAGCAGGCGAAA
3′ GEN1-1 #1 (GAAGAACGGAAAAACCTGGA - RC-
TCCAGGTTTTTCCGTTCTTC)
Salk Primers Info:
SALK_027797.28.55.x PRODUCT_SIZE = 1118
(5′ GEN1-1SALK) LP CTGGCTTTCAAGCCAAGTATG
(3′ GEN1-1SALK) RP TTTCAAAGGTGATGGTGTTCC - REVERSE
COMPLEMENT - GGAACACCATCACCTTTGAAA (http://signal.salk.edu/tdnaprimers.2.html)
BLUE – GENOMIC SEQUENCE
At1g01880 Genomic Sequence ctggctttcaagccaagtatgaacacgtaagccgacgacttacatttttttttttttttctttgatgtcctcactcctatgaaattcggagatattcat cgtatcttctcatttaattcaatacccttttaaaaaaggataactacagtctagaatggtttatcgtgtgtttcactattttacccgcaggcctcag cgagacaccaattaaggtccatacttgcacatttttggataatgcttttctggttttctactagacaattgaatagagtaatacttaaccaacaa agcccgtctagctcagttggtagagcgcaaggctcttaaccttgtggtcgtgggttcgagccccacggtgggcgatctgtataaatagttttt tattttattttttcttaatagacttaatgggctacagagatatcatccgggctaattgttgggcccataaccgtggcgggtgatgtgacgatgcc ataaatagataggcacaacacaagcgagtccaacaagactcgcataacggtcagaaattgattctatccttcggcttccttttcttttaattc gccttttgctggtttaggcttttcggtttgtgatctt^ccgctccgctccgctaggctattacggcattttgattgaATGGGTGTGGGAG GCAATTTCTGGGATTTGCTGAGACCATATGCTCAGCAACAAGGCTTTGATTTTCTCAGAAACA AACGAGTCGCTGTTGATCTCTCCTTCTGGATCGTTCAGCATGAAACCGCTGTTAAGGGTTTC GTCCTTAAACCTCACCTCCGACTCACTTTCTTCCGTACTATCAACCTCTTCTCAAAGgtcccatttttt ttttttttattgctgcgcgcttcttctctcttgttatgcttctactgaatttcccaatttcgtctcctttaatccttttttggcattggctaaaaaagttccttttt tctgtggattacgggtttttttgaattttttaggttttcgcttgattgaaaaatcttgatttttttctatggagatgattgtaatgcggtttagggttttgca gTTTGGAGCGTACCCGGTTTTTGTGGTTGATGGAACACCATCACCTTTGAAATCTCAGGCGAG AATCTCCAGGTTTTTCCGTTCTTCTGGAATTGATACTTGTAATCTACCTGTGATTAAAGATGGT GTCTCGGTTGAGAGAAACAAGCTGTTTTCTGAATGGGTTAGGGAATGTgtggtaagatggctttcccttc aaacctttatgcttgttttgtttcacattgttttcttatgacttt
Lower case – 5′ UTR and Introns UPPER CASE – EXONS
BLUE – Genomic sequence present in T-DNA PCR product
^ - location of T-DNA insertion
ATG – START SITE
Highlighted regions – Primers used
Genotyping AtGEN1-2 T-DNA Insertion
5′ GEN1-2SALK + 3′ Lbb1.3
5′ GEN1-2SALK
Attempts at sequencing the product(s) produced using the combination of 5′ GEN1-2 and Lbb1.3 lead to the recovery of overlapping sequences.
CTTGNTTNGCACNACTGGCCATNATGCGCCCAACCAAGCTTANNATCNTNTGCGGTGACNG TNACNTAAAATGNCCAAACTGAGCACAANCTTGACTGTANGGNACNCTTGGNTCNTTTTGG GACACTTGAATTGNGTNTCCTTTACCTCTTCTTTNGTTGTCTTTCAATNAAAACTTNTANTAC CATTTCAANAAAANGATCATCAANTTAACAAANCTGCCTGTAATATATATATATTTGGTCAA TTTAAATCTAATTGAGAATCTATGACATTTGTTTTTACTGTTAATATAAAGCTCTGTTTCGGN TTTCTGGNGACCAACNAACATAAAATGGTTTGNNATTNAATTACAAANNGGCCCNNGNNAN NNNNNNNGNNNNGCNCCGTCNNCNNNGNNTGNNNNNNNNNNNCNCNNNNNN
Histogram of Sequence
(Image produced using 4Peaks. Residues are labeled on the top bar (ATCG). Nucleotides that cannot be called due to overlapping signals are indicated by using the letter N written in white surrounded by a red box).
• Upon further inspection of the histogram above, many of the nucleotides that were assigned an identity had overlapping traces of other nucleotides. Depending on the stringency of designating nucleotide identities different predicted sequences can be generated.
BLAST Results
BLASTn
Using the predicted sequence produced by sequencing using the 5′ GEN1-2 primer, Blastn gave a possible “hit” on chromosome 4.
BLASTn. (Altschul, Stephen F., Thomas L. Madden, Alejandro A. Schäffer, Jinghui Zhang, Zheng Zhang, Webb Miller, and David J. Lipman (1997),"Gapped BLAST and PSI-BLAST: a new generation of protein database search programs", Nucleic Acids Res. 25:3389-3402.)
* The E value of the top hit is relatively low, but not as strong as the ones found in the wild type band (ex. e-114 vs 7e-18). This indicates a lower level of sequence similarity between our sequence and the predicted gene.
BLASTx
3′ Lbb1.3 PRIMER (T-DNA Primer)
NATNNCTNTTNTCTTATANGNNTCGNGGCCNCNAATANNAGCGNNCATTNNGCTTTNAANTT NNCACGATCCNCNNTGNCNNGGTGGATCNNNNGGNNTGCTNTNAAANGTNGCTNNANCNNC NGGNGCGCCGCTGCGTGGTGATTNNNNGANTN
* Nucleotides that cannot be called due to overlapping signals are indicated by using the letter N * Sequence in bold used for BLAST
Histogram of Sequence
(Image produced using 4Peaks. Residues are labeled on the top bar (ATCG). Nucleotides that cannot be called due to overlapping signals are indicated by using the letter N written in white surrounded by a red box).
BLAST Results
BLASTn
BLASTn. (Altschul, Stephen F., Thomas L. Madden, Alejandro A. Schäffer, Jinghui Zhang, Zheng Zhang, Webb Miller, and David J. Lipman (1997),"Gapped BLAST and PSI-BLAST: a new generation of protein database search programs", Nucleic Acids Res. 25:3389-3402.)
BLASTx
5′ GEN1-2SALK + 3′ GEN1-2SALK PRIMER:
5′ GEN1-2SALK PRIMER:
CGANATTTGTAGGTTACTACTACTAGTAGAAGTTGCCTGTCTCTTCTTTTCCGCAGAAGCTT TTGAACTCCCGCCTGTCTCTATACTTTGACCTGCTGCTGCTTTCTTCGCTGAACGGTAGAAA TCGGTAATGCTTCTTTGTACACCCATTGTTGTTGCTCTTGGTGTTGCTGTTTCTTCTTCAGAA ACATTCTTCTTTTTCGACTCTCTCAGTTTCTGAGAGTTTTAACAAACATAAACAGTCAAGGC TAANGGAAGAAAAGGCATCTCATAGAGATAGCGAGAGACTGAGAGATCCAATGTATTACC TTATCATGTANAAAAACGCNCNGTTTCATCAGGGAAAGCNNACATGAACAAGTCNNATGNN NTCATCANNTNAGCANGAAGCAGNCACNATNANNATTTGTGCACCTGANGNTCANTNAAAC AATCCAACGGATCNCCAGACTCNTATCTCTTNCNCCAATNCANNAGATNAACTCNNCNGACT AANTTGCGNACNANAANNTATNNACNAAGNTGNCNGACNNAGGAGTNATANACTCNAGTTGA ANANNN
* Nucleotides that cannot be called due to overlapping signals are indicated by using the letter N * Sequence in bold used for BLAST
Histogram of Sequence
(Image produced using 4Peaks. Residues are labeled on the top bar (ATCG). Nucleotides that cannot be called due to overlapping signals are indicated by using the letter N written in white surrounded by a red box).
BLAST Results
BLASTn
BLASTn. (Altschul, Stephen F., Thomas L. Madden, Alejandro A. Schäffer, Jinghui Zhang, Zheng Zhang, Webb Miller, and David J. Lipman (1997),"Gapped BLAST and PSI-BLAST: a new generation of protein database search programs", Nucleic Acids Res. 25:3389-3402.)
BLASTx
Because this insertion is in an exon, checking with BLASTx can verify that the sequence obtained does indeed pertain to a protein sequence motif as expected.
BLASTx. (Altschul, Stephen F., Thomas L. Madden, Alejandro A. Schäffer, Jinghui Zhang, Zheng Zhang, Webb Miller, and David J. Lipman (1997),"Gapped BLAST and PSI-BLAST: a new generation of protein database search programs", Nucleic Acids Res. 25:3389-3402.)
3′ GEN1-2SALK PRIMER:
NNGTTGGTAGTGGTTGCTTAAAAACCTTAGGGTTTAGCATGTGAATGCTCCTTTTGTTCCAG GNATCGAGATTTAAGGGAACAAAAGCAAAACCAATGATTGGTGGATCAAAGTCTGCGATA AGATTGCTCTAGCGCCAGAGTTTCCCAACAGAAAGATTATTGAACTTTATCTATCCGATGG TTTGATGACAGGTTTGCACTGACTTTATGACTTCGTGTCCGTATTGCATGATCATTGTTCTG AATCCTAATGTTTATGCACCTCTGAAGCAGGAGATGGATCGTCAATGTCTTGGGGAACTCC TGATACTGGAATGCTAGTGGATCTCATGGTTTTCAAACTGCACTGGGACCCATCTTATGTTA GAAAAATGTTGCTTCCGANGCTGTCGACCATTTATCTGANAGAAAAGGCAANAAACNACA CACGATACGCTTTGTNGTGTGATCAATACNAATTNCNTTCNATCANCGTGCATANCATCTAG ATNTGGGCANCANCCCTTNGTAATAAGGTGGANAAAACCCANATCNNCGAGTGNTTATAGT CATANNCACANCGNGCCNNAATNANCCANTTNTCGTCTTGAAAGAACANNANATCCTNGCT GNGACNGGCCGTGGGGNTCANNTNNACCNNTGTGTTGAAATTNCTTTGTTTNACCNGNTTCC NTNCTTTCCNCCCCCGCNTNGGNTTCTNCTCNTCCCNTTCCTNNCTCAATCTAAATTTCNNNC AGTTTTCCTNTNGGCTNGNNCNACCCCCCCGCCATCCCCTNNNGNNNCNNCTNTTCCNNNTC NNANTTTTTCCTNCCNAN
* Nucleotides that cannot be called due to overlapping signals are indicated by using the letter N * Sequence in bold used for BLAST
Histogram of Sequence
BLAST Results
BLASTn
BLASTn. (Altschul, Stephen F., Thomas L. Madden, Alejandro A. Schäffer, Jinghui Zhang, Zheng Zhang, Webb Miller, and David J. Lipman (1997),"Gapped BLAST and PSI-BLAST: a new generation of protein database search programs", Nucleic Acids Res. 25:3389-3402.)
• The low E values indicate a high level of sequence similarity.
BLASTx
BLASTx. (Altschul, Stephen F., Thomas L. Madden, Alejandro A. Schäffer, Jinghui Zhang, Zheng Zhang, Webb Miller, and David J. Lipman (1997),"Gapped BLAST and PSI-BLAST: a new generation of protein database search programs", Nucleic Acids Res. 25:3389-3402.)
SEQUENCE ANALYSIS
3′ GEN1-2SALK PRIMER:
5′ GEN1-2SALK PRIMER: CGANATTTGTAGGTTACTACTACTAGTAGAAGTTGCCTGTCTCTTCTTTTCCGCAGAAGCTT TTGAACTCCCGCCTGTCTCTATACTTTGACCTGCTGCTGCTTTCTTCGCTGAACGGTAGAAA TCGGTAATGCTTCTTTGTACACCCATTGTTGTTGCTCTTGGTGTTGCTGTTTCTTCTTCAGAA ACATTCTTCTTTTTCGACTCTCTCAGTTTCTGAGAGTTTTAACAAACATAAACAGTCAAGGC TAANGGAAGAAAAGGCATCTCATAGAGATAGCGAGAGACTGAGAGATCCAATGTATTACC TTATCATGTANAAAAACGCNCNGTTTCATCAGGGAAAGCNNACATGAACAAGTCNNATGNN NTCATCANNTNAGCANGAAGCAGNCACNATNANNATTTGTGCACCTGANGNTCANTNAAAC AATCCAACGGATCNCCAGACTCNTATCTCTTNCNCCAATNCANNAGATNAACTCNNCNGACT AANTTGCGNACNANAANNTATNNACNAAGNTGNCNGACNNAGGAGTNATANACTCNAGTTGA ANANNN
(REVERSE COMPLEMENT SEQUENCE)
NNNTNTTCAACTNGAGTNTATNACTCCTNNGTCNGNCANCTTNGTNNATANNTTNTNGTNCG CAANTTAGTCNGNNGAGTTNATCTNNTGNATTGGNGNAAGAGATANGAGTCTGGNGATCCGT TGGATTGTTTNANTGANCNTCAGGTGCACAAATNNTNATNGTGNCTGCTTCNTGCTNANNTG ATGANNNCATNNGACTTGTTCATGTNNGCTTTCCCTGATGAAACNGNGCGTTTTTNTACATGA TAAGGTAATACATTGGATCTCTCAGTCTCTCGCTATCTCTATGAGATGCCTTTTCTTCCNTTAG CCTTGACTGTTTATGTTTGTTAAAACTCTCAGAAACTGAGAGAGTCGAAAAAGAAGAATGTTT CTGAAGAAGAAACAGCAACACCAAGAGCAACAACAATGGGTGTACAAAGAAGCATTACCGAT TTCTACCGTTCAGCGAAGAAAGCAGCAGCAGGTCAAAGTATAGAGACAGGCGGGAGTTCAA AAGCTTCTGCGGAAAAGAAGAGACAGGCAACTTCTACTAGTAGTAGTAACCTACAAATNTCG
tctgaagcagGAGATGGATCGTCAATGTCTTGGGGAACTCCTGATACTGGAATGCTAGTGGATCT CATGGTTTTCAAACTGCACTGGGACCCATCTTATGTTAGAAAAATGTTGCTTCCGATGCTGTC
GACCATTTATCTGAGAGAAAAGGCAAGAAACAACACAGGATACGCTTTGTTGTGTGATCAATA
CGAATTTCATTCAATCAAGTGCATAAAAACTAGATATGGGCATCAGTCCTTTGTAATAAGGTG GAGAAAACCCAAATCTACAAGTGGTTATAGTCATAGTCACAGCGAGCCAGAAGAATCAATTG TTGTATTGGAAGAAGAAGAAGAGTCTGTTGATCCGTTGGATGGTTTAAATGAACCTCAGGTG CAAAATGATAATGGTGACTGCTTCTTGCTAACTGATGAATGCATAGGACTTGTTCAGTCTGCT TTCCCTGATGAAACAGAGCATTTTCTACATGAGAAGgtaatacattggatctctcagtctctcgctatctctatgaga tgccttttcttcccttagccttgactgtttatgtttgttaaaactctcagAAACTGAGAGAGTCGAAAAAGAAGAATGTTTC TGAAGAAGAAACAGCAACACCAAGAGCAACAACAATGGGTGTACAAAGAAGCATTACCGATT TCTACCGTTCAGCGAAGAAAGCAGCAGCAGGTCAAAGTATAGAGACAGGCGGGAGTTCAAA AGCTTCTGCGGAAAAGAAGAGACAGGCAACTTCTACTAGTAGTAGTAACCTTACAAAGTCGG TCAGGCGTCGTCTCTTGTTTGGATAGaacaatcattcttgagtaaatcataccaattttttggtctgtatataaaa
lower case – UTRs and introns UPPER CASE - EXONS
Alternating yellow and green selections - EXONS 3′ GEN1-2SALK primer sequencing
REFERENCES
Allers T, Lichten M. Differential timing and control of noncrossover and crossover recombination during meiosis. Cell [Internet]. 2001 Jul 13;106(1):47–57. Alonso JM, Stepanova AN, Leisse TJ, Kim CJ, Chen H, Shinn P, et al.
Genome-wide insertional mutagenesis of Arabidopsis thaliana. Science. 2003 Aug;301(5633):653–7.
Bauknecht M, Kobbe D. AtGEN1 and AtSEND1, two paralogs in Arabidopsis thaliana, possess Holliday junction resolvase activity. PLANT PHYSIOLOGY. 2014 Jul 18. PMCID: PMC4149707
Bellendir SP, Sekelsky JJ. An elegans Solution for Crossover Formation. Bellendir SP, Sekelsky JJ, editors. PLoS Genet. 2013 Jul 18;9(7):e1003658. PMCID: PMC3715449
Berchowitz L, Copenhaver G. Genetic Interference: Dont Stand So Close to Me. CG. 2010 Apr 1;11(2):91–102.
Berchowitz LE, Copenhaver GP. Fluorescent Arabidopsis tetrads: a visual assay for quickly developing large crossover and crossover interference data sets. Nat Protoc. 2008 Jan;3(1):41–50.
Berchowitz LEL, Copenhaver GPG. Visual markers for detecting gene conversion directly in the gametes of Arabidopsis thaliana. Methods Mol Biol. 2009 Jan 1;557:99–114.
Berchowitz LEL, Francis KEK, Bey ALA, Copenhaver GPG. The Role of
AtMUS81 in Interference-Insensitive Crossovers in Arabidopsis thailana. PLoS Genet [Internet]. 2007 Aug 1. PMCID: PMC1941751
Burgeff H. Variabilität, Vererbung und Mutation beiPhycomyces Blakesleeanus Bgff. Z.Ver-erbungslehre. Springer-Verlag; 1929;49(1):26–94.
Copenhaver GP, Housworth EA, Stahl FW. Crossover Interference in Arabidopsis. Genetics. 2002.
Copenhaver GP, Keith KC, Preuss D. Tetrad analysis in higher plants. A budding technology. PLANT PHYSIOLOGY. 2000 Sep;124(1):7–16. PMCID:
PMC1539273
Crismani W, Girard C, Froger N, Pradillo M, Santos JL, Chelysheva L, et al.
Pollen tetrad-based visual assay for meiotic recombination in Arabidopsis. Proceedings of the National Academy of Sciences. 2007 Mar 6;104(10):3913– 8. PMCID: PMC1805420
Furukawa T, Kimura S, Ishibashi T, Mori Y, Hashimoto J, Sakaguchi K. OsSEND-1: a new RAD2 nuclease family member in higher plants. Plant Mol Biol. 2003;51(1):59–70.
Grelon MM, Vezon DD, Gendrot GG, Pelletier GG. AtSPO11-1 is necessary for efficient meiotic recombination in plants. EMBO J. 2001 Feb 1;20(3):589–600. Higgins JD. The Arabidopsis MutS homolog AtMSH4 functions at an early step in
recombination: evidence for two classes of recombination in Arabidopsis. Genes & Development. 2004 Oct 1;18(20):2557–70. PMCID: PMC529542 Ip SCY, Rass U, Blanco MG, Flynn HR, Skehel JM, West SC. Identification of
Holliday junction resolvases from humans and yeast. Nature. 2008 Nov 20;456(7220):357–61.
Jones GH, Franklin FCH. Meiotic crossing-over: obligation and interference. Cell. 2006 Jul 28;126(2):246–8.
Keeney SS, Giroux CNC, Kleckner NN. Meiosis-Specific DNA Double-Strand Breaks Are Catalyzed by Spo11, a Member of a Widely Conserved Protein Family. Cell. 1997 Feb 7;88(3):10–0.
Klar AJ, Miglio LM. Initiation of meiotic recombination by double-strand DNA breaks in S. pombe. Cell. 1986 Aug 29;46(5):725–31.
Knoll A, Schröpfer S, Puchta H. The RTR complex as caretaker of genome stability and its unique meiotic function in plants. Front Plant Sci. 2014;5:33. PMCID: PMC3921566
Lam I, Keeney S. Mechanism and regulation of meiotic recombination initiation. Cold Spring Harbor Perspectives in Biology. 2015 Jan;7(1):a016634.
Liberi G, Foiani M. The double life of Holliday junctions. Cell Research. 2010 Jun 1;20(6):611–3.
Lorenz A, West SC, Whitby MC. The human Holliday junction resolvase GEN1 rescues the meiotic phenotype of a Schizosaccharomyces pombe mus81 mutant. Nucleic Acids Research. 2010 Mar 30;38(6):1866–73. PMCID: PMC2847240
analysis. Journ. of Genetics. Springer India; 1942;43(1-2):1–30.
Matos J, Blanco MG, Maslen S, Skehel JM, West SC. ScienceDirect.com - Cell - Regulatory Control of the Resolution of DNA Recombination Intermediates during Meiosis and Mitosis. Cell [Internet]. Elsevier Inc; 2011 Sep
30;147(1):158–72. PMCID: PMC3560330
Matos J, West SC. Holliday junction resolution: regulation in space and time. DNA Repair. 2014 Jul 1;19:176–81. PMCID: PMC4065333
McKinney EC, Ali N, Traut A, Feldmann KA, Belostotsky DA, McDowell JM, et al. Sequence-based identification of T-DNA insertion mutations in Arabidopsis: actin mutants act2-1 and act4-1. Plant J. 1995 Oct;8(4):613–22.
McMahill MS, Sham CW, Bishop DK. Synthesis-dependent strand annealing in meiosis. Plos Biol. 2007 Nov 6;5(11):e299–9. PMCID: PMC2062477
Moritoh S, Miki D, Akiyama M, Kawahara M, Izawa T, Maki H, et al. RNAi-mediated silencing of OsGEN-L (OsGEN-like), a new member of the RAD2/XPG nuclease family, causes male sterility by defect of microspore development in rice. Plant and Cell Physiology. 2005 May;46(5):699–715. Olivier M, Da Ines O, Amiard S, Serra H, Goubely C, White CI, et al. MUS81 and
SEND1 are essential for telomere stability in Arabidopsis. The Plant …. 2015. Osman K, Higgins JD, Sánchez-Morán E, Armstrong SJ, Franklin FCH.
Pathways to meiotic recombination in Arabidopsis thaliana. New Phytologist [Internet]. 2011 Mar 2;190(3):523–44.
Page SLS, Hawley RSR. Chromosome choreography: the meiotic ballet. Science. 2003 Aug 8;301(5634):785–9.
Paigen K, Petkov P. Meiotic DSBs and the control of mammalian recombination. Cell Research. Nature Publishing Group; 2012 Jul 17;22(12):1624–6.
Papazian HP. The Analysis of Tetrad Data. Genetics. 1952 Mar;37(2):175–88. PMCID: PMC1209549
Perkins DD. Biochemical Mutants in the Smut Fungus Ustilago Maydis. Genetics. 1949 Sep;34(5):607–26. PMCID: PMC1209467
Preuss D, Rhee SY, Davis RW. Tetrad analysis possible in Arabidopsis with mutation of the QUARTET (QRT) genes. Science. 1994 Jun
3;264(5164):1458–60.
modeling. PLoS ONE. 2013;8(11):e78753. PMCID: PMC3828297 Schwacha A, Kleckner N. Identification of Double Holliday Junctions as
Intermediates in Meiotic Recombination. Cell. 1995;83(5):783–91.
Schwartz EKE, Heyer W-DW. Processing of joint molecule intermediates by structure-selective endonucleases during homologous recombination in eukaryotes. Chromosoma. 2011 Apr 1;120(2):109–27.
Stahl F. Meiotic Recombination in Minireview Yeast: Coronation of theDouble-Strand-Break Repair Model. Cell. 1996 Dec 13;87(6):965–8.
Sturtevant AH. The behavior of the chromosomes as studied through linkage. Molecular and General Genetics MGG. Berlin, Gerb. Bortraeger; 1915. Sun Y, Ambrose JH, Haughey BS, Webster TD, Pierrie SN, Muñoz DF, et al.
Deep Genome-Wide Measurement of Meiotic Gene Conversion Using Tetrad Analysis in Arabidopsis thaliana. Ma H, editor. PLoS Genet. 2012 Oct
4;8(10):e1002968.
Szostak JW, Orr-Weaver TL, Rothstein RJ, Stahl FW. The double-strand-break repair model for recombination. Cell. 1983 May;33(1):25–35.
Tercero JA, Boulton SJ. The choice in meiosis - defining the factors that influence crossover or non-crossover formation. Journal of Cell Science. 2011 Jan 31;124(4):501–13.
Torgovnick A, Schumacher B. DNA repair mechanisms in cancer development and therapy. Front. Genet. 2015 Apr 23;6.
West SC, Blanco MG, Chan YW, Matos J, Sarbajna S, Wyatt HDM. Resolution of Recombination Intermediates: Mechanisms and Regulation. Cold Spring Harb. Symp. Quant. Biol. 2015 Sep 14.
Wyatt HDM, Sarbajna S, Matos J, West SC. Coordinated Actions of SLX1-SLX4 and MUS81-EME1 for Holliday Junction Resolution in Human Cells. Molecular Cell [Internet]. Elsevier Inc; 2013 Oct 24;52(2):234–47.
Wyatt HDM, West SC. Holliday Junction Resolvases. Cold Spring Harbor Perspectives in Biology. 2014 Sep 2;6(9):a023192–2.
Zakharyevich K, Tang S, Ma Y, Hunter N. Delineation of Joint Molecule