DETERMINANTS AND EFFECTS OF PLAN SELECTION IN THE NON-GROUP HEALTH INSURANCE MARKET
Emily Meredith Gillen
A dissertation submitted to the faculty at the University of North Carolina at Chapel Hill in partial fulfillment of the requirements for the degree of Doctor of Philosophy in the Department of Health Policy and
Management in the Gillings School of Global Public Health.
Chapel Hill 2015
Approved by:
iii ABSTRACT
Emily Meredith Gillen: Determinants and Effects of Plan Selection in the Non-Group Health Insurance Market
(Under the direction of Kristen Hassmiller Lich)
Effective 2014, the Patient Protection and Affordable Care Act (ACA) required US citizens to be enrolled in an adequate health insurance plan. To provide a platform where individuals could compare and purchase health plans deemed to provide sufficient levels of coverage, the ACA required states to establish (or allow the federal government to establish) health insurance Marketplaces. Plans qualified to be sold on the exchange had to adhere to ACA regulations, for example replacing medical underwriting with community modified premiums. In addition, federal assistance was available on a needs basis. As a result of ACA devised changes, the non-group health insurance market increased 211% from 2013 to 2015 (Carman, Eibner, & Paddock, 2015a).
The objectives of this research were to understand: (1) how consumers behaved in year one of the new health insurance Marketplaces; and (2) how they responded to plan benefits in the non-group health insurance market. This study utilized claims data from a large insurer with over 85% market share in the state non-group health insurance market (The Kaiser Family Foundation State Health Facts, 2013). I found individuals with advanced premium tax credits who were less healthy were more likely to use their credits to purchase more generous health plans. Individuals were more likely to access additional outpatient services after they reached their out-of-pocket maximum and self-selection into a narrow network plan had no impact on number of outpatient visits but did increase the percentage of visits with participating providers. Narrow network plans were associated with a reduction in out-of-pocket costs.
iv
v
ACKNOWLEDGEMENTS
None of this work would have been possible without the help and support of my family, friends, dissertation committee, coworkers, and the UNC faculty and students. I feel very lucky to have had such a strong support system over the past few years and I thank you all.
First I would like to thank my committee, without whom none of this work would have been possible. My chair, Kristen Hassmiller Lich, and I have worked together closely over my four years at UNC and, even though my research focus has changed many times, Kristen’s involvement in my projects never has. Kristen’s unique perspective and skill set has allowed me to explore new and different research agendas and provided me exposure to new methods. Early in my course work at UNC Kristen facilitated a project for me, the results of which she encouraged me to publish. Without Kristen I never would have had the opportunity to publish my first paper and gain the accompanying experience in writing, submitting, and fielding questions on a research paper. Kristen is always the first to congratulate me for accomplishments and we have learned to work well over the past few years. It is hard to believe four years have passed so quickly, thank you for all your support.
vi
I honestly could not have done this dissertation without Laurel Trantham. Laurel’s knowledge of the dataset and her modeling skills came in handy every day. In addition to her professional expertise, Laurel helped me with the day-to-day of this dissertation, guiding me through meetings with legal teams and providing me practical advice on writing these three papers. She was always responsive to my questions and willing to meet frequently. She is a great friend and mentor and I wish her all the best as she takes on a new role as a mother. In additional to Laurel, I have to thank my other co-workers. It has been a
pleasure to work with such a smart, quick-witted, and fun team. I appreciated all of your help with work, your support with my research, and your friendship. I also have to thank Beth Herstine who helped me immensely with my coding skills; you are one of the best (and most patient) managers I’ve ever had.
I would also like to thank my UNC cohort (and especially my M’s- Megan, Sarah, and Lisa), we’ve all been through a lot together and I know that I have made some relationships that will last a lifetime. Going through this whole process with you all has made it much easier. I also want to thank all the new friends I have made in North Carolina, I feel really lucky to have met such a nice group of people down here. Equally important are all my old friends who live across the country. My one of my oldest friends, Jaclyn; my Wash U friends, Jess, Jess, Sara, and Varun; Ben, who stuck with me through two years of course work; and all my DC friends including Victoria, Hayden, Alex, Maya, Alex, Erin, and Rachel. I feel truly lucky to have such a caring, fun-loving, and accomplished group of friends, thank you all. And a special thank you to Leon, who I met towards the end of this process but who has been (and continues to be) immensely supportive; I love you.
vii
TABLE OF CONTENTS
List of Tables ... xii
List of Figures ... xiii
List of Abbreviations ... xiv
CHAPTER 1: DETERMINANTS AND EFFECTS OF PLAN SELECTION: OVERVIEW ... 1
Specific Aims ... 1
Organization of this Dissertation ... 3
CHAPTER 2: BACKGROUND ON THE AFFORDABLE CARE ACT AND HEALTH INSURANCE LITERATURE REVIEW ... 4
Background ... 4
Health Insurance 101 ... 4
The Affordable Care Act and Market Expansion... 5
Metal Level Designations ... 6
Federal Assistance Programs ... 7
Out-of-Pocket Maximums ... 9
Modified Community Ratings ... 9
Essential Health Benefits ... 10
Grandfathered and Transitional Plans ... 10
Literature Review ... 11
Plan Switching vs. Re-enrollment ... 11
viii
Cost-Sharing and Utilization ... 15
CHAPTER 3: PLAN SELECTION IN THE NON-GROUP MARKET IN THE FIRST YEAR OF THE HEALTH INSURANCE MARKETPLACE ... 18
Introduction... 18
Background - Changes in the Non-Group Market Under the Affordable Care Act ... 18
Metal Level and Actuarial Value ... 18
Modified Community Rating ... 19
Federal Assistance Programs ... 19
Regulations on QHP Generosity and Plan Benefits ... 19
Grandfathered / Transitional Plans ... 20
Status Quo Bias and Active Plan Selection ... 20
Data and Methods ... 21
Data and Sample ... 21
Outcome Variable ... 22
Key Independent Variables ... 22
Analysis ... 22
Results ... 23
Switching ... 23
Decision-Making among Beneficiaries who Switched Plans: Choice of Metal Level ... 24
Discussion ... 25
Effect of APTCs on Metal Level ... 26
Age and Metal Level ... 26
Limitations ... 27
ix
Tables and Figures ... 29
CHAPTER 4: INTRA-YEAR VARIATION IN THE MARGINAL COST OF CARE AND ITS EFFECT ON UTILIZATION ... 33
Introduction... 33
Data and Methods ... 34
Data and Sample ... 34
Measures... 34
Outcome Variables ... 34
Key Independent Variables ... 35
Analysis ... 36
The Model ... 36
Subgroup analysis ... 37
Results ... 38
Outpatient Visits ... 38
Emergency Room Visits ... 38
Inpatient Visits ... 39
Discussion and Policy Implications ... 39
High Deductible Health Plans ... 39
The Role of Outpatient Care ... 40
Limitations ... 40
Conclusions ... 41
Tables ... 42
x
Introduction... 47
Background ... 48
Methods... 50
Data ... 50
Sample ... 50
Outcome Variables ... 50
Statistical Approach ... 51
Results ... 53
Unadjusted Results ... 53
Difference-in-Difference Results ... 54
Discussion ... 55
Limitations ... 57
Conclusions ... 58
Tables ... 59
CHAPTER 6. DISCUSSION ... 62
Conclusions ... 62
Summary of Findings ... 63
Plan Selection: The Influence of Health Status ... 63
Plan Selection: The Influence of Premiums ... 64
Healthcare Utilization: The Influence of Cost-Sharing and Provider Networks ... 64
Healthcare Utilization: The Influence of Health Status ... 66
Policy Implications ... 67
xi
Understanding QHPs ... 67
Understanding Health Benefits ... 68
Limitations ... 68
Future Directions ... 69
Longitudinal Studies ... 70
Primary Data Collection ... 70
Selection Tool... 70
Conclusion... 71
APPENDIX 1: SENSITIVITY ANALYSES FOR AIM 2 ... 72
APPENDIX 2: RANDOM EFFECTS AND TREND ANALYSIS FROM AIM 3 ... 98
xii
LIST OF TABLES
Table
1: Sliding Scale Federal Assistance for 2014 ... 9
2: Aim 1 Unadjusted Summary Statistics by 2014 Plan Type ... 30
3: Aim 1 Summary Stats by Health Risk and Metal Level ... 31
4: Aim 1 Multinomial Model Results ... 32
5: Aim 2 Summary Statistics ... 42
6: Aim 2 Key Independent Variables by Marginal Price... 43
7: Risk Ratios for Receipt of At Least One Outpatient Visit in a Month ... 44
8: Risk Ratios for Receipt of Emergency Room Visits in a Month ... 45
9: Risk Ratios for Receipt of Inpatient Visits in a Month ... 46
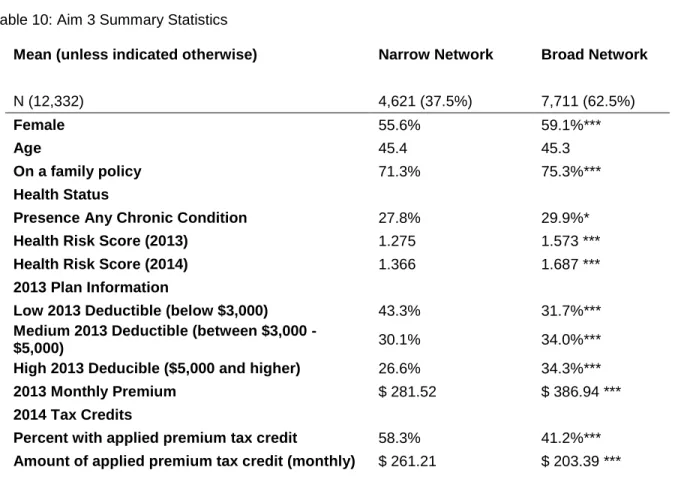
10: Aim 3 Summary Statistics ... 59
11: Unadjusted Means (with 95% Confidence Intervals (CI)) and Percentage Change for Three Outcomes by Network and Year ... 60
12: Difference-in-Difference Model Results: Estimates and 95% Confidences Intervals (CI) for Three Outcomes ... 61
13: QIC Comparison with Different Interpretations of Risk Score for all Three Outcomes ... 85
14: Sensitivity Analysis for Operationalizing the Risk Score Variable ... 86
15: Marginal Cost of Care by Maximum Enrolled Month ... 87
16: Sensitivity Analysis for Definition of “Recent” Outpatient Visit ... 88
17: Sensitivity Analysis for Inclusion of Individuals with No Copayments and No HSA ... 89
18: Sensitivity Analysis of Operationalization of Time Enrolled ... 90
19: Variance Inflation Factor Scores ... 91
20: Coinsurance Size by Subgroup ... 91
21: Sensitivity Analysis for operationalizing Marginal Cost of Care Indicators ... 92
22: Sensitivity Analysis 1 (Direct Effect of Marginal Cost on ER and IP) ... 94
23: Sensitivity Analysis 2 (Direct Effect of Recent Outpatient Visit on ER and IP) ... 95
24: Probabilities of Outcomes ... 96
xiii
LIST OF FIGURES
Figure
1: Sample Inclusion ... 29 2: Relative Risk of Utilization by Health Risk and Type of Visit ... 66 3: Aim 3 Outpatient Visits (Professional and Facility Claims with Physicians or
Mid-Level Providers - excluding inpatient and emergency room visits) ... 100 4: Aim 3 Percent of Outpatient Visits with Physicians or Mid-Level Providers
xiv
LIST OF ABBREVIATIONS
ACA The Patient Protection and Affordable Care Act ACSCs Ambulatory Care Sensitive Conditions
AHRQ Agency for Healthcare Research and Quality AIC Akaike's Information Criterion
APTC Advanced Premium Tax Credit CHF Congestive Heart Failure
CI Confidence Interval
COPD Chronic Obstructive Pulmonary Disease CSR Cost-Sharing Reduction
E&M Evaluation and Management
ER Emergency Room
FE Fixed Effects
FPL Federal Poverty Level HSA Health Savings Account HDHP High Deductible Health Plan HMO Health Maintenance Organizations
ICD-9 Codes International Classification of Diseases, 9th revision, Clinical Modification codes
IP Inpatient
MCC Marginal Cost of Care OOP Max Out-of-Pocket Maximum
OP Outpatient
OR Odds Ratio
POS Point of Service
PPO Preferred Provider Organization PQIs Prevention Quality Indicators QHP Qualified Health Plan
xv RAND HIE RAND Health Insurance Experiment
REF Reference Category
RE Random Effects
RR Risk Ratio
US United States
1
CHAPTER 1: DETERMINANTS AND EFFECTS OF PLAN SELECTION: OVERVIEW
Specific Aims
The Marketplaces established by the Patient Protection and Affordable Care Act (ACA) fundamentally altered the health insurance market by fostering a consumer-driven atmosphere and expanding the non-group market in an industry previously dominated by group purchasing. The Marketplaces were platforms through which consumers could compare qualified health plans (QHPs) being sold in the non-group health insurance market in their area. QHPs were health insurance plans that were certified as having met the regulations and standards of the ACA, such as limits on out-of-pocket spending, coverage of essential health benefits, and modified community rated premiums (Department of Health and Human Services, 2014). Additionally, the actuarial value of the QHPs had to align with ACA specified generosity levels represented by metal designations ("The Patient Protection and Affordable Care Act," 2010). Federal assistance, in the form of premium reducing tax credits and cost sharing reductions, was available to qualified individuals who enrolled in a QHP (Kaiser Family Foundation, 2012a). The ACA also required that QHPs extend benefits to all potential beneficiaries, regardless of any pre-existing conditions. Coverage of pre-existing conditions, modified community ratings, and premium subsidies attracted new entrants to the market who had previously been unable to purchase health insurance. The individual mandate, which required all US citizens to have adequate health insurance, also spurred new entrants to the market, perhaps some who had not previously been interested in health insurance coverage. Between 2013 and 2015, the non-group market expanded 211% from 8.5 million individuals to 17.9 (Carman et al., 2015a).
2
standardization. Health insurance plan selection is difficult because it involves understanding complicated plan designs, comparison of multiple plan options, consideration of future known healthcare needs, and decision-making under uncertainty (Lore, Gabel, McDevitt, & Slover, 2012) (Baicker, Congdon, & Mullainathan, 2012) (Long et al., 2014). Although difficult, selecting a health plan is important and can have real consequences on healthcare utilization and out-of-pocket costs.
In this dissertation I elucidated observable characteristics associated with plan selection in the 2014 non-group health insurance market and analyzed the effect of plan selection on healthcare utilization and out-of-pocket costs to the beneficiary. The objectives of this research were to understand: (1) how consumers behaved in year one of the new health insurance Marketplaces; and (2) how they responded to plan incentives in non-group health insurance market. To achieve this I addressed three specific aims: Aim 1. Determine the key observable factors associated with plan switching and plan selection in the
health insurance Marketplace.
Aim 2. Analyze the extent to which the marginal cost of care affected the utilization of healthcare services for ambulatory care sensitive conditions.
Aim 3 Assess the effect of network choice on number of outpatient visits, percentage of visits with providers participating in the narrow network, and out-of-pocket costs.
The data come from a large insurer. In 2014, this insurer was one of only two companies offering QHPs in the state Marketplace and the only insurer offering QHPs in every county; in 2013, it had 86% of the non-group market (The Kaiser Family Foundation State Health Facts, 2013). I utilized claims data which included not only healthcare services but the costs of those services as well. I also directly observed plan benefit information such as deductibles, coinsurance, and premiums.
Study findings could positively impact the non-group health insurance market by providing a better understanding of consumer behavior in the first year of Marketplace operation. Historically, the non-group market has not often been studied, but it’s becoming increasingly important as it continues to grow under the provisions of the ACA (Nadash & Day, 2014; M. V. Pauly & Nichols, 2002; Sommers, 2014). The non-group market operates differently than the markets for public and employer-sponsored non-group health insurance; in the non-group market each individual agent self-selects a health plan based on their
3
2012; Lako, Rosenau, & Daw, 2011). Effective policies require that consumers understand the health insurance system and appropriately respond to incentives in the benefits structure of health plans. Industry leaders and policymakers need to understand consumer behavior with regards to recent reforms in order to create future policies that preserve or increase access to quality care while containing costs.
The non-group health insurance market, in which individuals compare a large number of options and purchase health plans directly from insurers, is growing (Carman et al., 2015a). The ACA sets up a market that promotes consumerism and individual choice (Oberlander, 2014). Industry leaders and policymakers need to provide understandable information to consumers so that individuals are able to make informed decisions when selecting and using health insurance benefits. Individuals must take a broader view of health insurance by not reacting solely to the immediate, up-front costs of the monthly premium, but also considering the effects of cost sharing on utilization and network size on provider selection. By analyzing enrollment during the first year of health insurance Marketplaces we can better learn how individuals are operating within the market and how they are using the plans they select.
Organization of this Dissertation
To inform the reader of important fundamentals of the ACA and to provide context, Chapter 2 provides relevant details of the ACA as well as an overview of the current literature. Chapters 3 through 5 are manuscripts addressing the three specific aims. Each of these chapters was written for individual submission to peer-reviewed publications and, as such, contains an introduction and conclusion relevant to the paper objective. Chapter 6 discusses the research findings and policy implications of this
4
CHAPTER 2: BACKGROUND ON THE AFFORDABLE CARE ACT AND HEALTH INSURANCE LITERATURE REVIEW
This chapter was designed to orient the reader to the current state of the non-group health insurance market. First I provide background information on health insurance and the provisions of the ACA relevant to this dissertation. Following the background section I provide a review of the current literature on plan selection and the effect of health insurance on utilization.
Background
The health insurance market can be complicated and the ACA brought many reforms to the market. In the background section below I provide fundamental information on health insurance and relevant provisions of the ACA.
Health Insurance 101
Health insurance plans use contract negotiations and risk pooling to provide beneficiaries with discounts on healthcare services. For a monthly premium, individuals enroll in a plan which assists them in paying for healthcare services throughout the policy year. To stave off moral hazard, the assumption that when individuals are shielded from the full costs of services they exhibit less discretion in their demand for care, insurance companies incorporate cost-sharing into plan design (Aron-Dine, Einav, & Finkelstein, 2013; Arrow, 1963). Cost-sharing refers to the portion of healthcare costs for which the beneficiary is responsible and can take the form of deductibles, coinsurance, copayments, or annual spending caps. Deductibles are the amount that the member has to pay before the insurance company begins to pay for services, although not all plans have deductibles. Coinsurance is the portion of the cost of care for which the member is responsible. Coinsurance is expressed as a percentage, and is
5
There are different types of health plans, all of which employ some elements of cost-sharing. Traditional health plans, such as preferred provider organization (PPOs) and point of service (POS) plans, often use copayments to encourage routine outpatient visits instead of more costly inpatient admissions, when possible. A recent trend has been the shift towards consumer directed plans or high deductible health plans (HDHPs). HDHPs encourage individuals to take more responsibility for healthcare by imposing large deductibles (defined as >$1,250 in 2014) which must be met before plans contribute towards the cost of services (Buntin et al., 2006; Internal Revenue Service, 2015).
In addition to cost-sharing, health plans use contracting and provider networks to encourage more consumer engagement in the selection of healthcare services. Starting as early as the 1970’s, mounting pressure from rising healthcare costs led to the managed care boom of the 1990s (Mechanic, 2004). The term “managed care organizations” applies to a set of healthcare products including pre-paid group practices, capitated plans, and Health Maintenance Organizations (HMOs) (Mechanic, 2004). A common, but not defining, trait of managed care was utilization management under which a third-party regulated care for beneficiaries (Mechanic, 2004). The late 1990’s saw a backlash against managed care
organizations and a return to fee-for-service plans. PPOs and POSs, under which insurers contract with groups of providers and facilities to offer in-network services to members at reduced rates, gained in popularity (Department of Health and Human Services, 2014). PPOs allow beneficiaries to get care from wherever they choose, but members pay more for care delivered from providers and facilities who were not contracted to be “preferred providers” within the plan network. Today’s healthcare system includes hybrid plans, which combine aspects of HMOs, PPOs, POSs, and HDHPs to reduce moral hazard and encourage more consumer involvement (Mechanic, 2004).
The Affordable Care Act and Market Expansion
6
Patient Protection and Affordable Care Act," 2010). The passage of the ACA immediately provided coverage for individuals with pre-existing conditions (guaranteed issue), first through high-risk pools and then by prohibiting plans from excluding pre-existing conditions (section 1101) ("The Patient Protection and Affordable Care Act," 2010). Arguably, one of the most impactful portions of the law was the
individual mandate, as it has come to be called, and the creation of the state-based and federal-facilitated marketplaces. The individual mandate stipulated that all individuals purchase, and are covered by, adequate health insurance, unless exempt (section 1501) ("The Patient Protection and Affordable Care Act," 2010). To provide access to adequate health insurance, the ACA called for the creation of the health insurance Marketplaces (Marketplaces), a forum where individuals in each state could shop for insurance plans that would provide acceptable levels of coverage. The Marketplaces were intended to (and
arguably have) facilitated the comparison and purchasing of health insurance plans
In 2014, 15 states opted to operate their own state-based Marketplaces while Marketplaces in other states were either supported or fully run by the Federal Government (Office of the Assistant Secretary for Planning and Evaluation, 2014). Regardless of whether the Marketplace was run by the federal or state government, for plans to be sold in the Marketplace they had to first be certified as a qualified health plan (QHP) by the Department of Insurance of the state in which the Marketplace would be operating. To obtain the QHP designation, plans had to adhere to various restrictions and stipulations outlined in the ACA. Among the ACA provisions, plans had to align actuarial value with established metal levels, use modified community ratings when setting premiums, and cover a set of essential health benefits. Metal Level Designations
7
platinum plans have an actuarial value of 90%, gold plans have an actuarial value of 80%, silver 70% (with the notable exception for plans enhanced by cost-sharing reductions (CSR) that increase the actuarial value of silver plans for qualified low income individuals), and bronze plans have an actuarial value of 60%. Catastrophic plans, which were available to individuals under 30 or those who qualify for a “hardship exemption,”1
had to meet ACA standards of offered benefits, but could have actuarial values below 60%. Within each metal level there could have been a variety of premium and cost-sharing
arrangements, so long as actuarial value remained within metal level specifications (Department of Health and Human Services, 2013).
Federal Assistance Programs
Federal assistance was provided to eligible individuals who purchased QHPs in the Marketplace. Generally, assistance was available on a sliding scale to individuals with income between 100% and 400% of the Federal Poverty Level (FPL), with additional levels of assistance available to individuals with income between 100% and 250% FPL. In addition to means-tested income qualifications, receipt of federal assistance required individuals to be United States citizens or legal immigrants. Additionally, individuals who qualified for any public form of health insurance coverage (i.e. Medicaid, the Children's Health Insurance Program, Medicare, or military coverage) and individuals with access to affordable employer-sponsored health insurance plans2 were not eligible for federal assistance (Kaiser Family Foundation, 2012a). Assistance was not available to individuals on catastrophic plans even if they were purchased in the Marketplace.
In 2014, there were two types of federal assistance made available to qualified individuals to make health insurance more affordable: advanced premium tax credits (APTCs) and CSRs. Unlike many of tax credits which are distributed around income tax filing dates, the APTC was immediately applied to plan premiums to lower the monthly cost of the health insurance plan. The amount of the APTC was a function of the price of the second lowest cost silver plan in an individual’s region and that individual’s income as a percentage of FPL. Although generally the APTC was available to individuals with income between 100%
1 There are fourteen “hardship exemptions” which deal with income, employment and other factors that can influence
an individual’s ability to access health insurance (https://www.healthcare.gov/exemptions/).
2 If an employee did not have access to employer-sponsored health insurance plan with an actuarial value of at least
8
and 400% of FPL, receipt of the APTC was based on the percentage of an individual’s income that would have been consumed by the cost of the second lowest cost silver plan. APTCs were calculated so that individuals with income between 300-400% FPL would not be required to spend more than 9.5% of their income on premiums. If the second lowest cost silver plan in a region was greater than 9.5% of an individual’s income, that individual would be eligible for APTCs, but if the premiums of the second lowest cost silver plan were lower than their income that individual would be required to pay the full price of the premium of whatever plan they chose. The percentage of their income individuals are responsible for spending on health insurance premiums decreases as income as a percent of FPL decreases; for example, individuals with income between 100% and 133% FPL are only required to spend 2% of their income on insurance premiums (Figure 1) (Kaiser Family Foundation, 2012a)
Unlike APTCs, which could be used to purchase plans of all metal levels, CSR qualification was dependent on an individual having enrolled in a silver level QHP. Individuals between 100% and 250% FPL are eligible for CSR (which are available in addition to, and not in lieu of, APTCs). CSRs effectively serve to increase the actuarial value of silver plans. For example, an individual between 150% and 200% FPL who purchases a silver plan, would pay the premium for that plan (less any APTCs) but in return would get a QHP with an actuarial value of 87% (meaning they would only be responsible for
9 Table 1: Sliding Scale Federal Assistance for 2014 Income as a %
of FPL
Maximum percent of income to be spent on premium (for
APTC amount)
Actuarial Value of a Silver Plan (accounting for CSR
assistance)
Out-of-Pocket Limits (individual/ family)
under 100% no maximum 70% $6,350 / $12,700
100%-133% 2% 94% $2,250 / $4,500
133%-150% 3%-4% 94% $2,250 / $4,500
150%-200% 4%-6.3% 87% $2,250 / $4,500
200%-250% 6.3%-8.05% 73% $5,200 / $10,400
250%-300% 8.05%-9.5% 70% $6,350 / $12,700
300%-400% 9.50% 70% $6,350 / $12,700
over 400% no max 70% $6,350 / $12,700
Federal Poverty Level = FPL (Kaiser Family Foundation, 2012a) Out-of-Pocket Maximums
The ACA required all QHPs have an out-of-pocket maximum, a cap on total healthcare expenditures for which a beneficiary is responsible over the course of a policy year. The out-of-pocket maximum included all expenditures for approved services accessed within the beneficiary’s provider network, such as deductibles, coinsurance, and copayments. The out-of-pocket maximum does not include premiums or non-covered services. Out-of-network care is usually subject to a separate out-of-pocket maximum or to no pocket maximum at all (Department of Health and Human Services, 2014). In 2014, the out-of-pocket maximum for in-network care was $6,350 for an individual plan and $12,700 for a family plan (Kaiser Family Foundation, 2012a). Individuals eligible for cost-sharing federal assistance programs are only responsible for a fraction of the out-of-pocket maximum (Table 1).
Modified Community Ratings
10
provision regarding tobacco use is similar in that users cannot be charged more than 1.5 times the premium of non-users. Modified community ratings provide lower premiums to individuals who were previously expensive under medical underwriting but, because they level the playing field, modified community rated premiums can be higher than underwritten premiums for some individuals (Goldman, Leibowitz, Buchanan, & Keesey, 1997; Whitmore, Gabel, Pickreign, & McDevitt, 2011).
Essential Health Benefits
To qualify as a QHP, a plan must cover a set of essential health benefits which include the items and services within at least the following 10 categories: (1) ambulatory patient services; (2) emergency services; (3) hospitalization; (4) maternity and newborn care; (5) mental health and substance use disorder services, including behavioral health treatment; (6) prescription drugs; (7) rehabilitative and habilitative services and devices; (8) laboratory services; (9) preventive and wellness services and chronic disease management; and; (10) pediatric services, including oral and vision care (section 1302) ("The Patient Protection and Affordable Care Act," 2010).
The details of the services offered within the essential health benefit categories are based on a state specific benchmark plan which must be either one of the “…three largest small group plans, the three largest state employee health plans, the three largest federal employee health plan options, or the largest HMO (health maintenance organization) offered in the state's commercial market,” (Rules and Regulation, 2013). Costs for these services get distributed among all QHP beneficiaries, even those who do not use the services; for example, because community rated premiums do not discriminate by sex all plans pay for maternity and newborn care coverage, even if the beneficiary is a male.
Grandfathered and Transitional Plans
11
QHP. Grandfathered and Transitional plans were not subject to the same regulations required of QHPs; notably, no federal assistance was provided on non-QHPs, premiums continued to be set using medical underwriting, and there were no minimum essential health benefit requirements.
Literature Review
Although the ACA brought a lot of change to the non-health insurance market, there is much that can be learned from past reform efforts, both domestic and international (Nadash & Day, 2014). In the section below I provide a review of the current literature on re-enrolling on a health plan versus switching health plans, complications to choosing a health plan, and the effect of cost-sharing on utilization.
Plan Switching vs. Re-enrollment
Status quo bias
Switching health plans requires different motivation and levels of effort than joining a new health plan or enrolling in a current plan. In the US commercial health insurance market, individuals routinely re-enroll in a health plan during open re-enrollment periods or select a new health plan at a fixed point in time, often when they start a job or incur a qualifying event (e.g., getting married or having a child). However, switching plans during an open enrollment period requires active consumer participation. The active decision to switch health plans involves seeking out and comprehending potentially hard to find and complicated information (Lako et al., 2011; Frank, 2009).
12
However, price is not the only factor in the decision to re-enroll or switch plans, switching health plans can sometimes require individuals to choose a new provider or hospital system (Pendzialek, Simic, & Stock, 2014). Additionally, there is often no perfect substitute between plans because of provider contracting and brand recognition (K. M. Ericson & A. Starc, 2012; Keeler & Rolph, 1988).
Although status quo bias is difficult to break, switching can occur when price and / or benefit differences are sufficiently large. Buchmueller and Feldstein found that when the University of California increased premiums by $20 a month, 30% of beneficiaries switched plans, that was a 600% increase in the rate of switching compared to when premiums were constant across years (Buchmueller & Feldstein, 1997). A recent systematic literature review of the price elasticity of demand for health insurance found low elasticity of demand (-0.2 - -1.0) in the US.3 However, the study was conducted before the ACA and countries with mandatory health insurance tended to have higher elasticity, perhaps due to more options in the marketplace (Pendzialek et al., 2014). With more options and variation in price in the non-group health insurance market in the US, consumers in the Marketplace may be more willing to switch health plans in the future.
Not all individuals have the same propensity to switch health plans. In general, older and less healthy individuals are less likely to switch plans ((Buchmueller & Feldstein, 1997; Pendzialek et al., 2014). Older individuals tend to be less price sensitive than younger individuals are therefore may be less likely to respond to premium increases by switching to a lower cost plan (K. Ericson & A. Starc, 2012). Less healthy individuals and individuals with established provider relationships are less likely to switch because new plan benefits and networks may lead to disruptions in continuity of care (Lako et al., 2011).
Adverse Selection
Conditional on the decision to switch, health plan selection is influenced by price, age, sex, risk tolerance, and expected healthcare utilization (K. Ericson & A. Starc, 2012; Lako et al., 2011). Risk tolerance and expectations of future utilization can create differences in how individuals respond to prices: healthier individuals opt for cheaper, less generous plans while individuals who are less healthy
3 Elasticity of demand refers to the percentage change in demand for a good or service when the price increases by
13
and/or expect higher healthcare costs purchase more generous (and expensive) plans (Naessens et al., 2008; van den Berg et al., 2008).
The theory of adverse selection states that individuals who anticipate high medical costs are more likely to enroll in plans that offer more generous coverage and individuals who are healthier are more likely to choose a cheaper plan or opt out of the health insurance market entirely (Swartz & Garnick, 2000). Large price differentials may exacerbate adverse selection. If the price differences are large enough they may encourage healthier individuals to switch out of the expensive plan leaving only higher-risk individuals who are less price sensitive and do not respond to price changes in the same way (van den Berg et al., 2008). A plan with majority of unhealthy beneficiaries will have an unbalanced risk pool, which in turn drives up premiums even further (D. Z. Cutler, RJ., 1998). Since insurers are not allowed to employ medical underwriting in setting premiums, the ACA contains language to mitigate the effects of unbalanced risk pools between health insurers. The ACA provisions are known as the three R’s: risk adjustment, reinsurance, and risk corridors (Blumenthal, 2014).
14 Barriers to Choosing a Health Plan
Decision Fatigue
On average, the non-group health insurance market has offered more choices than are typically offered to individuals who obtain health insurance through an employer, and the ACA has expanded the number of insurers in the non-group market (Hanoch & Rice, 2006; M. Pauly, Percy, & Herring, 1999). Although numbers vary by state and rating region, on average, consumers in the 2014 Marketplaces chose between 47 plans from 5 insurers while almost 50% of individuals with employer-sponsored
coverage were offered plans from only one or two insurers (Jost, 2014). Studies of enrollment in Medicare Part D have found that participants had a difficult time choosing between plans (Hanoch, Rice,
Cummings, & Wood, 2009; Lau & Stubbings, 2012). Although studies have shown that older individuals may have more challenges making selections from a large choice set, there is also evidence of younger individuals having difficulties choosing between health insurance plans (Hanoch & Rice, 2006; Barnes, Hanoch, & Rice, 2015). As the number of choices increase, making a selection from a set of options becomes more cognitively challenging and individuals may experience decision fatigue (Rice, 2013) (Lako et al., 2011). Decision fatigue is a phenomena where, when faced with a multitude of options, individuals may rush into a suboptimal decision merely to end the decision making process (Iyengar & Lepper, 2000).
Complex Benefit Designs
15 Risk Tolerance and Uncertainty
Even for individuals who understand the concepts of health insurance, risk tolerance, and uncertainty can muddle decision making. Individuals tend to have myopic preferences, meaning they overly discount future experiences at the expense of the present. In terms of choosing a health plan, myopic preferences may lead individuals to put more weight on immediate payments for monthly premiums and focus less attention on cost-sharing structures, which will have an effect on out-of-pocket costs when care is utilized in the future (Rice, 2013). Future healthcare costs are often uncertain; while health plans for year 2 are purchased in the end of year 1, healthcare needs for year 2 are partially unknown in year 1. Individuals commonly misperceive health risks either by being overconfident in their ability to avoid common concerns or by overvaluing their susceptibility to low probability events (Baicker et al., 2012; Tversky, 1992). Any attempt to understand how individuals make decisions regarding health insurance must consider behavioral economics and theories of decision making under uncertainty to account for these behaviors (Rice, 2013; Schneider, 2004).
Cost-Sharing and Utilization
Price and Demand
The RAND health insurance experiment (RAND HIE) is considered the gold standard of utilization studies. In 1974, researchers at the RAND Corporation randomized individuals from 6 cities to 1 of 14 health plans defined by distinct combinations of coinsurance (0%, 25%, 50%, and 95%) and out-of-pocket maximums (5%, 10%, or 15% percent of family income up to $1,000) (Manning et al., 1987). The RAND HIE found that individuals and families with higher levels of cost-sharing utilized fewer services, but the forgone services were for both high and low severity care (Manning et al., 1987). Cost-sharing had a more significant effect on the number of services accessed than on the intensity of utilization and cost-sharing had less of an effect on the cost or quantity of future services accessed in a policy year after the first care event had been accessed (Manning et al., 1987).
16
more elastic at higher levels of cost-sharing (-0.31) (Lu, Frank, & McGuire, 2008). Using data from the RAND HIE, Gilleskie and Mroz found that for every percentage point increase in coinsurance (the percentage of costs paid by an insurer), health expenditures increased by an average of $6.40 (Gilleskie & Mroz, 2004). The price elasticity of demand in these examples was relative to total healthcare
expenditures and not broken out for different types of care.
A recent study of the Chilean health system found the price elasticity for elective care (receipt of which is more discretionary, represented here as psychology visits, home health visits, and physical therapy evaluations) to be fairly elastic (price elasticity of -2.08, -1.88, and -0.32 respectively) compared to marker conditions (an unavoidable, urgent condition, here as gall bladder removal, arm cast setting, and appendectomy) for which the price elasticity was close zero (Duarte, 2012; Basu, Friedman, & Burstin, 2002).
The RAND HIE is still considered the seminal work on how insurance generosity influences demand for healthcare services, however much about the healthcare landscape has changed since the RAND HIE was conducted. The rise and fall of managed care in the 1990’s, technological advances in medicine, increasing medical inflation, the ACA, and the introduction of health savings accounts and HDHPs have all changed the way healthcare is consumed in the United States.
High Deductible Health Plans
HDHPs have been shown to lower healthcare expenditures through reductions in preference sensitive and low priority care, but these plans can also cause reductions in necessary care which can have potentially deleterious downstream effects to beneficiary health. A 2014 study used propensity score matching to create an analogous control group for a sample of employees who were obligated to switch to a HDHP. This study found that the HDHPs were associated with a reduction in outpatient care for low priority chronic care but not high severity care, suggesting the plan incentives were producing the intended outcomes. However, the study also found an association between HDHPs and a reduction in high priority visits for chronic conditions, which could indicate a reduction in quality of care and health outcomes (Reddy, Ross-Degnan, Zaslavsky, Soumerai, & Wharam, 2014). In another study of employers mandating employees switch to a HDHP, Fronstin and Roebuck found an immediate decrease in
17
& Roebuck, 2013). Compared to year 0 (prior to the introduction of the HDHP), in year 1 outpatient ambulatory care dropped 13%, outpatient office visits dropped 14%, emergency room visits dropped 17%, and inpatient hospital visits dropped 33%; however, by year two office visits and outpatient ambulatory care were slightly higher than in year 0 and by year 3 emergency room visits and inpatient hospital visits were higher than year 0 by 8% and 30% respectively.
18
CHAPTER 3: PLAN SELECTION IN THE NON-GROUP MARKET IN THE FIRST YEAR OF THE HEALTH INSURANCE MARKETPLACE
Introduction
The Affordable Care Act of 2010 (ACA) established Marketplaces for health insurance where individuals could easily access, and choose among, qualified health plans (QHPs) from a variety of insurers. The ACA required that QHPs meet certain standards, such as regulations on covered benefits and premiums, which were not required of plans in the non-group market prior to 2014. The ACA mandate that all nonexempt US residents have health insurance coverage and that plans accept all consumers regardless of pre-existing conditions began the process of breaking down previously entrenched barriers to entry in the non-group health insurance market and expanded the market to new consumers.
To ease the cognitive burden of selecting a QHP among Marketplace choices, the ACA required insurers to standardize plan offerings; however, switching insurance plans always involves costs such as learning about plan options and determining which plan would best match consumers’ individual needs. For certain subgroups of individuals in the non-group market, QHPs had lower premiums and more generous benefits compared to non-QHPs. To begin to understand individual decision-making, we analyzed the characteristics associated with plan switching and plan selection in the 2014 Marketplace. We hypothesized that individuals predicted to have higher healthcare costs would choose more generous plans, while healthier individuals would select QHPs with lower premiums. In other words, since plan generosity is more valuable to individuals predicted to have higher healthcare expenditures, we expect poorer health to be associated with purchasing more generous plans.
Background - Changes in the Non-Group Market Under the Affordable Care Act Metal Level and Actuarial Value
19
expected healthcare costs the issuer will pay; for example, in a plan with an actuarial value of 90% the beneficiary would, on average, be expected to pay 10% of overall healthcare costs. Generally, platinum plans have an actuarial value of 90%, gold plans have an actuarial value of 80%, silver 70% (with the notable exception for plans enhanced by cost sharing reductions (CSRs) that increase the actuarial value of silver plans for qualified low income individuals), and bronze plans have an actuarial value of 60%. Catastrophic plans, available to individuals under 30 and individuals who meet certain income
qualifications, must meet ACA standards of benefits offered but can have actuarial values below 60%. Modified Community Rating
Medical underwriting is a common practice used by insurers to set premiums based on an individual’s age, sex, past utilization, and expected health status (Kaiser Family Foundation, 2012b). Underwritten premiums tend to be higher for individuals who are female, older, or less healthy because these individuals are likely to incur higher costs. Under the ACA, QHP premiums are generated through modified community rating, meaning they are a function only of actuarial value, region, age (with limits), number of dependents on the policy, and tobacco use ("The Patient Protection and Affordable Care Act," 2010).
Federal Assistance Programs
Some individuals may be eligible for financial assistance to increase affordability of QHPs. With some exceptions, individuals with income between 100% and 400% of the federal poverty level (FPL) are eligible for an Advanced Premium Tax Credit (APTC) which provides an immediate credit to the
purchaser to lower their monthly premium. Individuals with income between 100% and 250% FPL who enroll in a silver plan may also be eligible for additional assistance through CSRs.
Regulations on QHP Generosity and Plan Benefits
non-20
group market, was included with no extra cost on all QHPs because modified community rating does not allow for premiums to discriminate by sex.
Grandfathered / Transitional Plans
The ACA contained a provision to allow individuals enrolled in a non-group plan as of March 10, 2010 (when the law passed) to remain in that particular plan (“Grandfathered plans”) rather than switching to a QHP. In 2013, it was announced that individuals who did not qualify for Grandfathered status would be allowed to remain in a ACA compliant plan in 2014 so long as they were already enrolled in a non-group plan as of October 1, 2013 (“Transitional plans”) (Lucia, 2014). Individuals in Grandfathered or Transitional plans could stay in their 2013 plan or switch to a QHP; however, they could not enroll in another non-QHP in 2014. Grandfathered and Transitional plans were not subject to the same regulations required of QHPs.
Status Quo Bias and Active Plan Selection
Previous studies have found that individuals tend to reenroll in, rather than switch, plans regardless of potential cost savings (status quo bias) (Frank, 2009; Strombom et al., 2002). Evidence of this “status quo bias” has been observed in non-US health insurance markets (where switching health plans has low transaction costs) and among Medicare Part D beneficiaries (even when switching would result in lower premiums and out-of-pocket costs) (Hunt Kearsley et al., 2012; Lako et al., 2011; Neuman, 2009). In the US commercial health insurance market, individuals regularly select a health plan at a fixed point in time, often when they start a job or incur a qualifying event (e.g. getting married or having a child). However, switching plans, as opposed to automatically reenrolling, requires active consumer participation involving seeking out and comprehending the information necessary for active decision-making (Lako et al., 2011; Frank, 2009).
Conditional on the decision to switch, health plan selection is influenced by age, sex, risk
21
policymakers and industry leaders understand the interaction between price and plan generosity for different groups of consumers in the health insurance Marketplaces.
In this study, we used claims data from a large insurer with high market share on the state exchange to explore individual characteristics associated with the decision to switch to a QHP and, conditional on switching, selection of metal level in a Federally Facilitated Marketplace. We examined differences in the effect of APTCs on plan selection for individuals with varying risk of incurring high health costs. We hypothesized that individuals predicted to have higher healthcare expenditures would apply their tax credit towards the purchase of health plans with higher actuarial value while individuals predicted to have lower healthcare expenditures would focus more on premium price and purchase plans with lower actuarial value.
Data and Methods Data and Sample
22 Outcome Variable
The outcome variable of interest was metal level, representing the actuarial value of the selected plan: platinum (90% actuarial value), gold (80% actuarial value), silver (70% actuarial value), and bronze (60% actuarial value).
Key Independent Variables Health Risk
Risk scores have been used to represent heath status (Albert, 2006; Thomas, 2006). We used an episode-based health risk score generated by an Ingenix Symmetry® algorithm accounting for age, sex, and healthcare claims from the previous 12 months (Symmetry® Episode Treatment Groups®, 2012). Our model utilized the prospective risk score, which combines demographics and claims data from the past 12 months to calculate a risk score that predicts the risk of an individual being high cost in the subsequent year (Symmetry® Episode Treatment Groups®, 2012). The risk score was standardized to mean=1.0 (indicating average health risk with >1.0 at higher risk of being high cost compared to the rest of the sample) and standard deviation=1.0.
Characteristics of Individuals and Policies
Age, sex, and details of plan benefits came from claims and plan enrollment data. Age on May 1, 2014 was categorized into three age groups (18-35, 36-50, 51-64). Also in the model was a binary
variable for whether an individual had an APTC in 2014 as well as a continuous variable for the amount of the APTC (zero if no tax credit was received).
Analysis
The sample was comprised of two types of individuals: those who chose to remain in a Grandfathered / Transitional Plan in 2014 and those who chose to switch to a QHP. Our first analysis examined plan switching using chi-squared and t-tests to compare characteristics of switchers to non-switchers and presents descriptive statistics on cost. Measures of cost include monthly premiums (the monthly price of health insurance), deductibles (the amount the member must pay for services before the plan contributes), and annual out-of-pocket maximums (the maximum amount of expenditures -
23
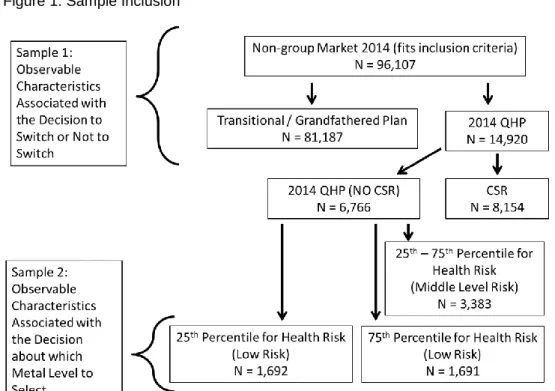
Our second analysis used a multinomial logit model to generate estimates of the effects of characteristics on selection of a metal level by those who switched. When modeling plan selection among those who switched, we excluded individuals with CSRs. Qualified individuals were required to enroll in a silver plan in order to receive CSRs, which meant the decision-making process for metal level selection was different for these individuals. The multinomial model for this analysis included only high-risk and low-risk individuals (Figure 1): high-low-risk were individuals for whom costs were expected to be higher than 75% of the sample while low-risk individuals were expected to have costs in the bottom 25th percentile. We presented odds ratios (OR) and 95% confidence intervals (CI). All analyses were conducted in SAS Enterprise Guide 6.1 (SAS Institute, 2011).
Results Switching
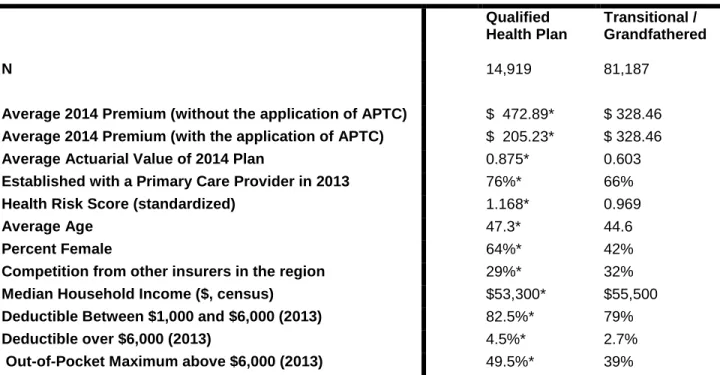
Of the 96,106 individuals who met eligibility criteria, 81,187 (84%) remained in the same plan in which they were enrolled in 2013 (Grandfathered or Transitional) (Figure 1). Table 2 presents unadjusted, descriptive statistics by whether or not an individual switched to a QHP or stayed on a Grandfathered / Transitional plan. Individuals who switched to a QHP were more likely to have been female (64% v. 42% P<0.0001), older (average age 47.3 v. 44.6 P<0.0001), and had a greater risk of having higher healthcare costs in 2014 (mean risk score 1.168 v. 0.969 P<0.0001).
Less Costly - Modified Community Ratings and Premium Costs
Without tax credits, QHP premiums were, on average, more expensive than premiums for Grandfathered / Transitional plans. For individuals in the sample without APTCs, the average monthly QHP premium was $472.36, however, with APTCs the average QHP monthly premium was $205.23, lower than the average 2014 Transitional / Grandfathered Plan premium ($328.13) (Table 2). The average APTC value in this sample was $354.45, and 75% of individuals in a QHP received an APTC. More Generous - QHP Regulations and Plan Generosity
The same subgroups that would have been most likely to benefit from modified community rating (women, older individuals, and higher predicted costs) also would have been most likely to benefit from ACA regulations on QHP benefits. In general, QHPs were more generous than Grandfathered /
24
value for Grandfathered / Transitional Plans (87.5% v. 60.3% P <0.0001). Compared to individuals with lower cost sharing in 2013, a higher percentage of individuals in less generous 2013 plans switched to QHPs in 2014. Individuals who switched to QHPs had higher 2013 out-of-pocket maximums (OOP max) (50% of those in QHPs had OOP max >$6,000 in 2013 v. 39% of individuals who were in Grandfathered / Transitional plans in 2014, P<0.0001) and higher deductibles (82.5% of those in QHPs had 2013
deductibles between $1,000 and $6,000 and 4.5% had 2013 deductibles >$6,000 v. 79% and 2.7% for those in 2014 Grandfathered/Transitional plans, P<0.0001) (Table 2).
Decision-Making among Beneficiaries who Switched Plans: Choice of Metal Level
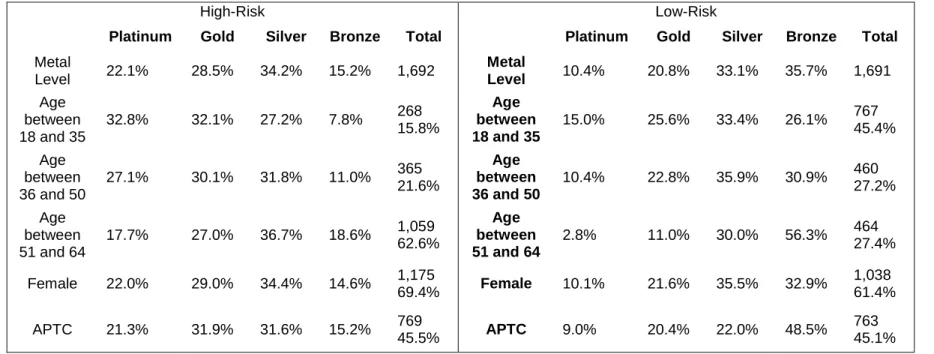
Plan selection was modeled separately for 1,691 high-risk (cut-off risk score = 1.287) and 1,692 low-risk (cut-off risk score = 0.392) individuals (Figure 2). High-risk individuals were older (51.0 v. 40.4, P<0.0001), more likely to be female (69% v. 61%, P<0.0001), and had higher average APTCs ($153.75 v. $124.97, P<0.0001). Compared to low-risk individuals, high-risk individuals were less likely to select bronze plans (15.2% v. 35.7%, P<0.0001) and more likely to select platinum (22.1% v. 10.4%, P<0.0001) and gold plans (28.5% v. 20.8%, P<0.0001) (Table 3).
Effect of APTC on Metal Level
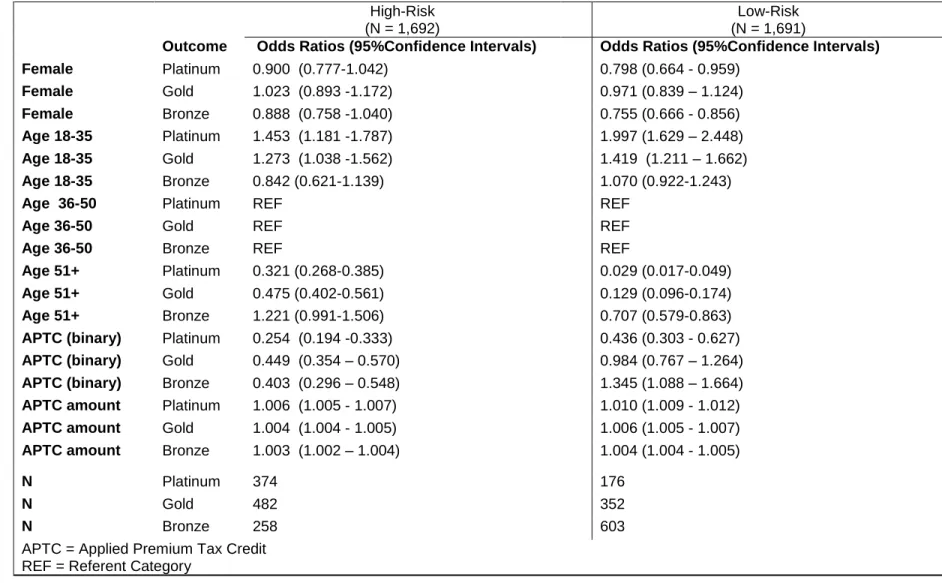
Both high and low-risk individuals with APTCs had lower odds of selecting a platinum or gold plan over a silver plan compared to individuals without a tax credit (high-risk, platinum: OR = 0.25, CI: 0.19-0.33; high-risk, gold: OR =0.45, CI: 0.35-0.57; low-risk, platinum: OR= 0.44, CI: 0.30-0.63; low-risk, gold: OR=0.98, CI: 0.77-1.26). Compared to high-risk individuals without APTCs, high-risk individuals with APTCs had lower odds of selecting a bronze plan over a silver plan (OR=0.40, CI: 0.30-0.55). The opposite was true for low-risk individuals, compared to those without APTCs, low-risk individuals with APTCs had higher odds of selecting a bronze plan over a silver plan (OR =1.35, CI: 1.09- 1.66) (Table 4). Effect of Demographics on Metal Level
25
both high-risk and low-risk without tax credits) had lower odds of selecting a platinum or gold plan over a silver plan (high-risk, platinum: OR =0.32, CI: 0.17-0.39; high-risk, gold: OR =0.48, CI: 0.40-0.56; low-risk, platinum: OR= 0.03, CI: 0.02-0.05; low-risk, gold: OR=0.13, CI: 0.10-0.17). Low-risk, older individuals without APTCs had lower odds of selecting a bronze plan over a silver plan compared to low-risk individuals age 36-50 without a APTCs (OR =0.71, CI: 0.58-0.86) while age had no effect on the odds of selecting a bronze or silver plan for high-risk individuals between the ages of 36 and 65 without APTCs (OR =1.22, CI: 0.99-1.51) (Table 4).
Discussion
The health insurance Marketplaces reduced barriers to enrollment in non-group health plans; in 2013 there were 8.5 million individuals in the non-group market and by 2015 that number had grown to 17.9 million (Carman et al., 2015a). Using claims from an insurer with high market share in the non-group market, we provide evidence to support our hypothesis that individuals would break status quo bias if the alternative plans were less expensive and/or more generous. Individuals who would benefit most from modified community ratings and regulations imposed on QHPs were more likely to switch. Individuals who switched to a QHP were more likely to be female, older, and at higher risk for being high cost. To
decouple the influence of alternative plans being less costly and more generous, we conducted a
multinomial model of plan selection for the highest and lowest risk individuals. As hypothesized, receipt of APTCs was associated with selecting more generous plans for high-risk individuals and less generous plans for low-risk individuals. Contrary to prior studies which found older individuals to be less price sensitive, our results found older individuals were more likely to select less costly plans. This finding may suggest unintended consequences of age based pricing.
Effect of APTCs on Metal Level
26
and services. Individuals who qualify for an APTC would be lower income and therefore may be more concerned about the premium price than the actuarial value of the plan.
High-risk individuals with APTCs had lower odds of selecting a bronze plan over a silver plan compared to high-risk individuals without APTCs; this may suggest that these individuals are using their tax credit on more generous health insurance, prioritizing that choice over spending their income on other goods. Individuals at risk for higher healthcare expenditures would be willing to spend more in premiums for a plan with higher actuarial value. The APTCs would make the silver plans affordable so these individuals would be more likely to choose silver over bronze plans; however, without APTCs, some high-risk individuals may have been priced out of plans with actuarial values above bronze.
Age and Metal Level
Controlling for receipt of APTCs and being at risk of higher expenditures, older individuals had lower odds of selecting a platinum or gold plan over a silver plan. This is surprising given prior work suggesting that older individuals are less price sensitive than younger individuals (K. Ericson & A. Starc, 2012). However, without tax credits, premiums for more generous plans may have been too high for older individuals; premiums for older individuals can be up to three times as large as those for younger
individuals ("The Patient Protection and Affordable Care Act," 2010). Older individuals, and those predicted to have incurred more costs, were more likely to switch to a QHP in 2014, but perhaps without tax credits the premiums on gold and platinum QHPs were high enough to deter older individuals, even those who are high-risk (D. Cutler, Lincoln, & Zeckhauser, 2010; Lore et al., 2012).
Limitations
There are several limitations of our study. First, we lack a good proxy measure for income. Income for individuals in a 2014 QHP could be roughly imputed from receipt of various levels of federal
27
(APTCs), when individuals opted to defer receipt of tax credits until the income tax filing date credits were not observed. Second, generalizability was limited because we studied beneficiaries enrolled with one particular insurer in both 2013 and 2014; however this insurer had a significantly large market share of the State’s non-group health insurance beneficiaries (The Kaiser Family Foundation State Health Facts, 2013). Finally, individuals who were new to the insurance market in 2014 may have exhibited different behaviors that those in our sample. Individuals with CSR also may have behaved differently but they were also were excluded from the sample. The focus of this analysis was the effect of the APTC on metal level. A majority of individuals eligible for CSR would have selected silver plans because, had they selected another metal level, they would have been ineligible for the subsidy. Additionally, CSR recipients are very low income (100%-250% FPL), which also may also have affected plan selection.
Conclusions
The Marketplace allows (and the ACA requires) everyone in the US who is not otherwise exempt to purchase a health plan or pay a penalty. Receipt of APTCs influenced behavior in the plan selection process and had different effects depending on predicted future healthcare expenditures. Plans with low actuarial value have been criticized for not offering individuals’ sufficient financial security and adequate access to care. However, considering consumers operate under a fixed budget for health insurance and all other goods, for some individuals who expect low healthcare spending over the following year, a plan with lower actuarial value may provide adequate benefits and access while allowing them to purchase other needed and desired goods and services. For individuals at risk of high healthcare costs, APTCs allow individuals to purchase plans with higher actuarial value than would otherwise have been affordable.
28
plan selection affect utilization and health status. Even within a metal level, plans can have different levels of cost sharing which can impact utilization and out-of-pocket costs (Lore et al., 2012).
29
Tables and Figures
30
Table 2: Aim 1 Unadjusted Summary Statistics by 2014 Plan Type
* = p<0.001
Qualified Health Plan
Transitional / Grandfathered
N 14,919 81,187
Average 2014 Premium (without the application of APTC) $ 472.89* $ 328.46 Average 2014 Premium (with the application of APTC) $ 205.23* $ 328.46
Average Actuarial Value of 2014 Plan 0.875* 0.603
Established with a Primary Care Provider in 2013 76%* 66%
Health Risk Score (standardized) 1.168* 0.969
Average Age 47.3* 44.6
Percent Female 64%* 42%
Competition from other insurers in the region 29%* 32%
Median Household Income ($, census) $53,300* $55,500
Deductible Between $1,000 and $6,000 (2013) 82.5%* 79%
Deductible over $6,000 (2013) 4.5%* 2.7%
Out-of-Pocket Maximum above $6,000 (2013) 49.5%* 39%
Table 3: Aim 1 Summary Stats by Health Risk and Metal Level
High-Risk Low-Risk
Platinum Gold Silver Bronze Total Platinum Gold Silver Bronze Total Metal
Level 22.1% 28.5% 34.2% 15.2% 1,692
Metal
Level 10.4% 20.8% 33.1% 35.7% 1,691 Age
between 18 and 35
32.8% 32.1% 27.2% 7.8% 268
15.8%
Age between 18 and 35
15.0% 25.6% 33.4% 26.1% 767 45.4% Age
between 36 and 50
27.1% 30.1% 31.8% 11.0% 365 21.6%
Age between 36 and 50
10.4% 22.8% 35.9% 30.9% 460 27.2% Age
between 51 and 64
17.7% 27.0% 36.7% 18.6% 1,059 62.6%
Age between 51 and 64
2.8% 11.0% 30.0% 56.3% 464
27.4% Female 22.0% 29.0% 34.4% 14.6% 1,175
69.4% Female 10.1% 21.6% 35.5% 32.9%
1,038 61.4%
APTC 21.3% 31.9% 31.6% 15.2% 769
45.5% APTC 9.0% 20.4% 22.0% 48.5%
763 45.1% APTC = Applied Premium Tax Credit
Table 4: Aim 1 Multinomial Model Results (Referent Outcome is Silver) High-Risk
(N = 1,692)
Low-Risk (N = 1,691)
Outcome Odds Ratios (95%Confidence Intervals) Odds Ratios (95%Confidence Intervals)
Female Platinum 0.900 (0.777-1.042) 0.798 (0.664 - 0.959)
Female Gold 1.023 (0.893 -1.172) 0.971 (0.839 – 1.124)
Female Bronze 0.888 (0.758 -1.040) 0.755 (0.666 - 0.856)
Age 18-35 Platinum 1.453 (1.181 -1.787) 1.997 (1.629 – 2.448)
Age 18-35 Gold 1.273 (1.038 -1.562) 1.419 (1.211 – 1.662)
Age 18-35 Bronze 0.842 (0.621-1.139) 1.070 (0.922-1.243)
Age 36-50 Platinum REF REF
Age 36-50 Gold REF REF
Age 36-50 Bronze REF REF
Age 51+ Platinum 0.321 (0.268-0.385) 0.029 (0.017-0.049)
Age 51+ Gold 0.475 (0.402-0.561) 0.129 (0.096-0.174)
Age 51+ Bronze 1.221 (0.991-1.506) 0.707 (0.579-0.863)
APTC (binary) Platinum 0.254 (0.194 -0.333) 0.436 (0.303 - 0.627)
APTC (binary) Gold 0.449 (0.354 – 0.570) 0.984 (0.767 – 1.264)
APTC (binary) Bronze 0.403 (0.296 – 0.548) 1.345 (1.088 – 1.664) APTC amount Platinum 1.006 (1.005 - 1.007) 1.010 (1.009 - 1.012)
APTC amount Gold 1.004 (1.004 - 1.005) 1.006 (1.005 - 1.007)
APTC amount Bronze 1.003 (1.002 – 1.004) 1.004 (1.004 - 1.005)
N Platinum 374 176
N Gold 482 352
N Bronze 258 603
APTC = Applied Premium Tax Credit REF = Referent Category
33
CHAPTER 4: INTRA-YEAR VARIATION IN THE MARGINAL COST OF CARE AND ITS EFFECT ON UTILIZATION
Introduction
Health insurance plans use beneficiary cost-sharing to reduce moral hazard in the health insurance market. Moral hazard assumes that when individuals are shielded from the full costs of healthcare services, they exhibit less discretion in their demand for care, resulting in overconsumption (Aron-Dine et al., 2013; Arrow, 1963). Cost-sharing through deductibles, coinsurance, copayments, or annual spending caps refers to the portion of healthcare costs for which the beneficiary is responsible. Traditional health plans, such as preferred provider organizations (PPOs) and point of service (POS) plans, often use copayments to encourage routine outpatient visits instead of more costly inpatient admissions when possible. Increasingly, high deductible health plans (HDHP) are being offered. HDHPs encourage individuals to take more responsibility for healthcare by imposing larger deductibles (>$1,250) before plans help pay for services (Buntin et al., 2006; Internal Revenue Service, 2015).
Past studies suggest that utilization increases when patients have lower out-of-pocket costs. Notably, the RAND health insurance experiment found beneficiaries with zero cost-sharing had a higher outpatient utilization rate than those responsible for 95% of the cost of outpatient services (Manning et al., 1987). From the beneficiary perspective, cost-sharing can lead to nonlinearities in the price of care. As beneficiaries consume more care and incur costs, they may reach their deductible or annual spending limits, after which the price of an additional unit of care changes. In this study we utilize a large dataset containing the costs of services and a monthly indicator of health status to examine the intra-year effect of nonlinearities in cost-sharing from the perspective of a beneficiary in the non-group market.
34
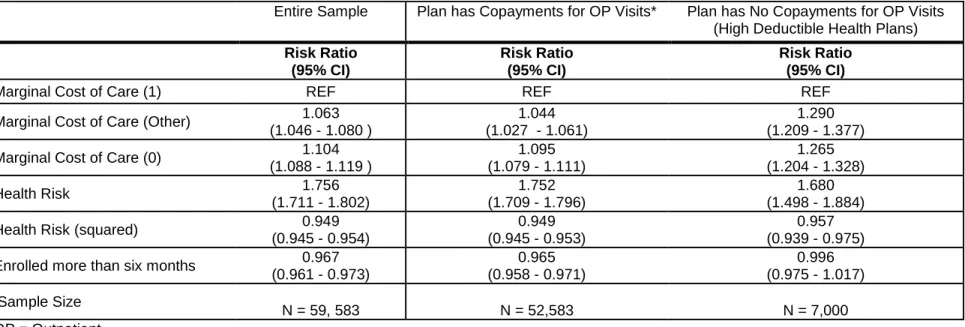
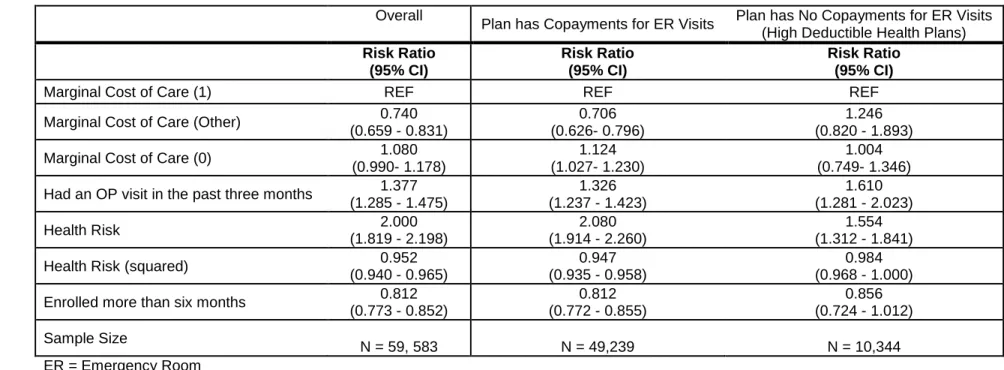
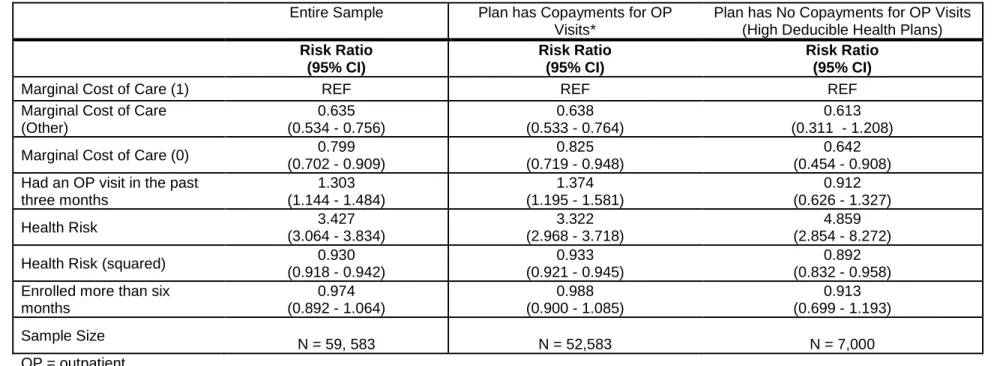
We hypothesized that: (1) individuals would be more likely to receive outpatient care when their marginal out-of-pocket cost was lower, and (2) controlling for the beneficiary’s cost responsibilities, individuals with a recent outpatient visit would have fewer ER and inpatient visits.
Data and Methods
Data and Sample
The data for this study come from a large insurer in the southeastern United States. Typically, insurers do not release contractually-negotiated reimbursement rates, but this dataset included the price of care for all services, including the cost of care to the beneficiary and to the plan. Using 2014 claims data, we analyzed all utilization and costs attributable to each beneficiary in our sample.
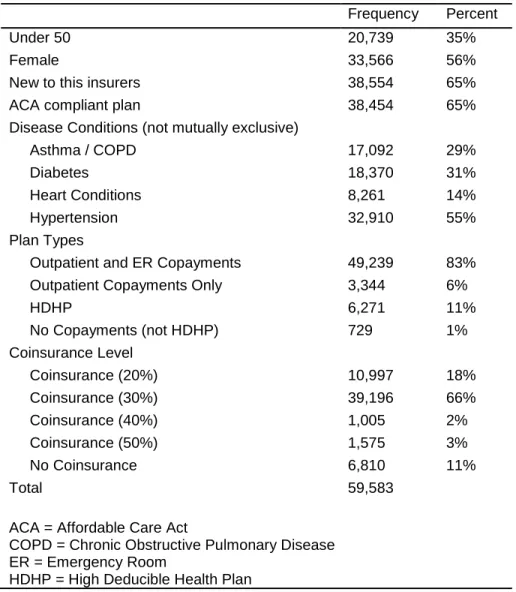
The analytical sample included individuals who were: (1) enrolled in the non-group market for at least six months of 2014 (to ensure they were enrolled long enough to observe use of care); (2) between the ages of 18 and 64 as of January 1, 2014 (working age adults who do not transition to Medicare); and (3) diagnosed with asthma, chronic obstructive pulmonary disease (COPD), diabetes, hypertension, heart failure, and/or coronary heart disease. We excluded individuals on: (1) plans exclusively serving
American Indians or Alaskan Natives as those plans frequently have zero-cost-sharing arrangements, and (2) family plans or plans with a dependent or spouse, as they have family deductibles and annual spending maximums that may change the effect of cost-sharing. Plans in the non-group market include those that were compliant with the requirements of the Affordable Care Act (ACA), and grandfathered or transitional plans, which did not adhere to ACA regulations.
Measures
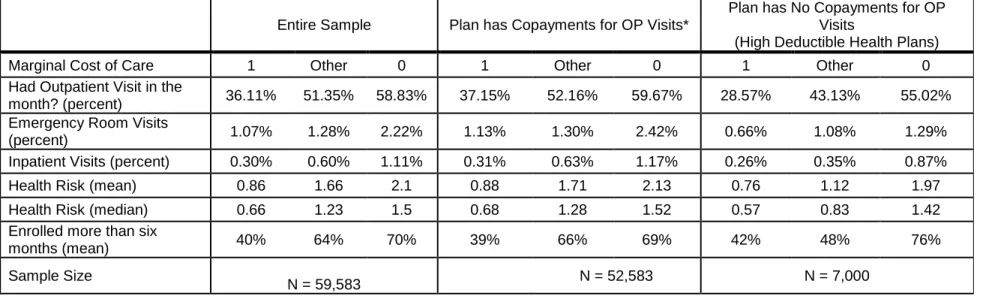
Outcome Variables